
Zabbix - Full Server Status
Updated to Zabbix 6
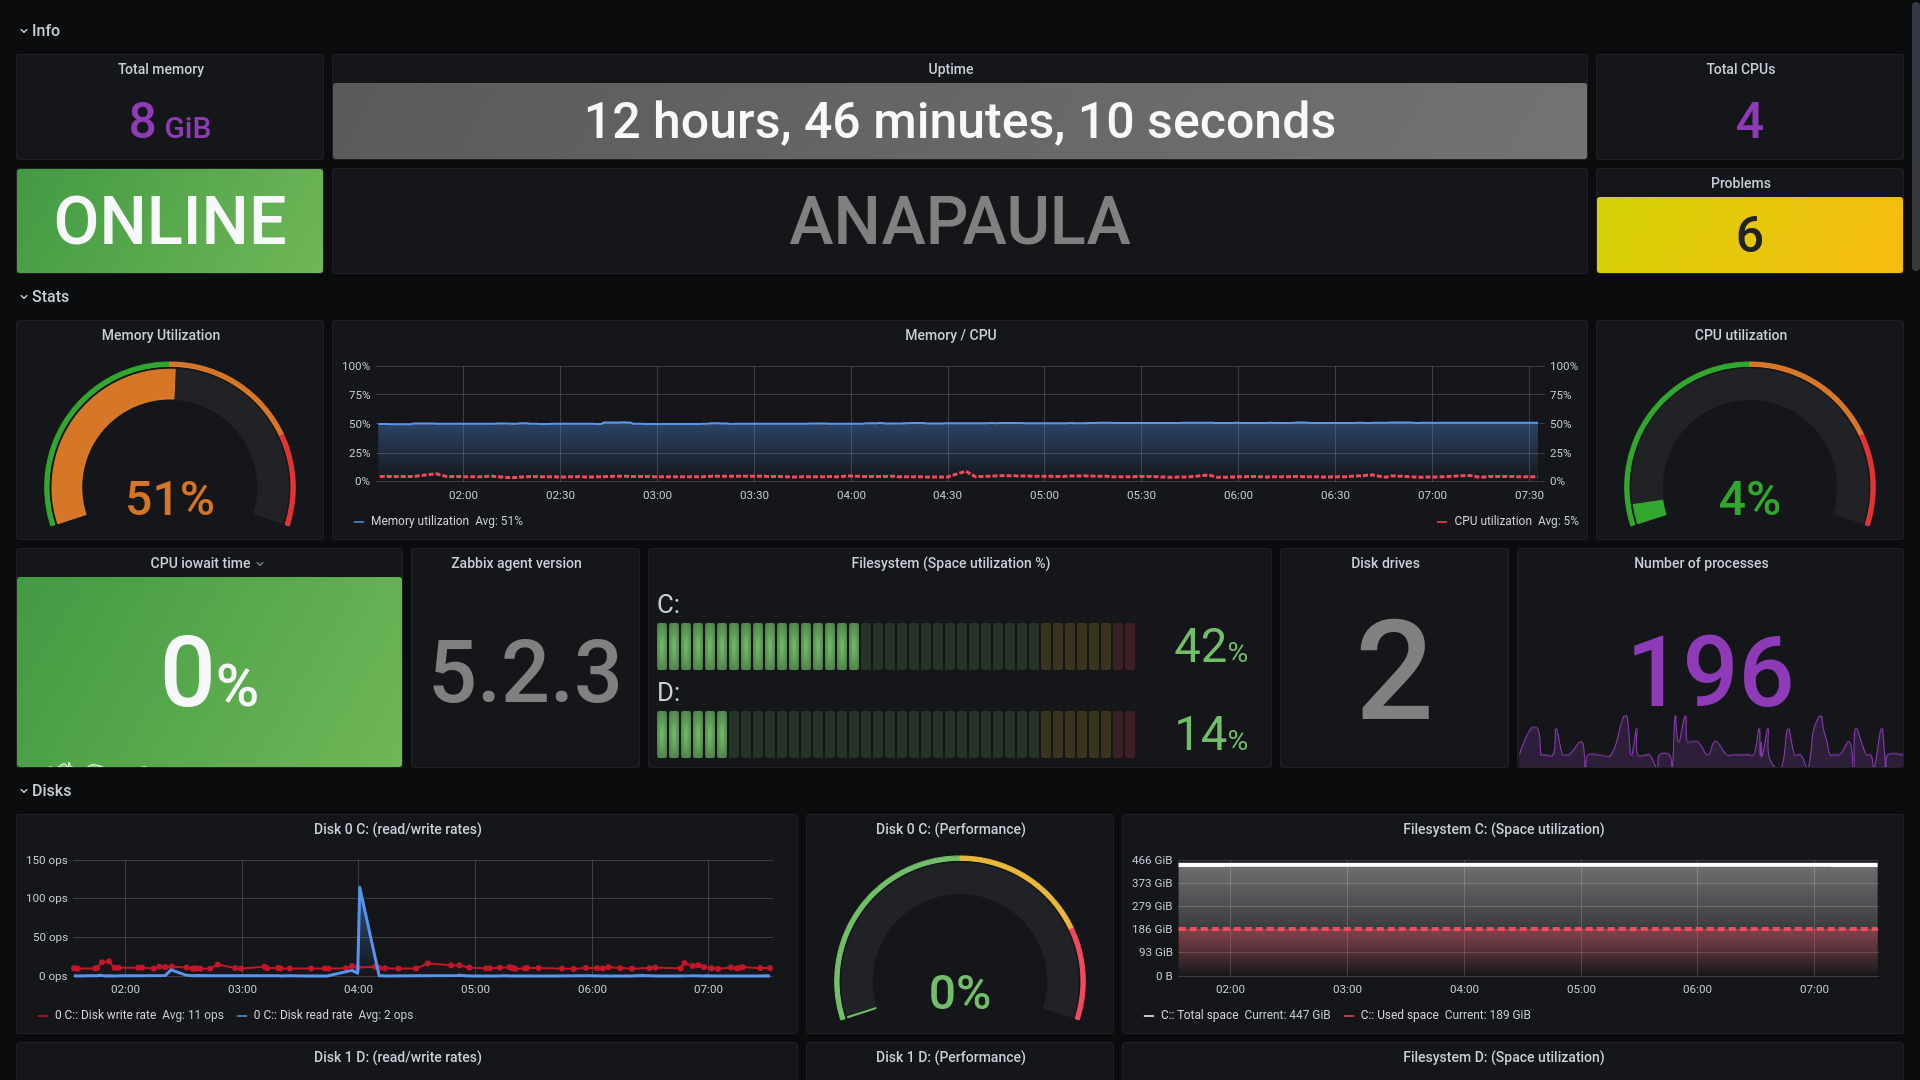
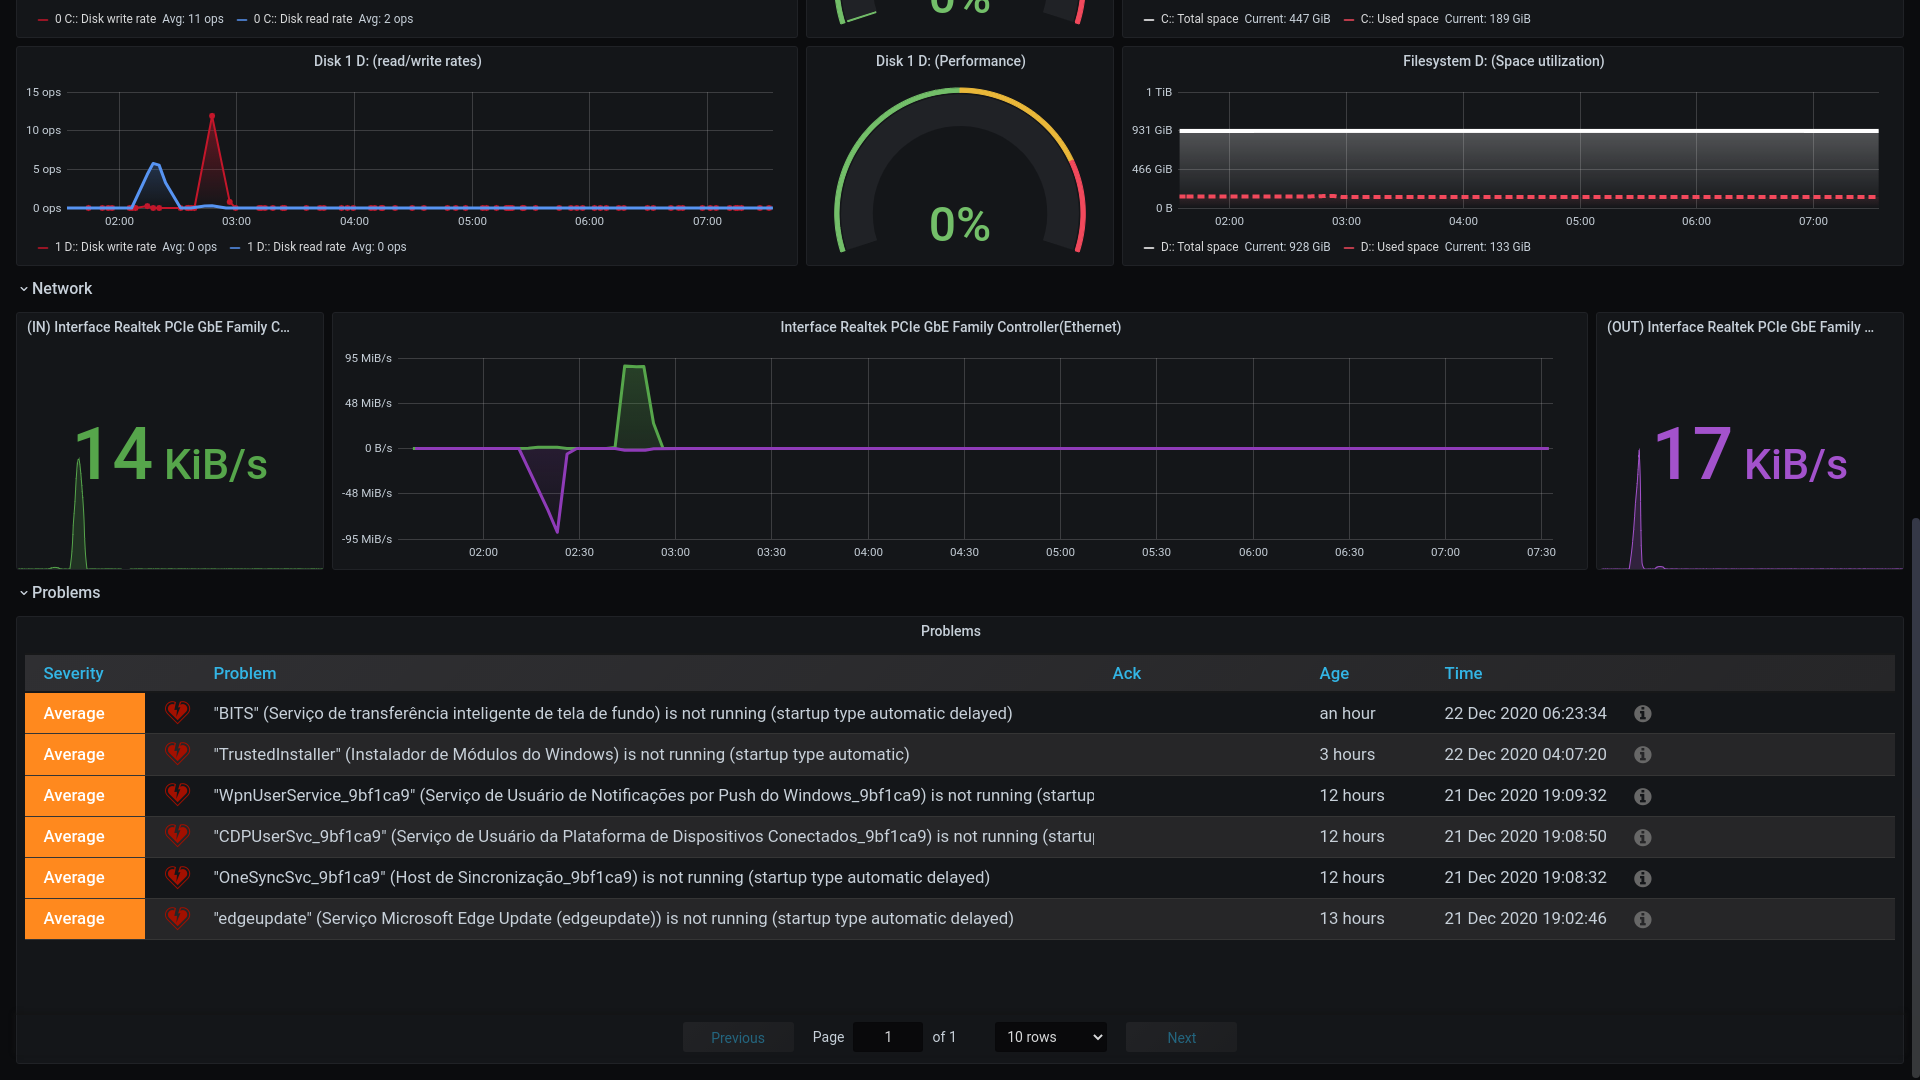
Check the status of your server’s RAM, CPU, Network Traffic, HD data, and more.
**By default, at the ‘Group’ tab, it’s only will show the groups with the name like Zabbix, Linux, and Windows, if your server doesn’t show in the dashboard, you can link there to the respective groups in Zabbix or just edit this variable in Grafana.
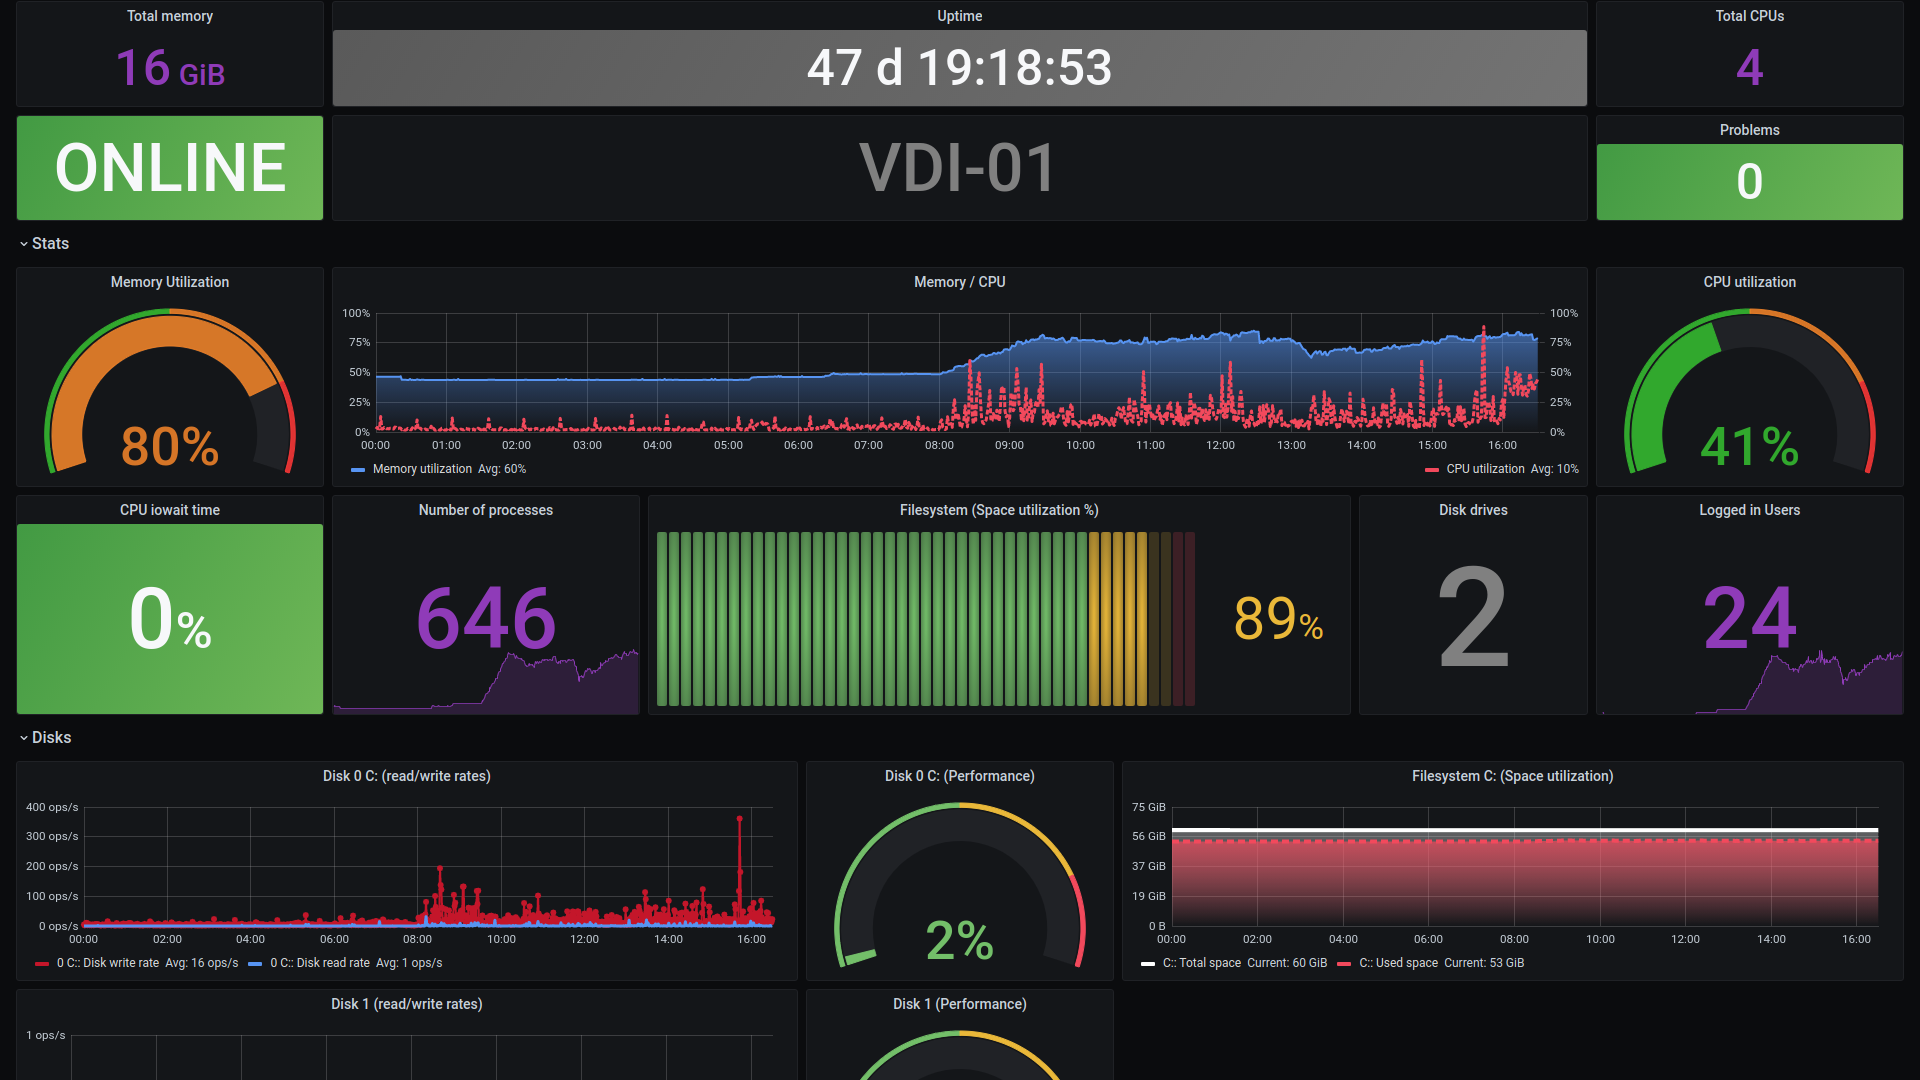
For the Logged Users count work on Windows, use this Zabbix template:
https://github.com/thePaulRichard/zabbix-templates/tree/main/windows-users
Please let me know if you have any suggestions or encounter any problems. You can contact me at paulopaim@outlook.com
Data source config
Collector type:
Collector plugins:
Collector config:
Dashboard revisions
Upload an updated version of an exported dashboard.json file from Grafana
| Revision | Decscription | Created | |
|---|---|---|---|
| Download |
Sign up for Grafana Cloud

Get up and running in minutes with the Grafana Cloud free tier, which includes free forever 10k metrics, 50GB logs, 50GB traces, 500 VUh, and more.
Get this dashboard
Data source:
Dependencies: