Jira
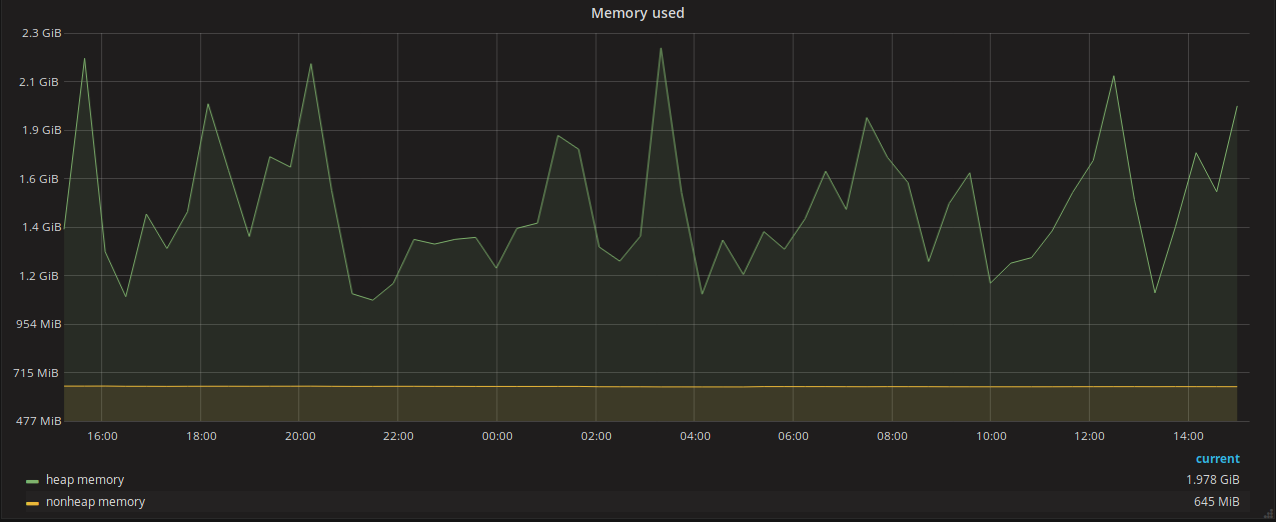
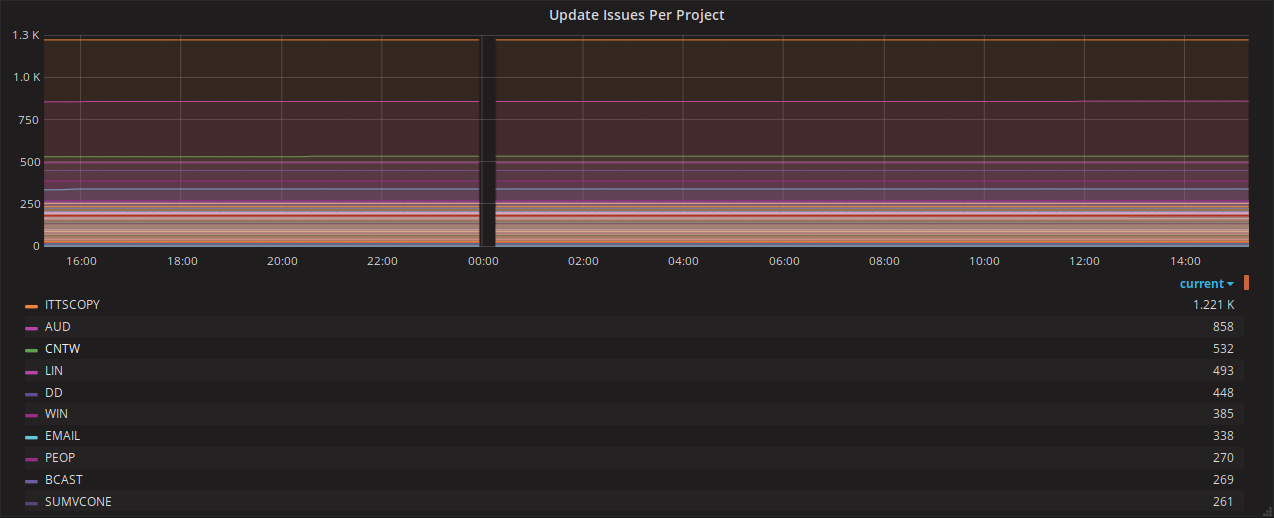
Shows Jira JVM and usage metrics
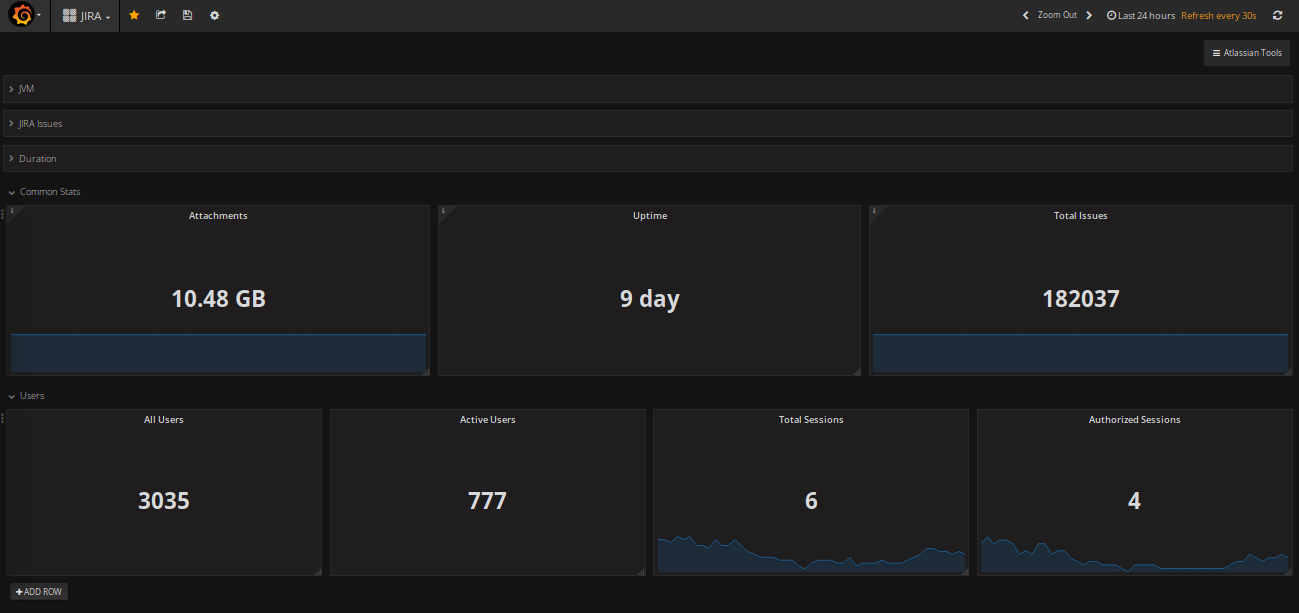


Nearly all values exported by Prometheus Exporter For Jira. Available on github: https://github.com/AndreyVMarkelov/jira-prometheus-exporter
Data source config
Collector type:
Collector plugins:
Collector config:
Revisions
Upload an updated version of an exported dashboard.json file from Grafana
| Revision | Description | Created | |
|---|---|---|---|
| Download |
Jira
Easily monitor Jira, a tool for planning, tracking, and releasing software, with Grafana Cloud's out-of-the-box monitoring solution.
Learn more