Kubernetes Deployments
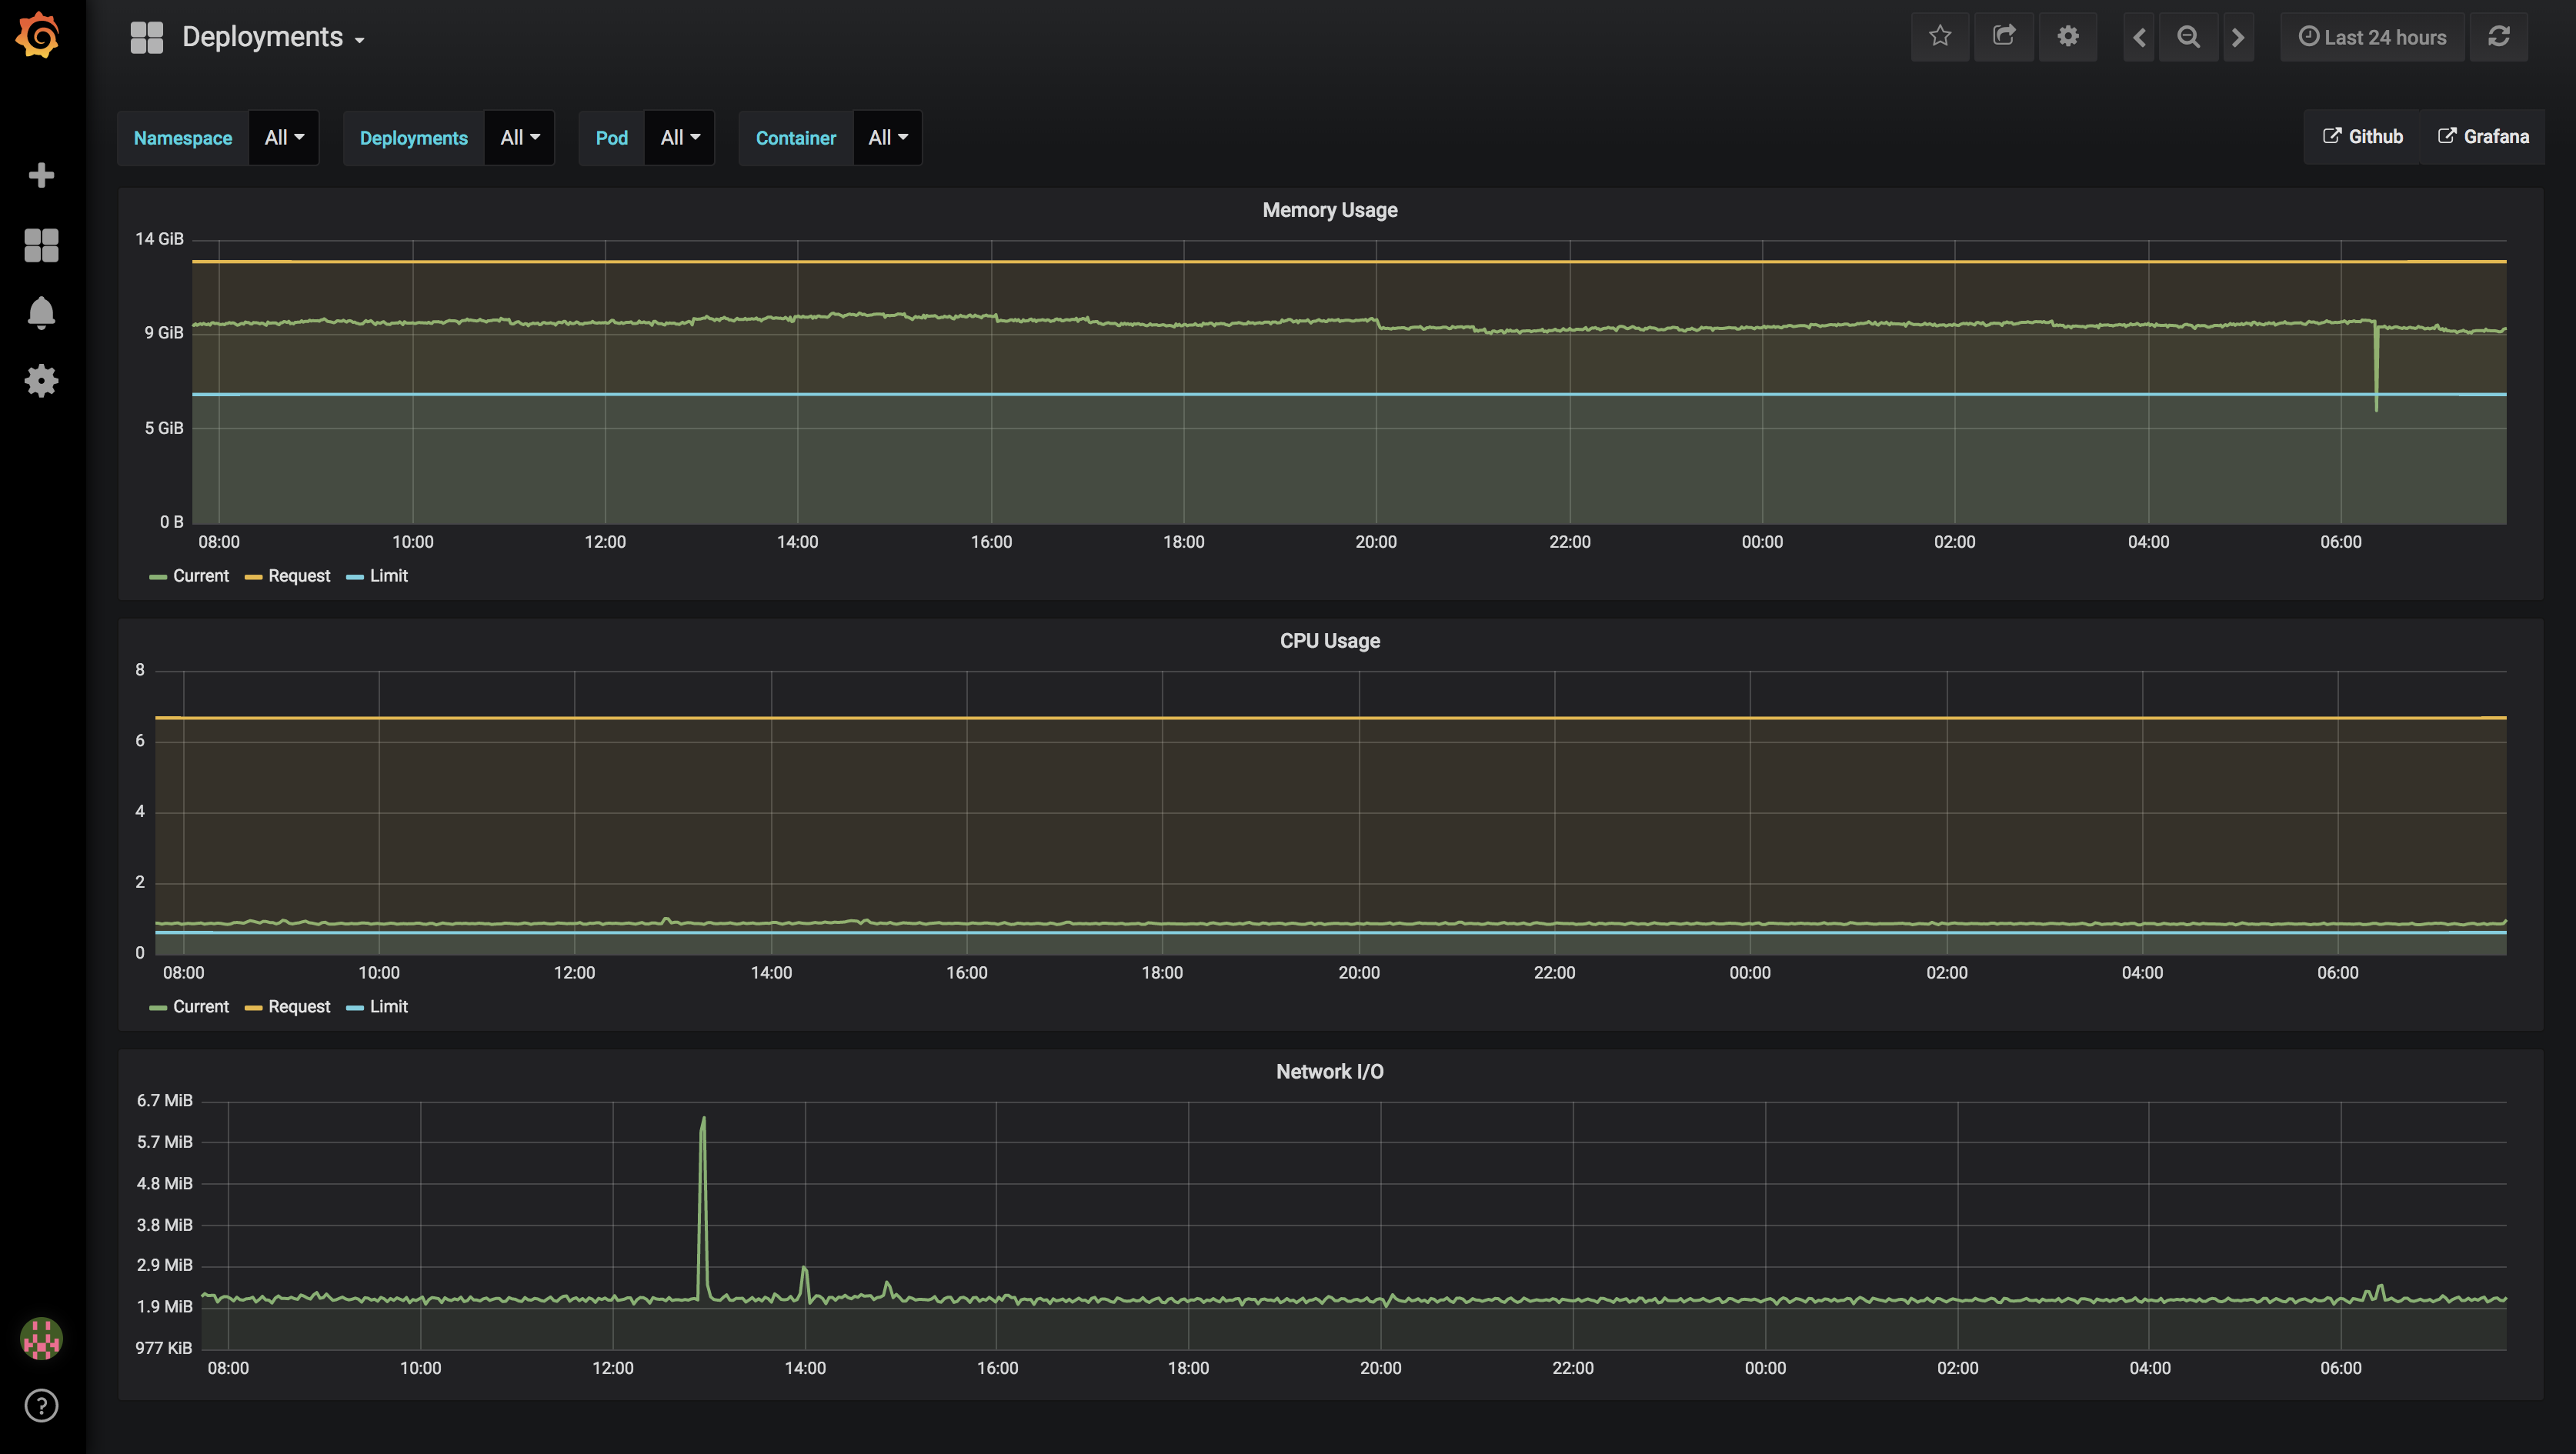
Displays cpu/memory/network for Deployments. This dashboard allows for drilling down from namespace->deployment->pod->container in such a way that you don't have to care about the specific pod if you only care about the average of the current deployments.
The configuration is compatible with this instillation of Prometheus - https://github.com/kubernetes/charts/tree/master/stable/prometheus A default node exporter will also likely function.
Dashboard sources - https://github.com/sstarcher/grafana-dashboards
Data source config
Collector config:
Upload an updated version of an exported dashboard.json file from Grafana
| Revision | Description | Created | |
|---|---|---|---|
| Download |
Kubernetes
Monitor your Kubernetes deployment with prebuilt visualizations that allow you to drill down from a high-level cluster overview to pod-specific details in minutes.
Learn more