OpenNMS Basic SNMP data
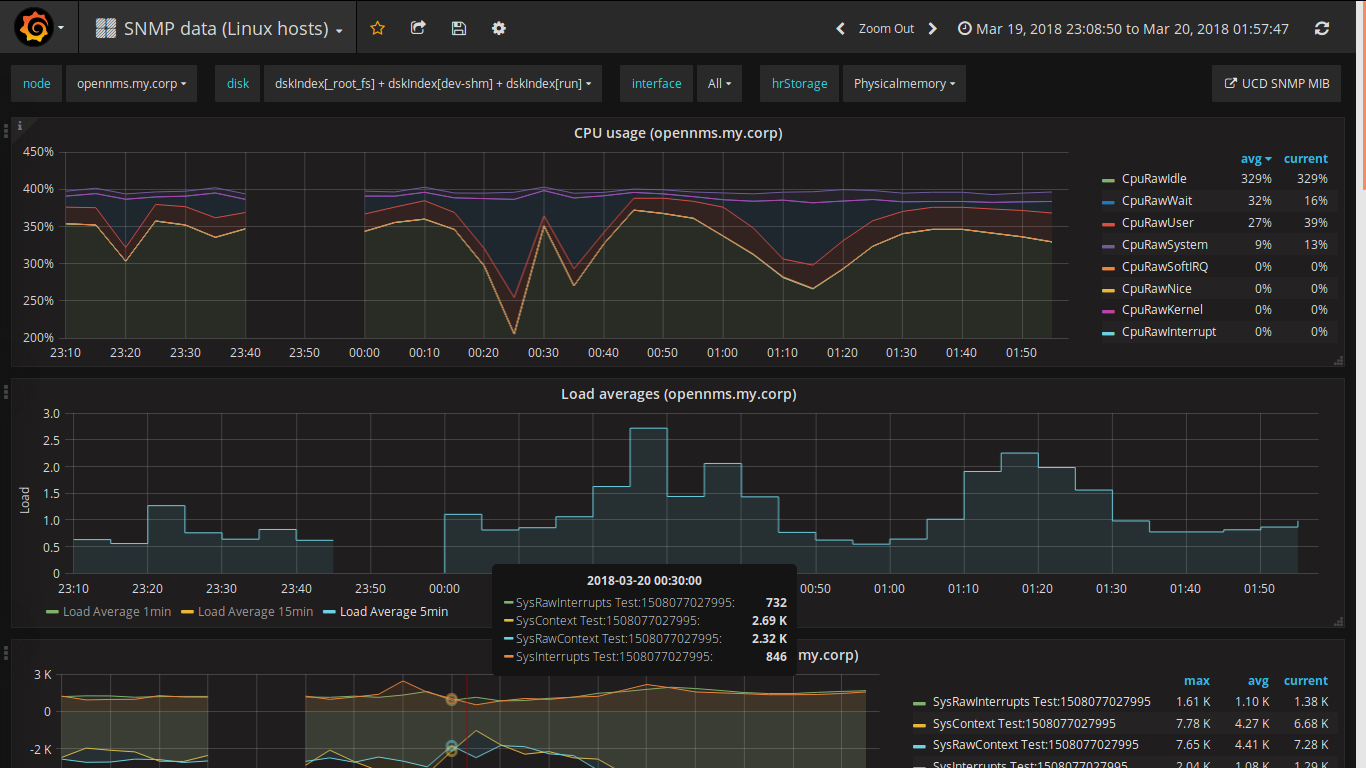
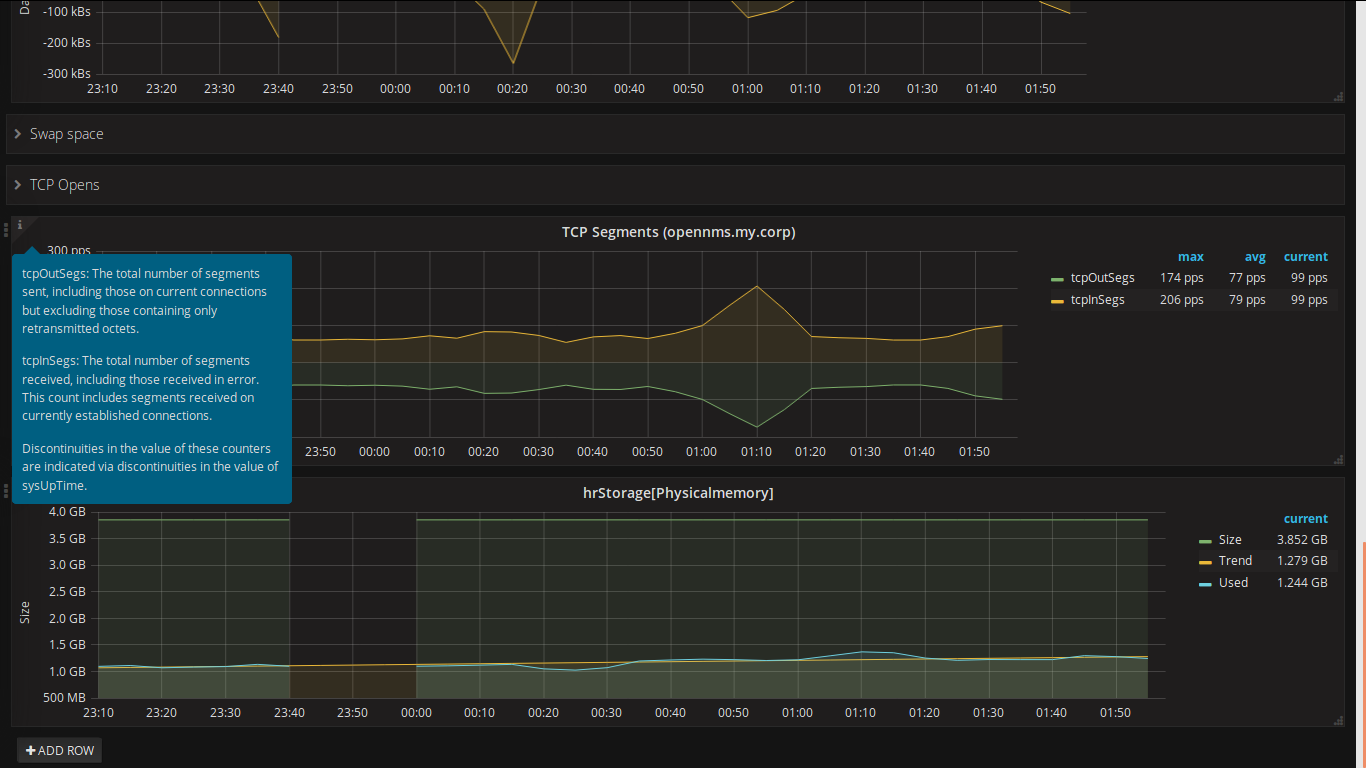
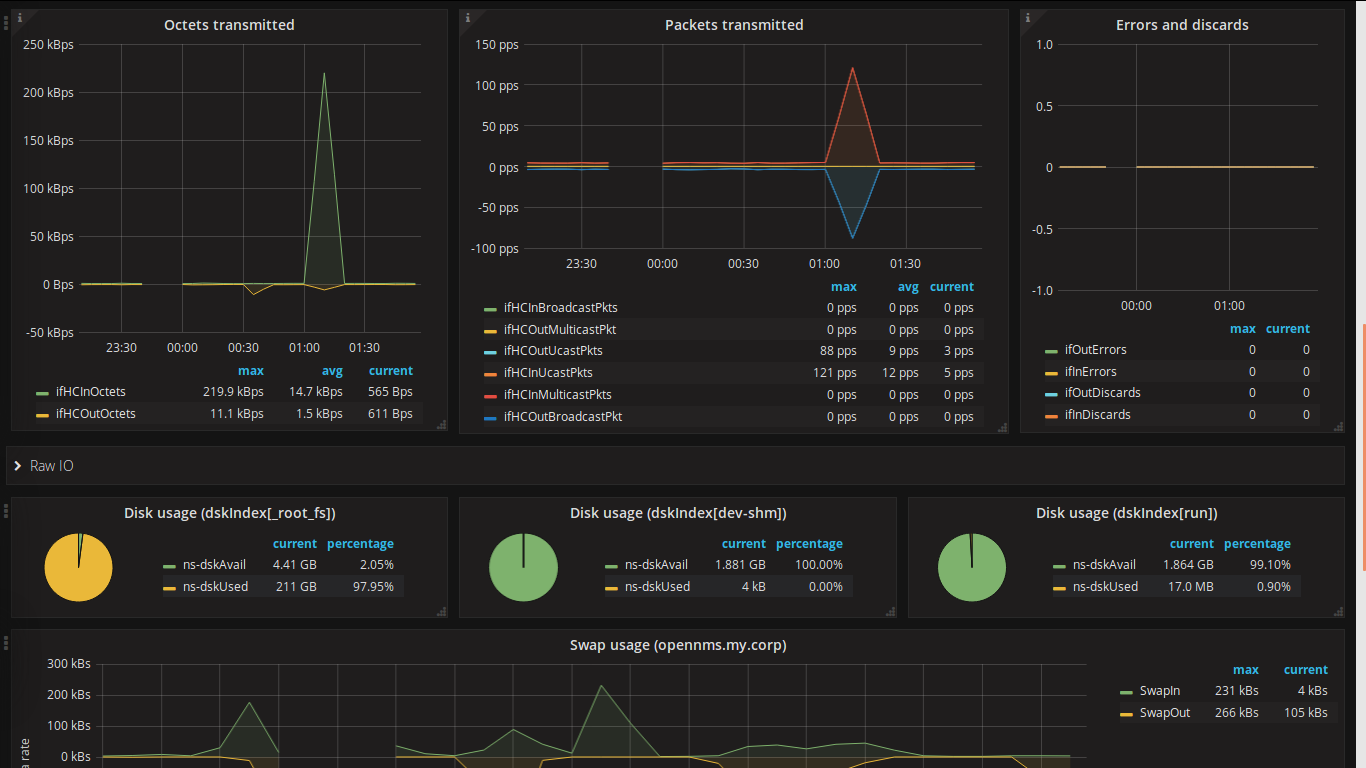
Display basic SNMP data collected on Linux hosts with OpenNMS >= 25.2.x for use with OpenNMS Helm 5.0.0 in Grafana 6.6 (optionally with R for trendlines).
This dashboard shows performance metrics collected via SNMP. It is inteded for OpenNMS 25.x with OpenNMS Helm 5.x and Grafana 6.6. For older versions of OpenNMS / Grafana please dowload revision 9 resp. 5.
Installation
The forecasts require R to be installed on the grafana/opennms-helm server. This can be done on Ubuntu with the following command:
$ sudo apt-get install r-recommended
Alternatively you can use the following command on CentOS/Red Hat:
$ sudo dnf install R
Reviews
If you have any suggestions or feature requests, please post me a review!
Changelog
Revision 10
- Update to OpenNMS 25.2.1 and Grafana 6.6
- Fixed top row single stats
Revision 9
- Update to OpenNMS 25 and Helm 4
- Added UDP statistics
- Added Linux Sensor names
Revision 8
- Added disk trends
- Automatically display trends
Revision 7
- Updated Memory Panel
- Cosmetic changes for playlist usage (CPU, Load, Memory, and Disk on one screen)
Revision 6
- Added Memory Panel
- Added ssCpuRawGuest, ssCpuRawGuestNice, and ssCpuRawSteal metrics (might require datacollection changes)
Revision 5 (Last version with OpenNMS 21.x and Grafana 4.6 support)
- Added DiskIOIndex (Disk Load)
- Added Number of users panel
- Added Number of processes panel
- Added System uptime panel
- Added Top row with Load, #Users, #Process, Uptime
- Merged Swap statistics and TCP statistics
Revision 4
- Added LM Sensor data
- Beautified interface and hrStorage names
Data source config
Collector config:
Upload an updated version of an exported dashboard.json file from Grafana
| Revision | Description | Created | |
|---|---|---|---|
| Download |
SNMP
Easily monitor any generic SNMP (Simple Network Management Protocol) device with Grafana Cloud's out-of-the-box monitoring solution.
Learn more


