kubernetes pod metrics in elasticsearch
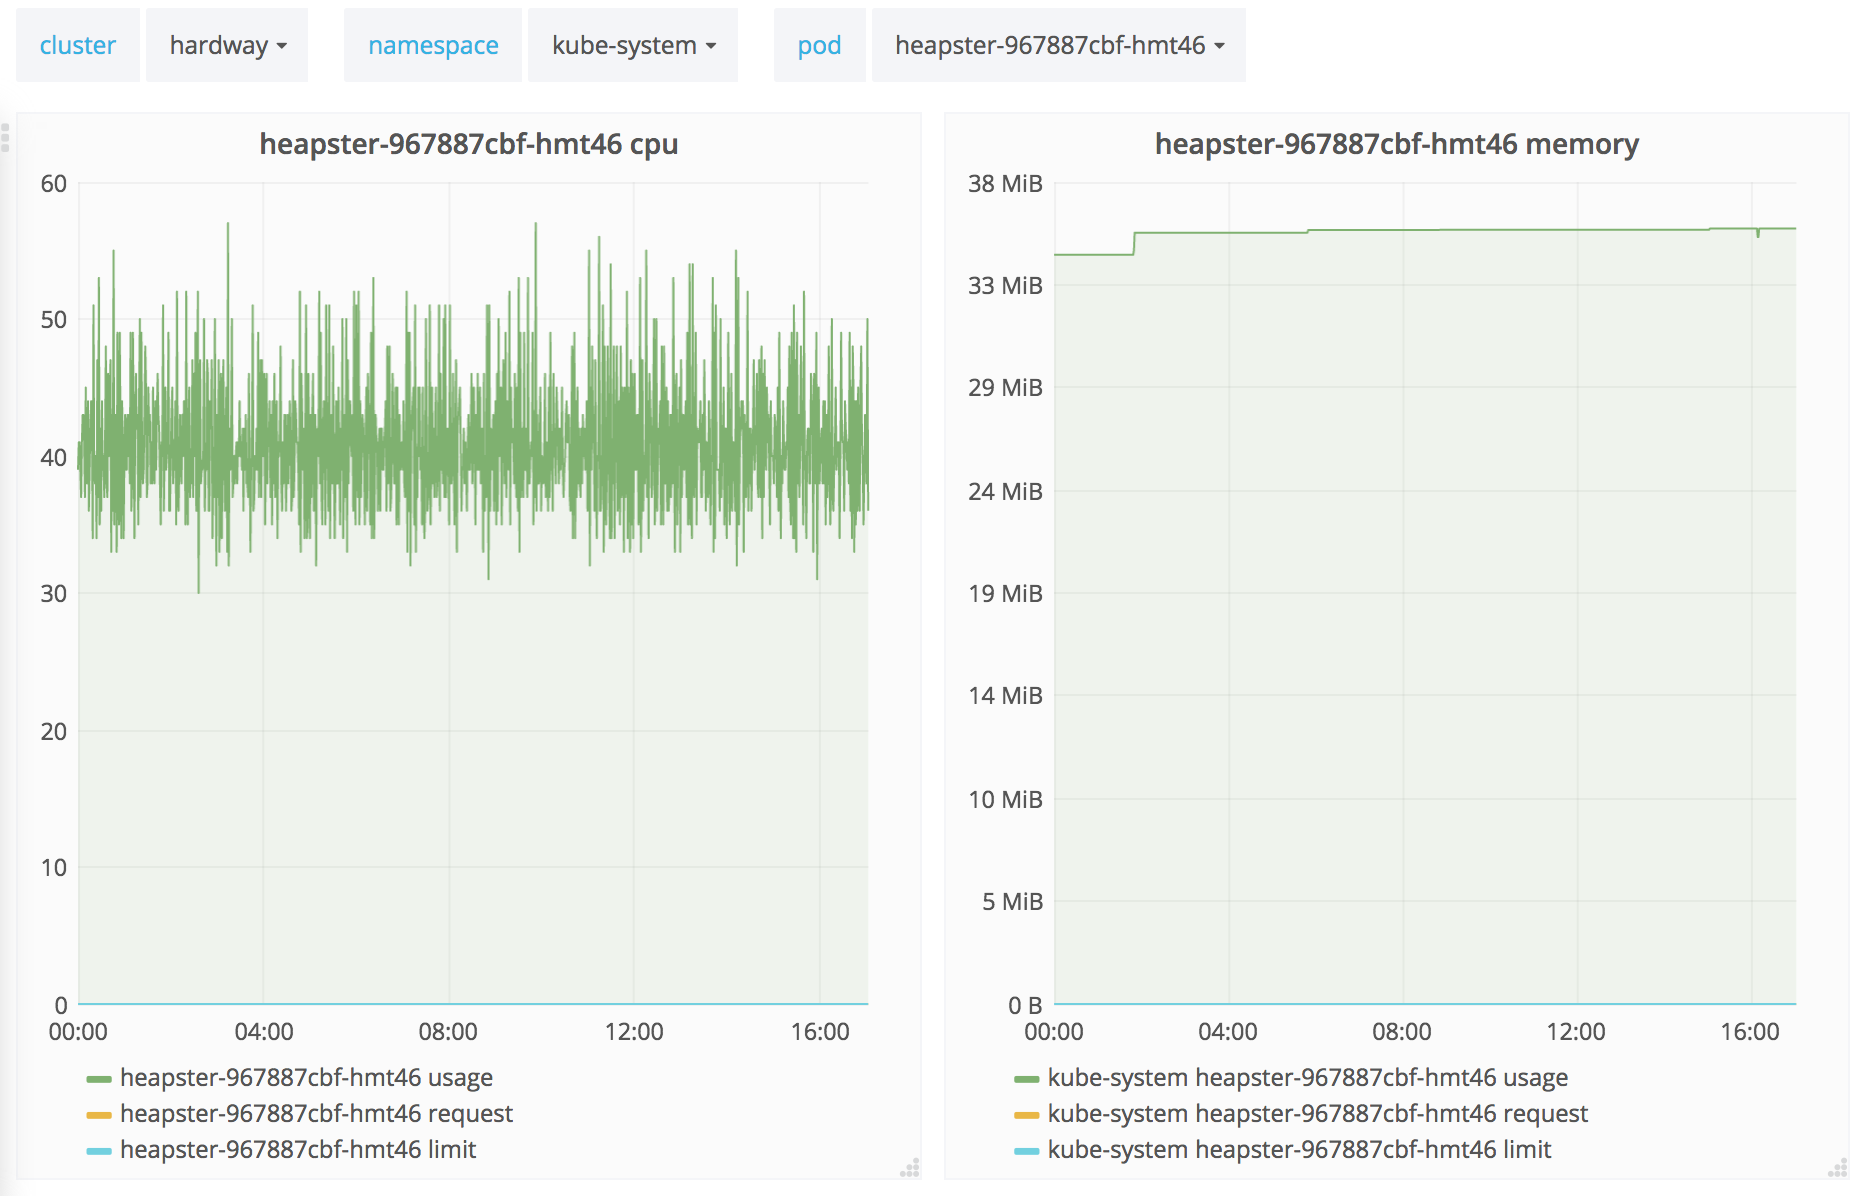
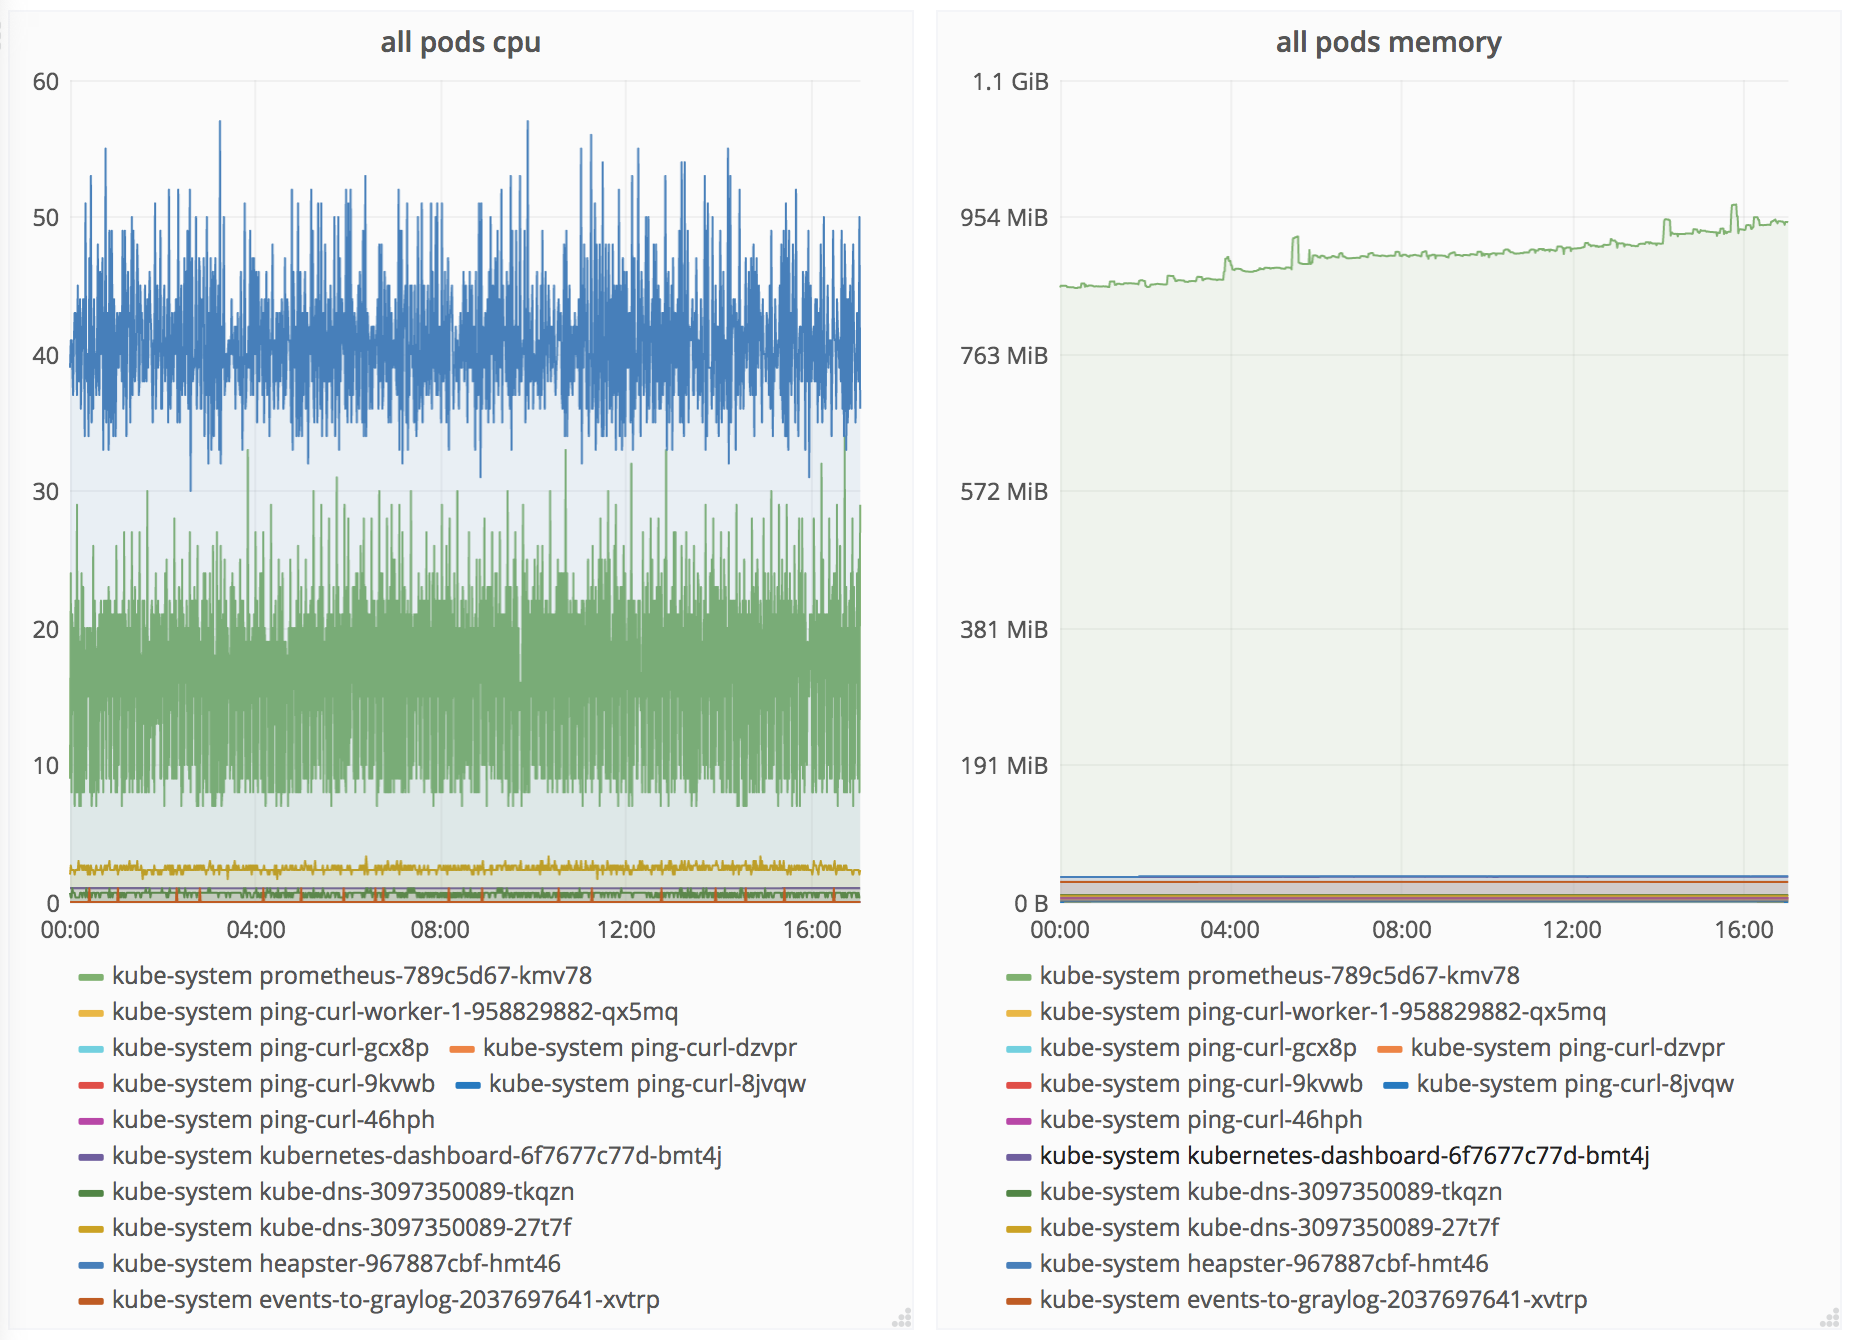
cpu and memory of kubernetes pods collected by heapster using elasticsearch as a sink
This shows cpu and memory metrics from kubernetes pods collected by heapster using elasticsearch as a sink. Cluster, namespace and pod are provided as template variables. Configure heapster to start with
/heapster
      --source=kubernetes:https://kubernetes.default
      --sink=elasticsearch:http://elasticsearch-host:9200?cluster_name=your_cluster_name
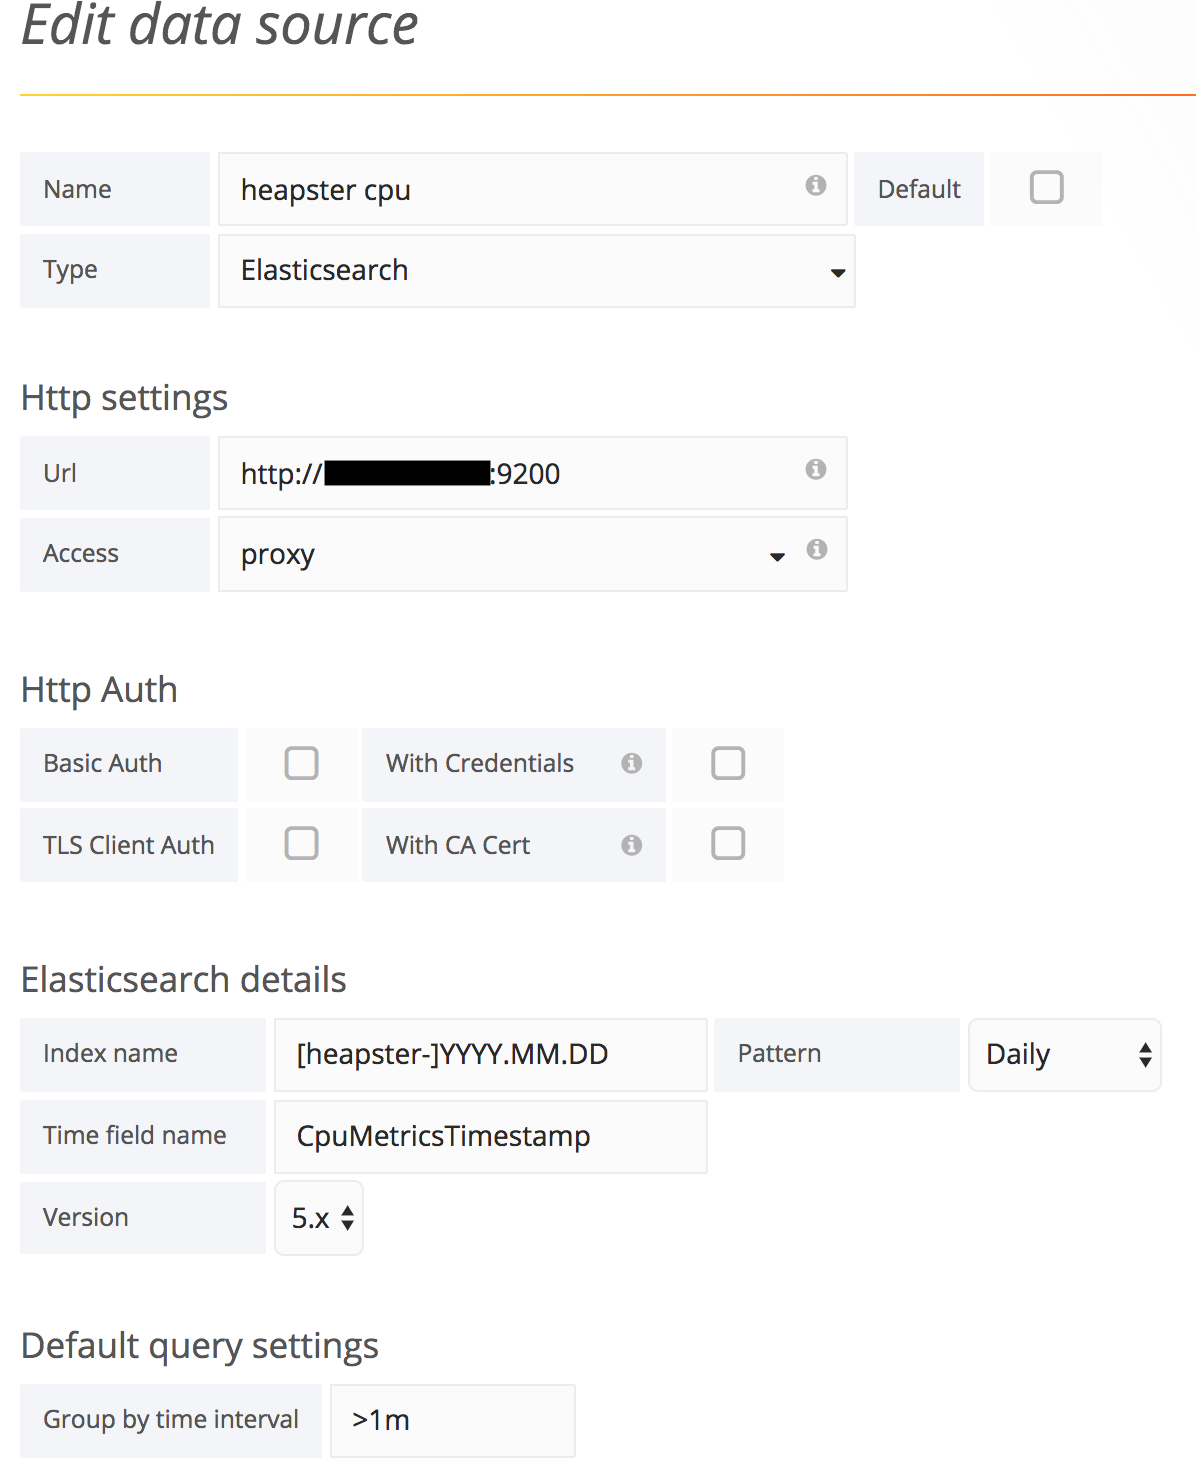
Configure two grafana data sources (for the same elasticsearch url), one using CpuMetricsTimestamp as a time field, another using MemoryMetricsTimestamp as a time field. Seems weird to have the same url in two data sources, but I couldn't get around it. See screenshot for index template. Set group by time interval in both data sources to your heapster --metric-resolution argument. Heapster default is 1m, so set group by time interval to >1m, see screenshot.
Software versions used:
- Heapster version: v1.4.2
- Elasticsearch version: 5.5.1
- Grafana version: 4.4.3
Data source config
Collector config:
Upload an updated version of an exported dashboard.json file from Grafana
| Revision | Description | Created | |
|---|---|---|---|
| Download |
Kubernetes
Monitor your Kubernetes deployment with prebuilt visualizations that allow you to drill down from a high-level cluster overview to pod-specific details in minutes.
Learn more


