
k6 Load Testing Results
A dashboard for visualizing results from the k6.io load testing tool, using the InfluxDB exporter. Based on https://grafana.com/dashboards/2587
This is based on https://grafana.com/dashboards/2587
Pro-tip: Change grafana configuration min_refresh_interval which is default 5s to 1s to be able to get near real-time dashboard updates when doing load tests.
Update 2022-04-26:
- Add panel for failed http requests.
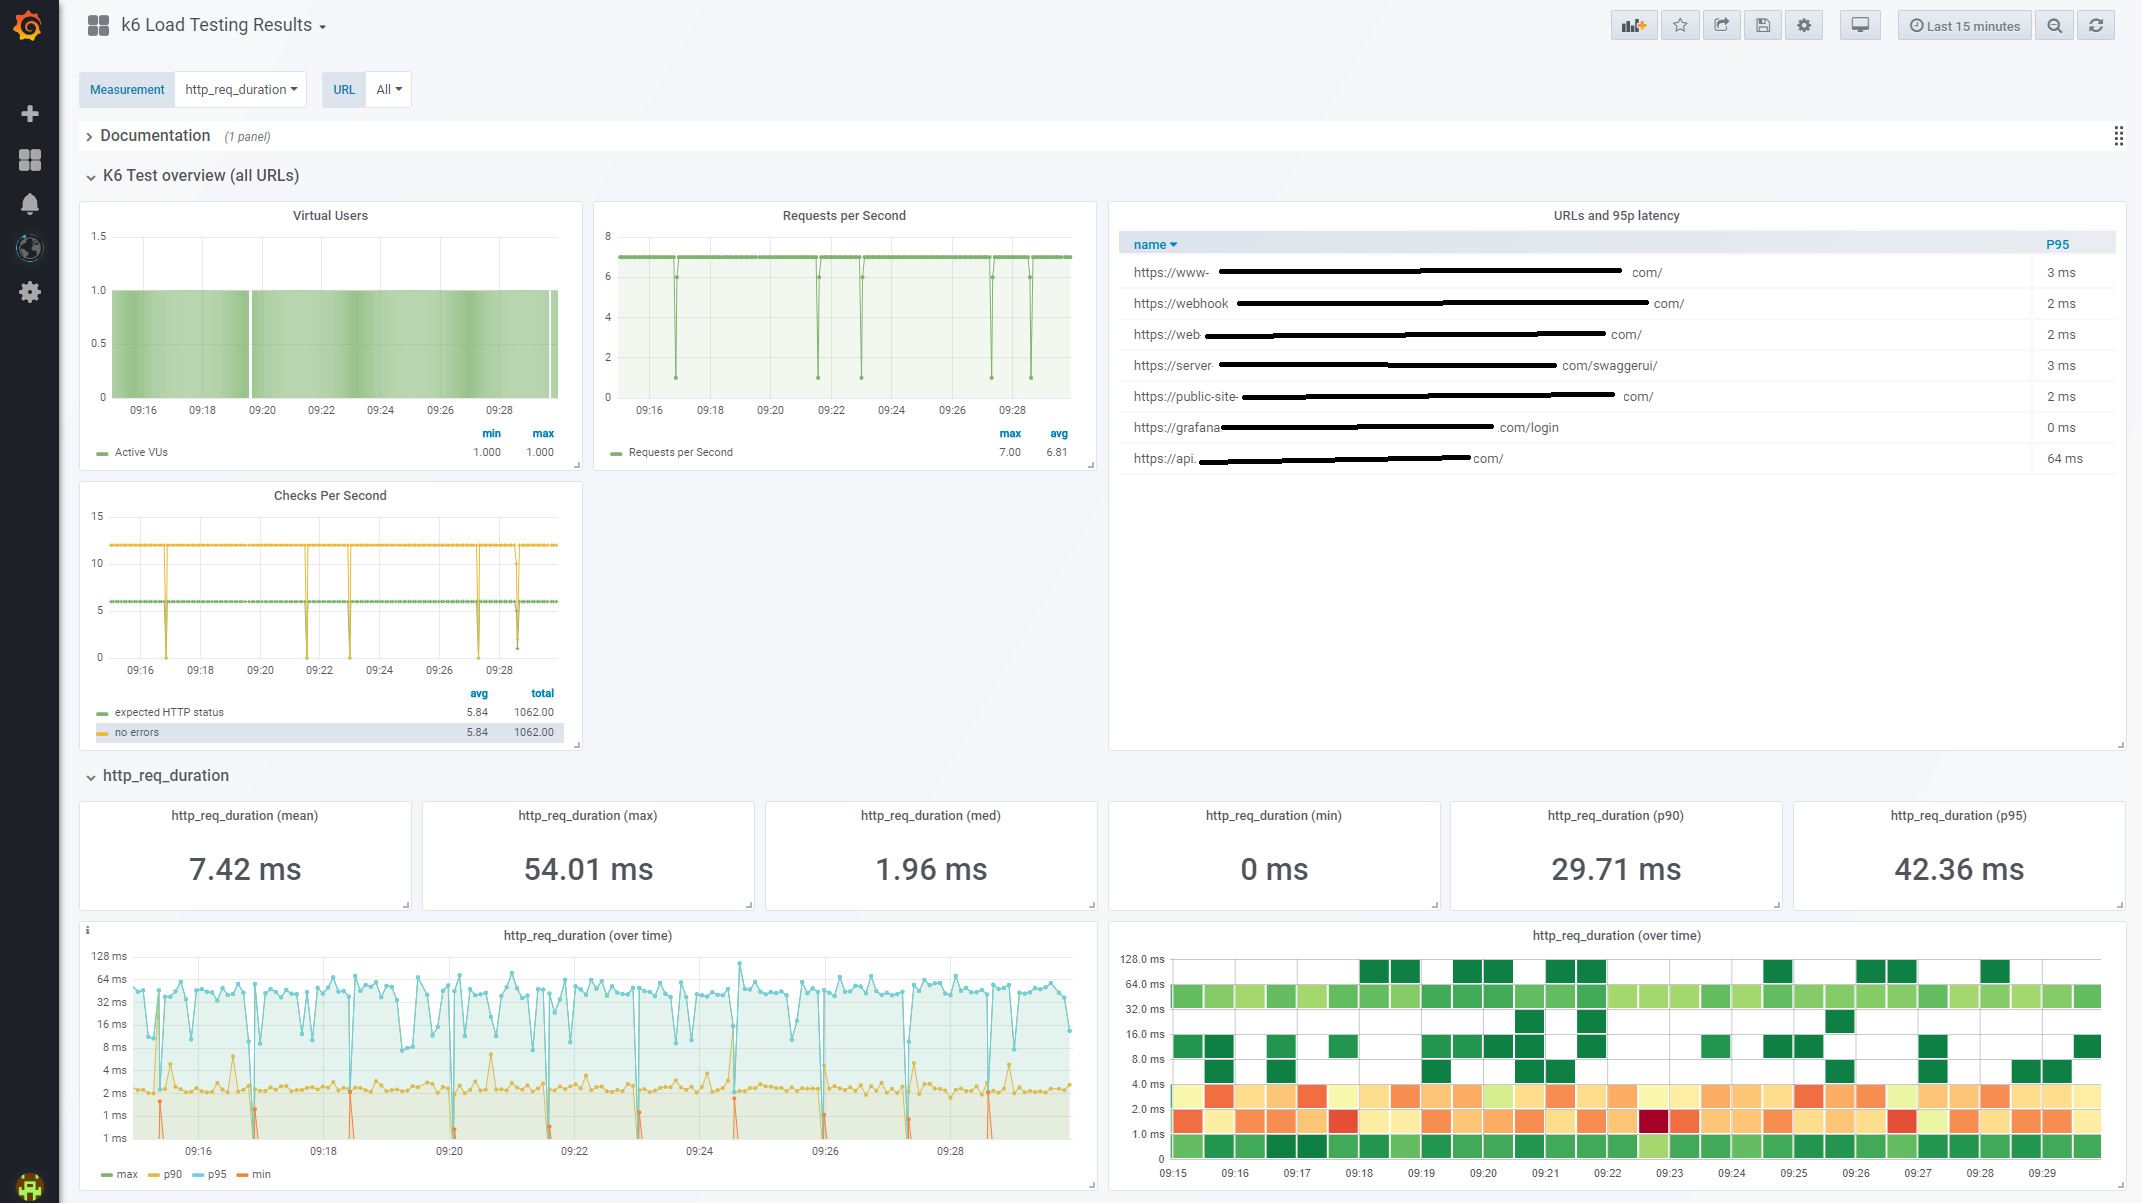
- Add panel for aggregate latency
- Rearrange panels a bit
- Convert panels to new Grafana 8 (?) panel types (time series and tables).
Update 2018-11-07 - Sharpen name dashboard variable to only apply to InfluxDB metrics so other measurements with a name tag will not fill the variable list. Remove the errors graph since it does not seem to be a part of K6 metrics. Change the styles of some of the graphs.
Update 2018-09-25 - Update dashboard variable URL to reflect InfluxDB label change from url to name.
Changes:
- Adds templated URLs for easier drill down to specific URLs in a test.
- Uses InfluxDB query editor for all panels instead of raw InfluxDB queries.
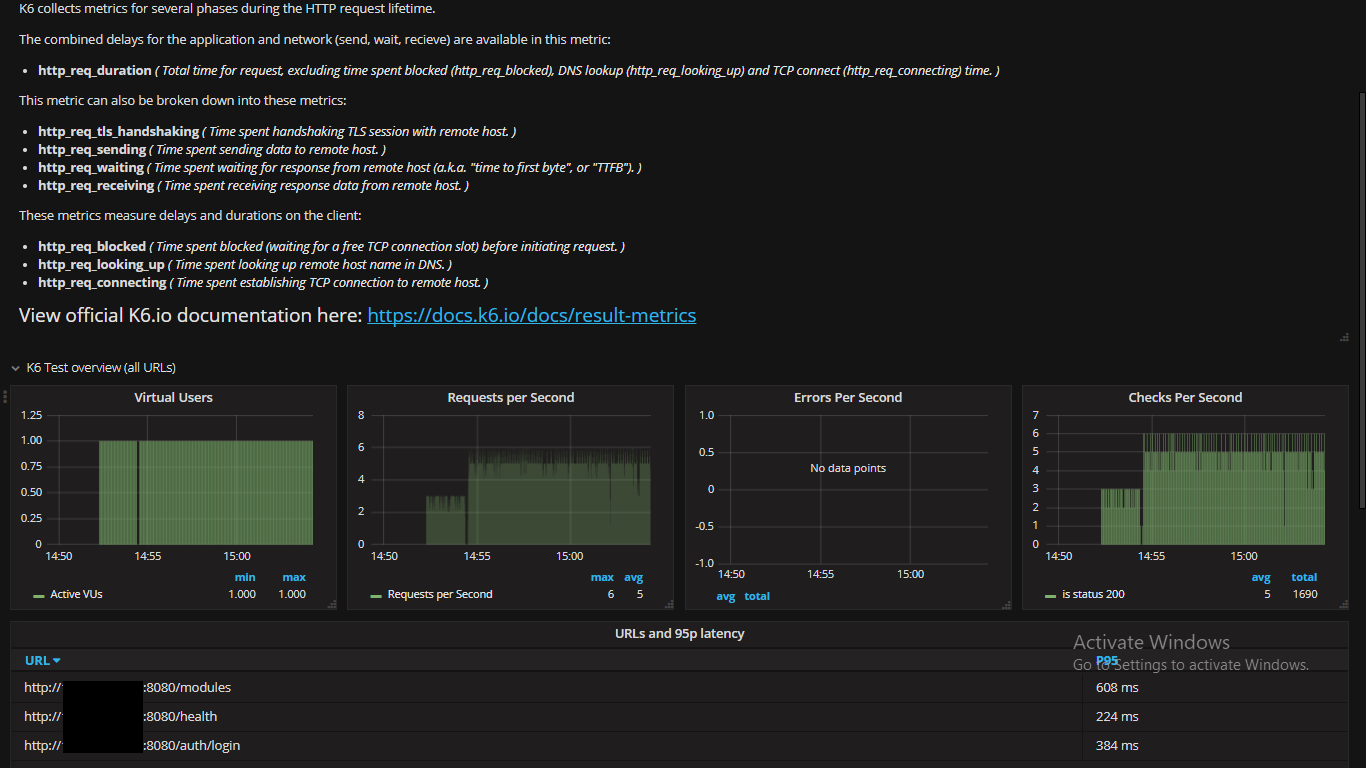
- Adds a table with all URLs that have been tested in the time-period and their p95 latency.
- Adds some explanation of the different metrics on top.
Data source config
Collector config:
Dashboard revisions
Upload an updated version of an exported dashboard.json file from Grafana
| Revision | Decscription | Created | |
|---|---|---|---|
| Download |
Get this dashboard
Data source:
Dependencies: