InfluxDB Internals
InfluxDB internal metrics display
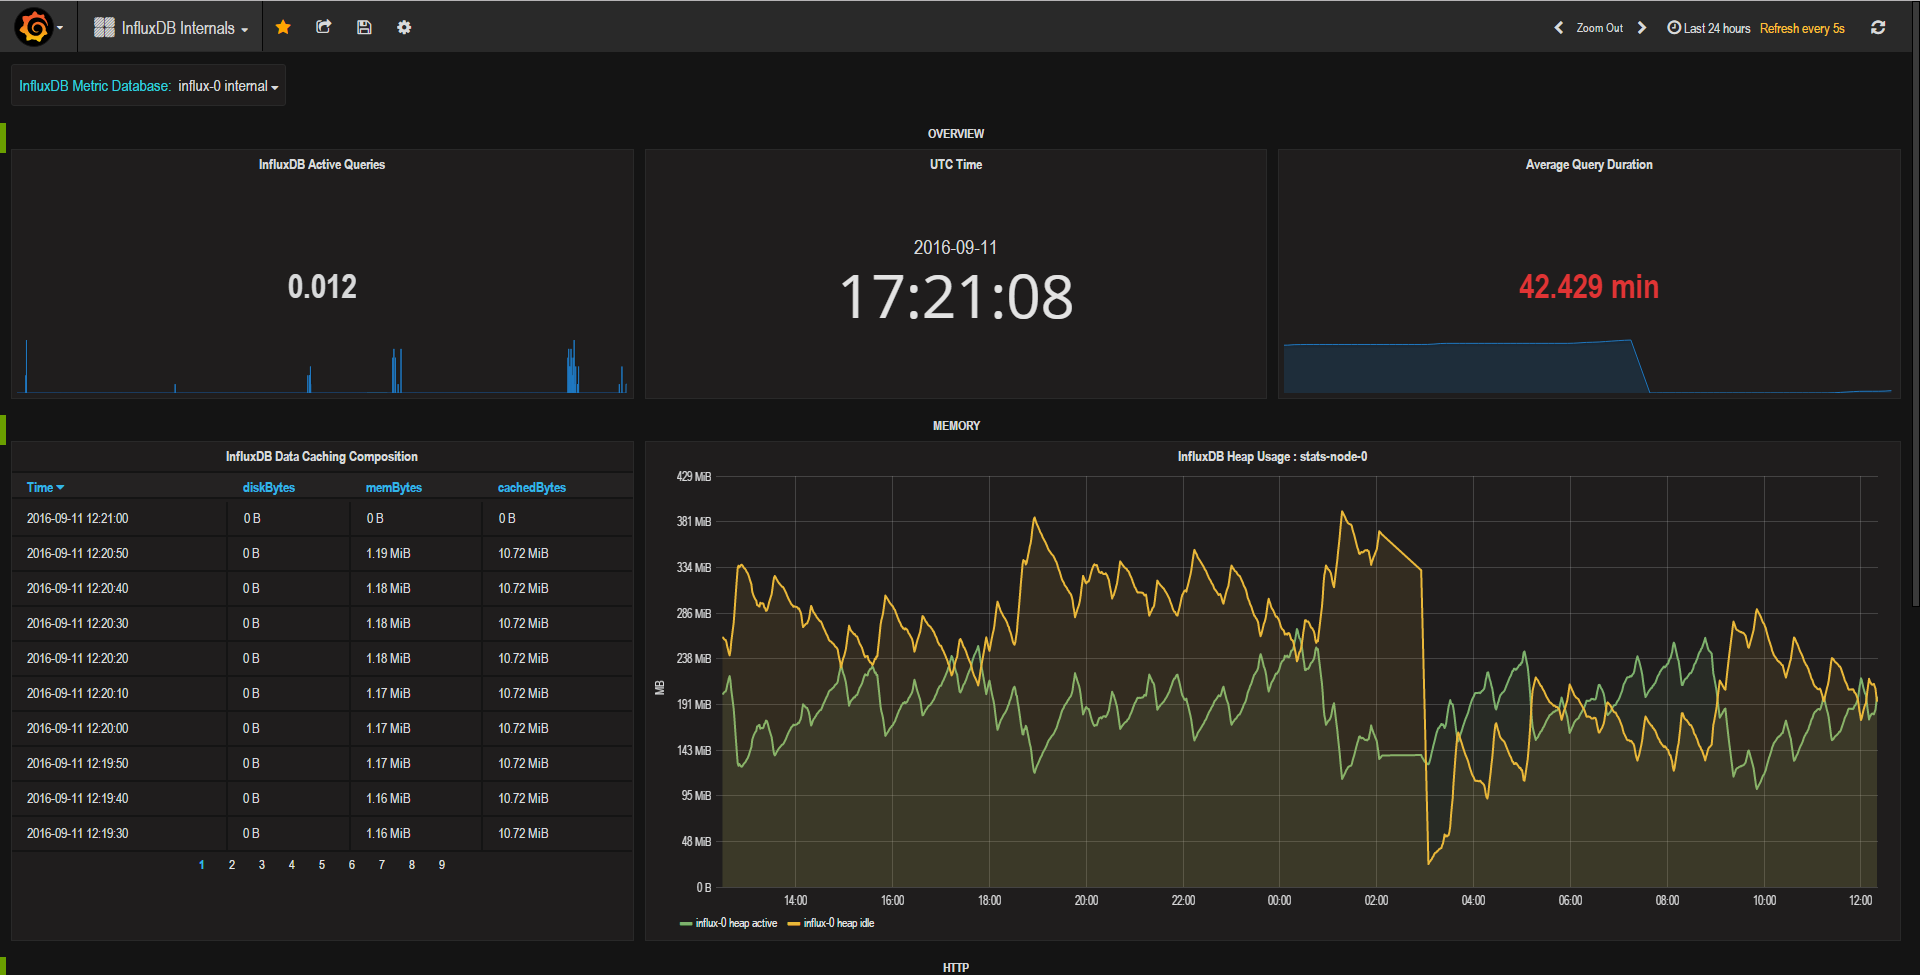
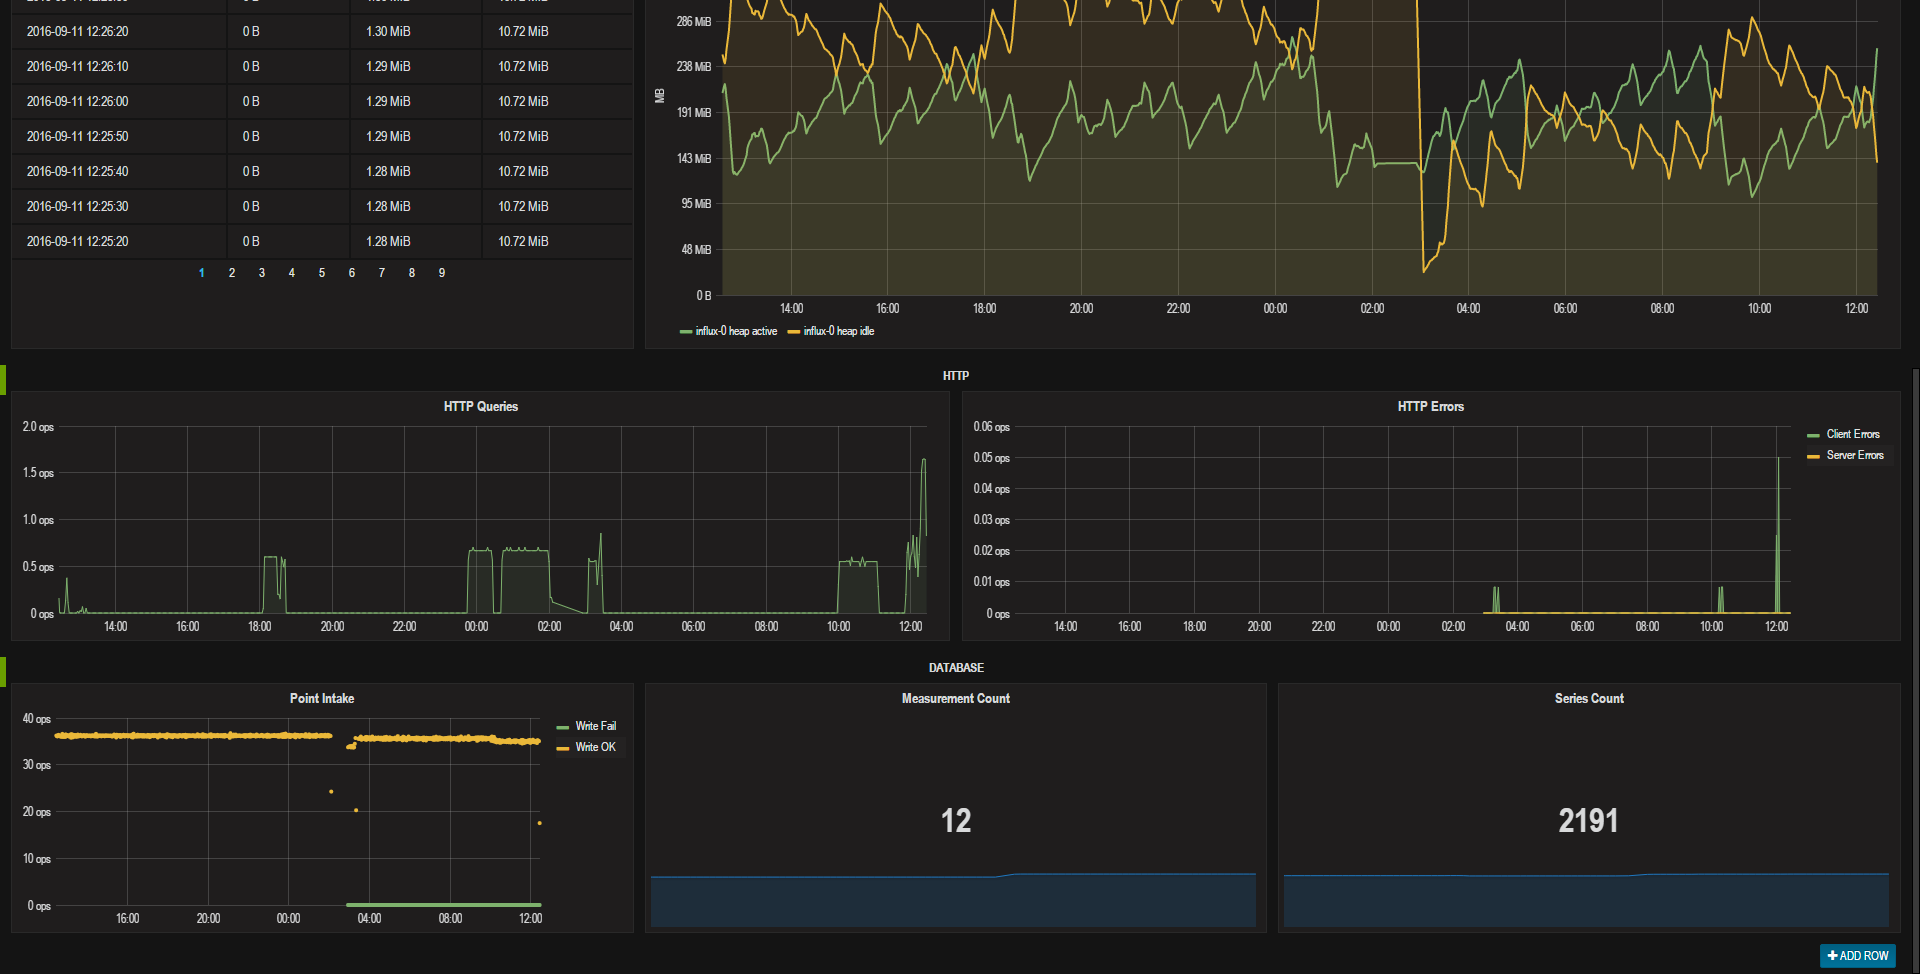
All data displayed comes directly from the InfluxDB internal stats database -- just change the data source to that database and you're good to go.
Data source config
Collector type:
Collector plugins:
Collector config:
Revisions
Upload an updated version of an exported dashboard.json file from Grafana
| Revision | Description | Created | |
|---|---|---|---|
| Download |
InfluxDB
Easily monitor InfluxDB, an open source time series database, with Grafana Cloud's out-of-the-box monitoring solution.
Learn more