CPU Utilization Details (Cores)
This is experimental dashboard for Percona Monitoring and Management (PMM) which provides CPU utilization details for multi-core systems. It allows to easily see if overall CPU usage is high or if there are overloaded cores.
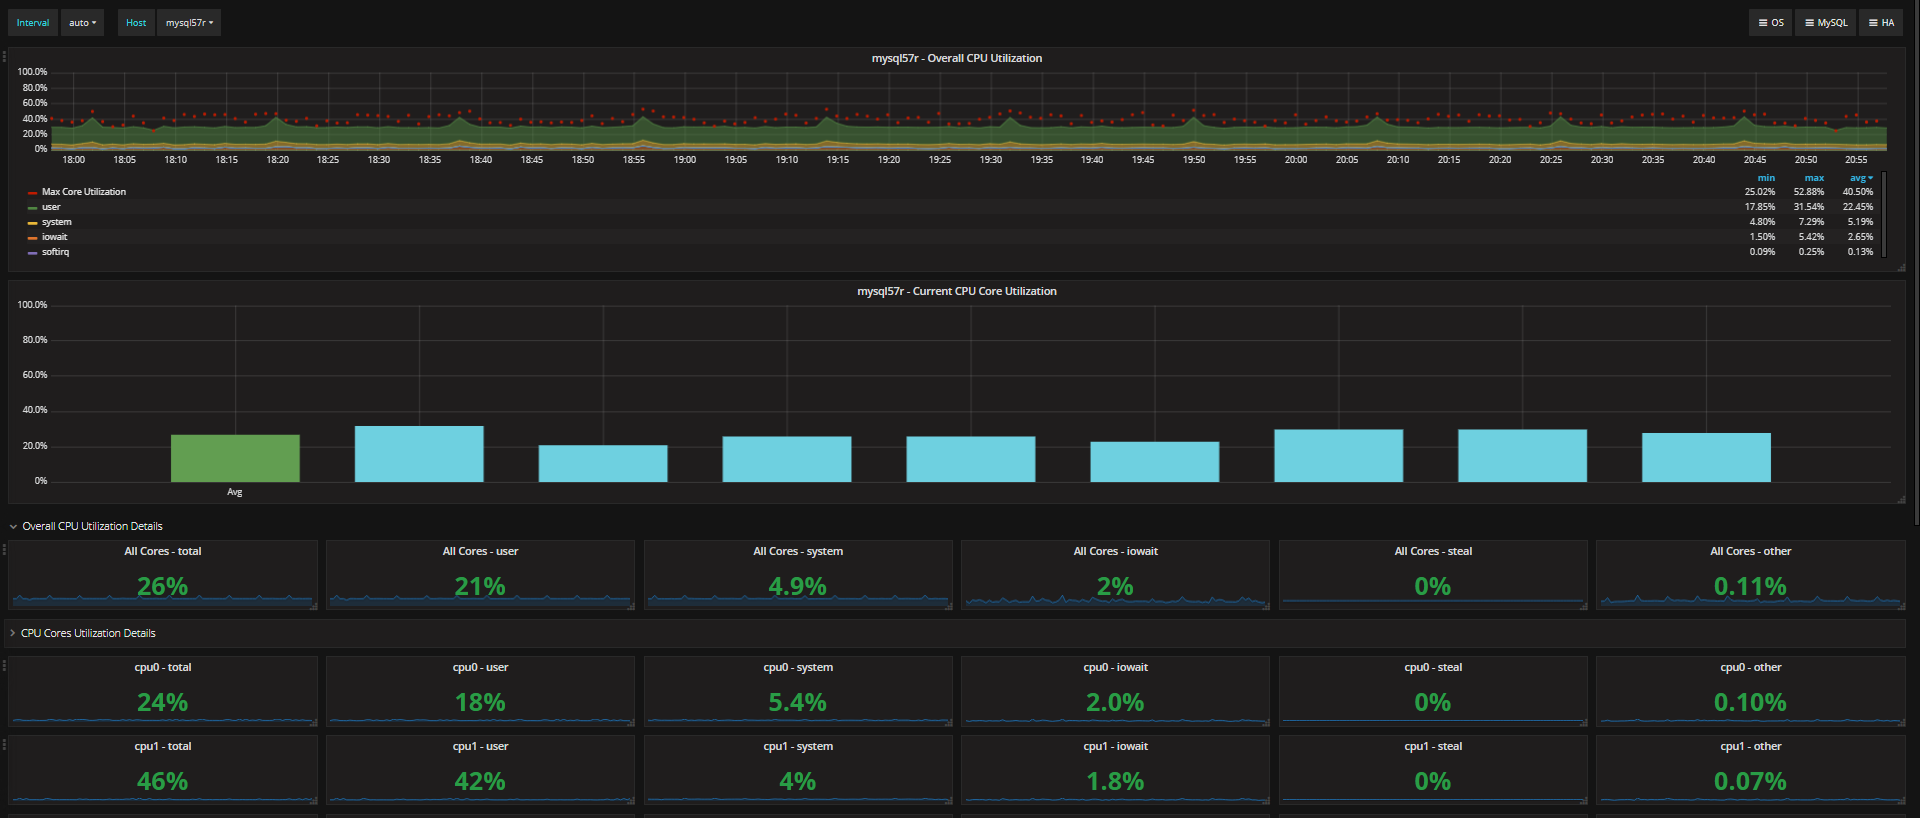
The CPU Utilization Details (Cores) dashboard uses the prometheus data source to create a Grafana dashboard with the graph, singlestat and text panels.
Data source config
Collector type:
Collector plugins:
Collector config:
Revisions
Upload an updated version of an exported dashboard.json file from Grafana
| Revision | Description | Created | |
|---|---|---|---|
| Download |