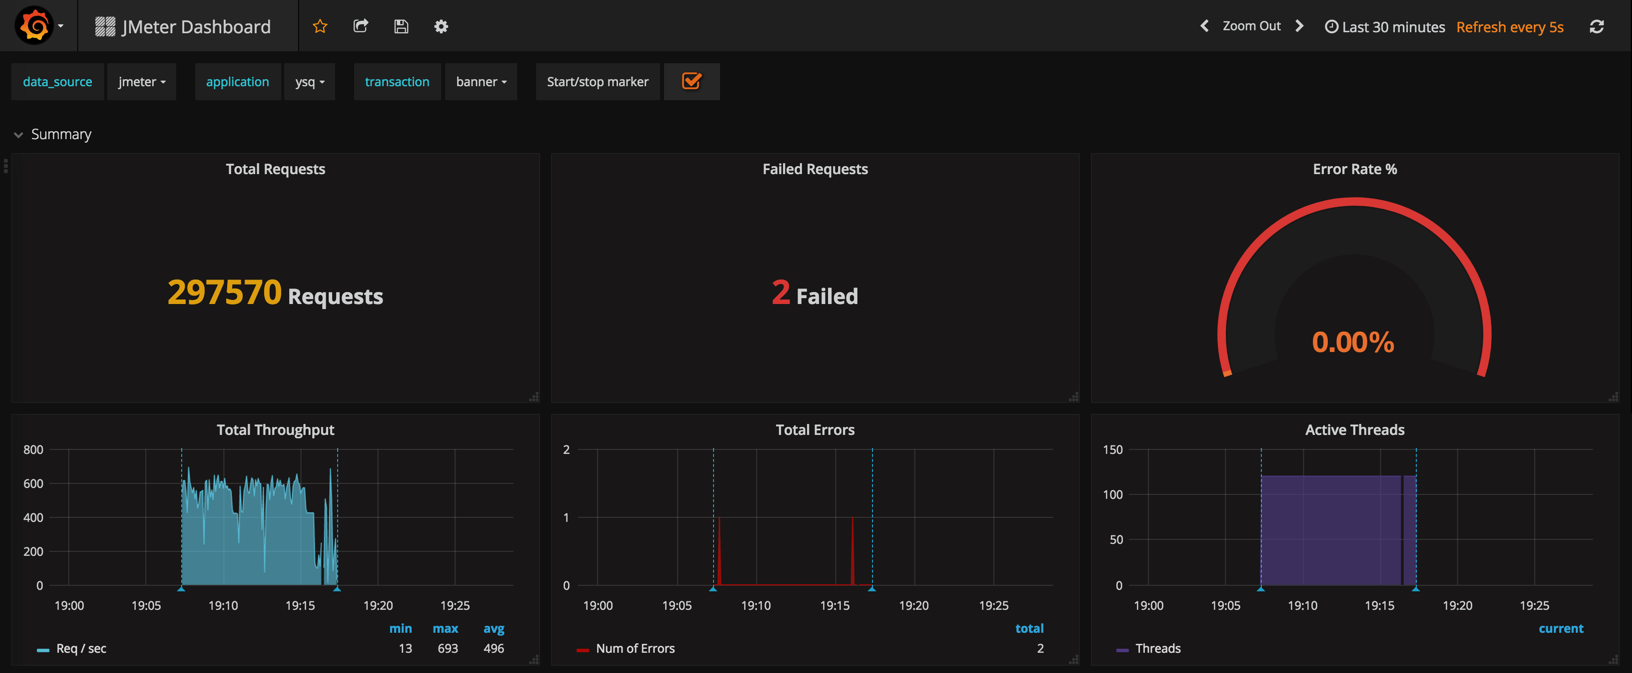
JMeter Dashboard
Monitor your JMeter load test in real time with InfluxDB and Grafana.
Based on the great work of JMeter Dashboard (3.2 and up) by adrianbanu.
This dashboard was created for the InfluxdbBackendListernerClient, so it will work with JMeter 3.2 and up.
Steps:
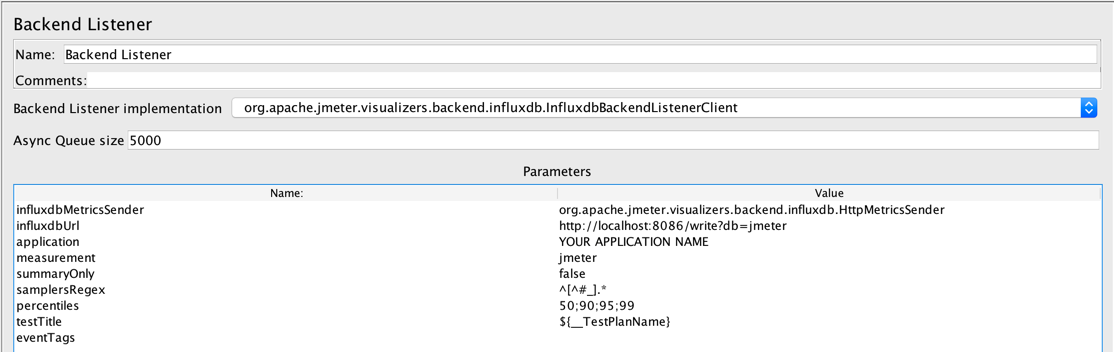
- Create your Test Plan and add the InfluxdbBackendListernerClient to the test plan.
- Configure the backend listener to write to your database
- Create your database in InfluxDB
- Import this dashboard into Grafana
- Run the test.
Data source config
Collector type:
Collector plugins:
Collector config:
Revisions
Upload an updated version of an exported dashboard.json file from Grafana
| Revision | Description | Created | |
|---|---|---|---|
| Download |