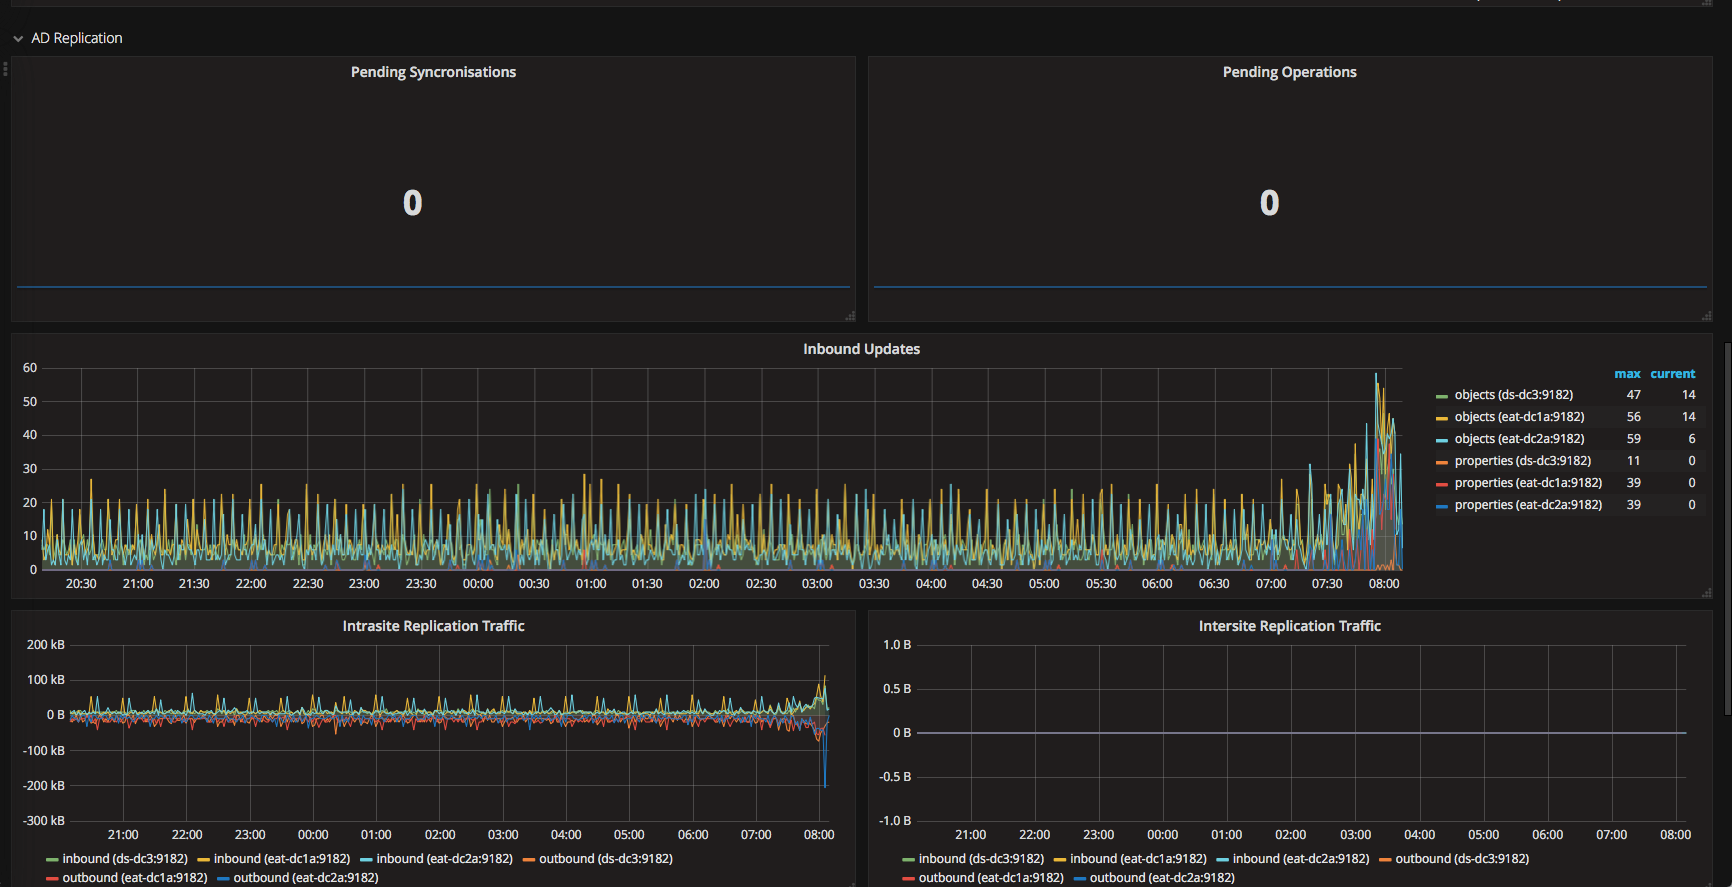
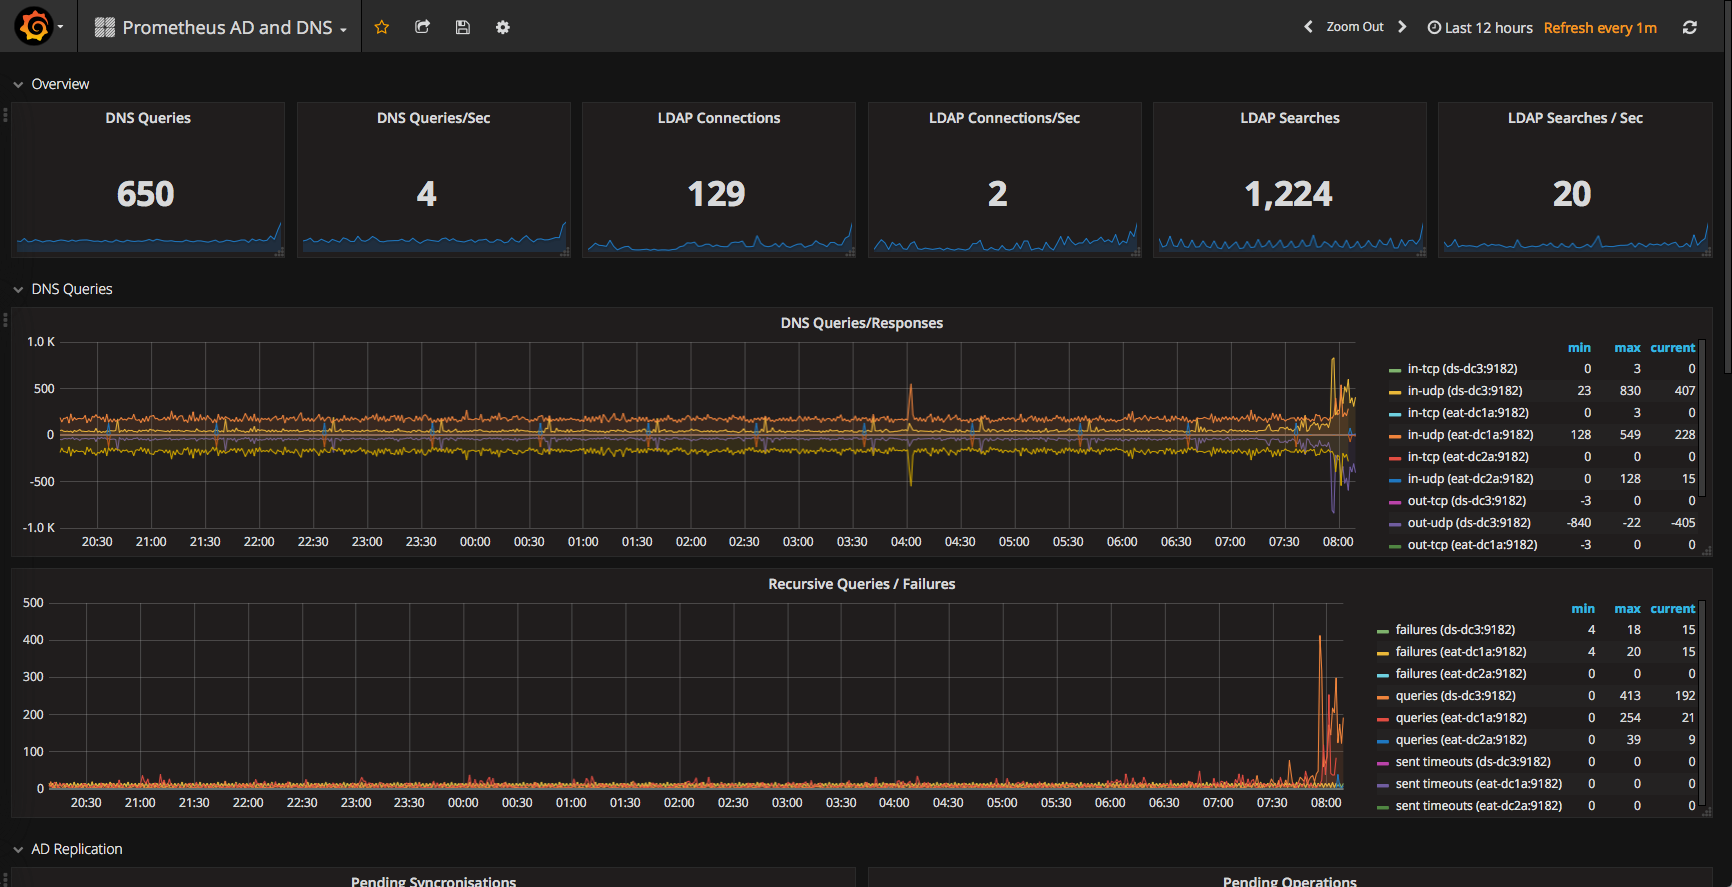
Prometheus - AD and DNS
Active Directory and DNS Dashboard using Prometheus WMI_Exporter
This is a prometheus WMI_Exporter dashboard to monitor Microsoft Windows domain Active Directory and DNS metrics.
AD and DNS metric collection are NOT installed by default when installing the wmi_exporter. make sure you use --params "EnabledCollector ad,dns" at a minimum when installing the collector. I use the chocolatey package prometheus-wmi-exporter.install
Data source config
Collector config:
Upload an updated version of an exported dashboard.json file from Grafana
| Revision | Description | Created | |
|---|---|---|---|
| Download |
Metrics Endpoint (Prometheus)
Easily monitor any Prometheus-compatible and publicly accessible metrics URL with Grafana Cloud's out-of-the-box monitoring solution.
Learn more
