Docker Host & Container Overview
A simple overview of the most important Docker host and container metrics. (cAdvisor/Prometheus)
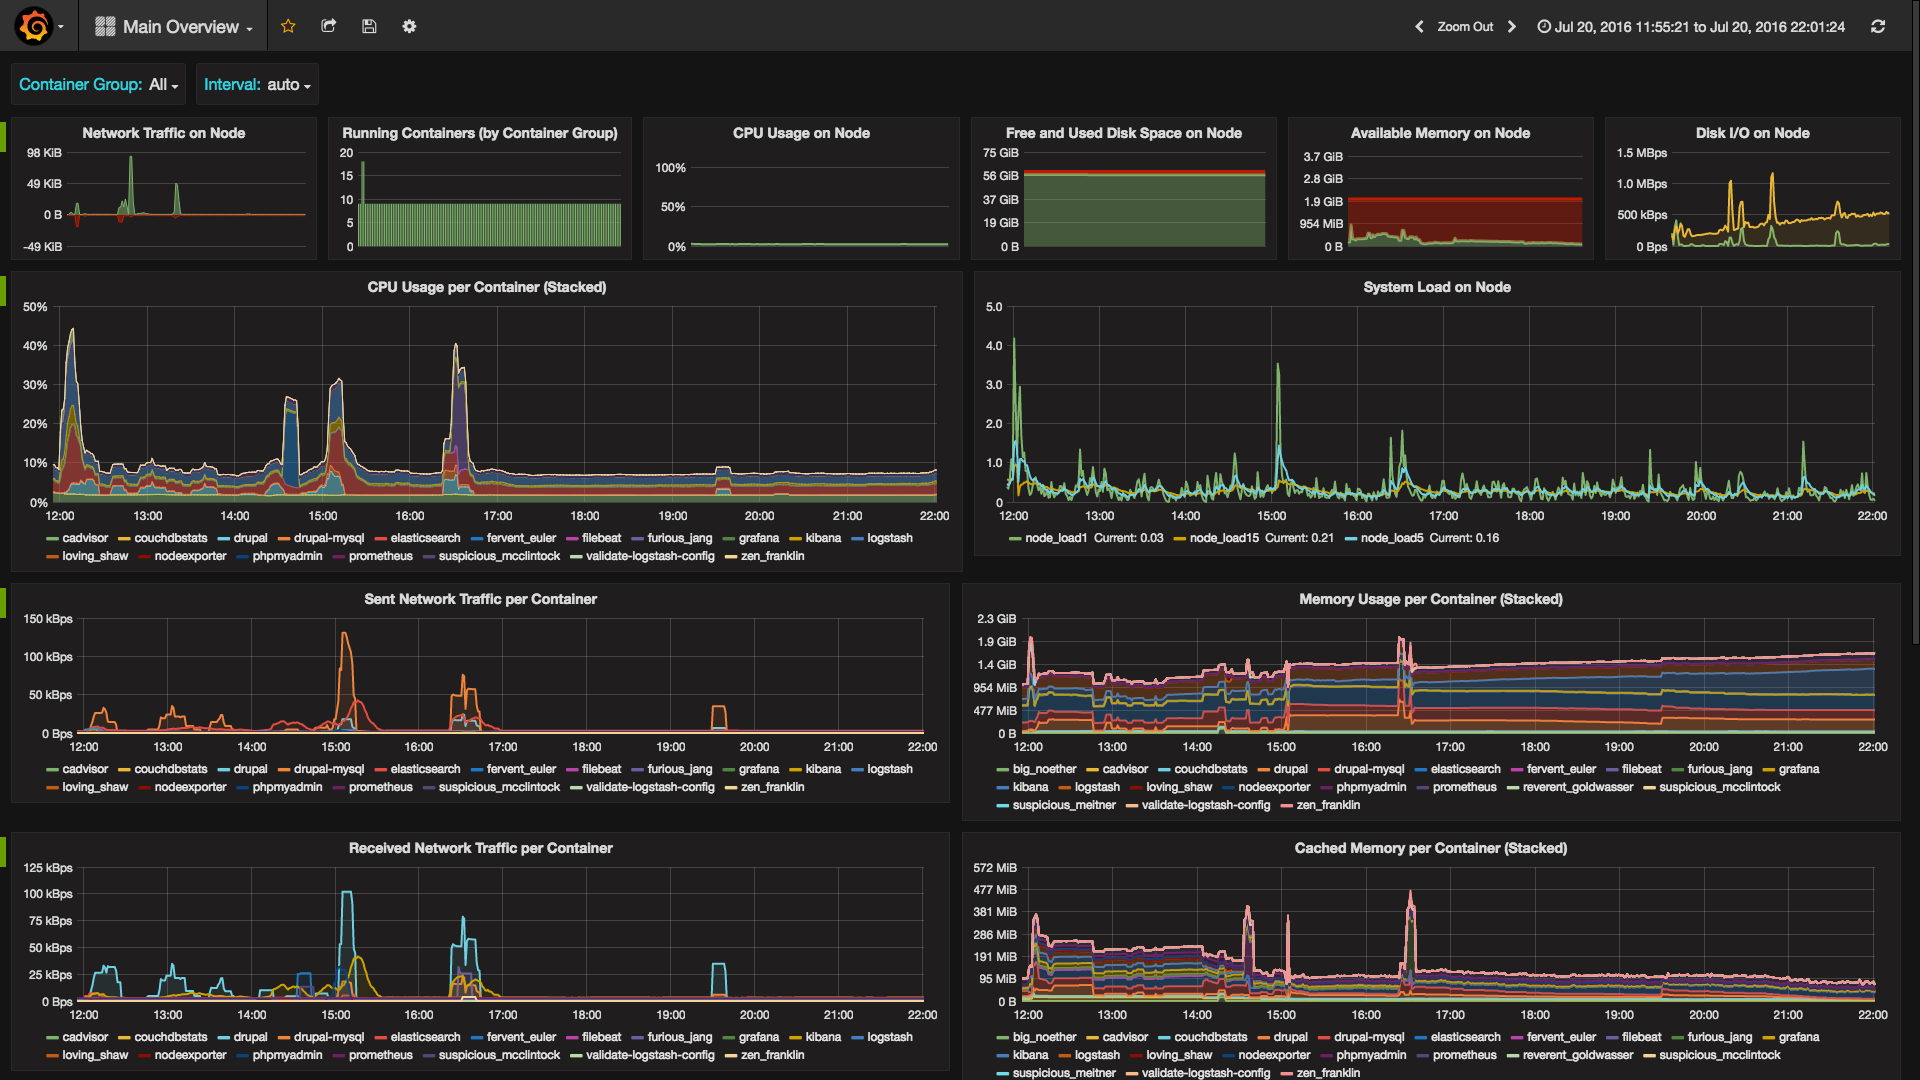
The (simplified) dashboard used in this Monitoring/Logging/Alerting Suite: https://github.com/uschtwill/docker_monitoring_logging
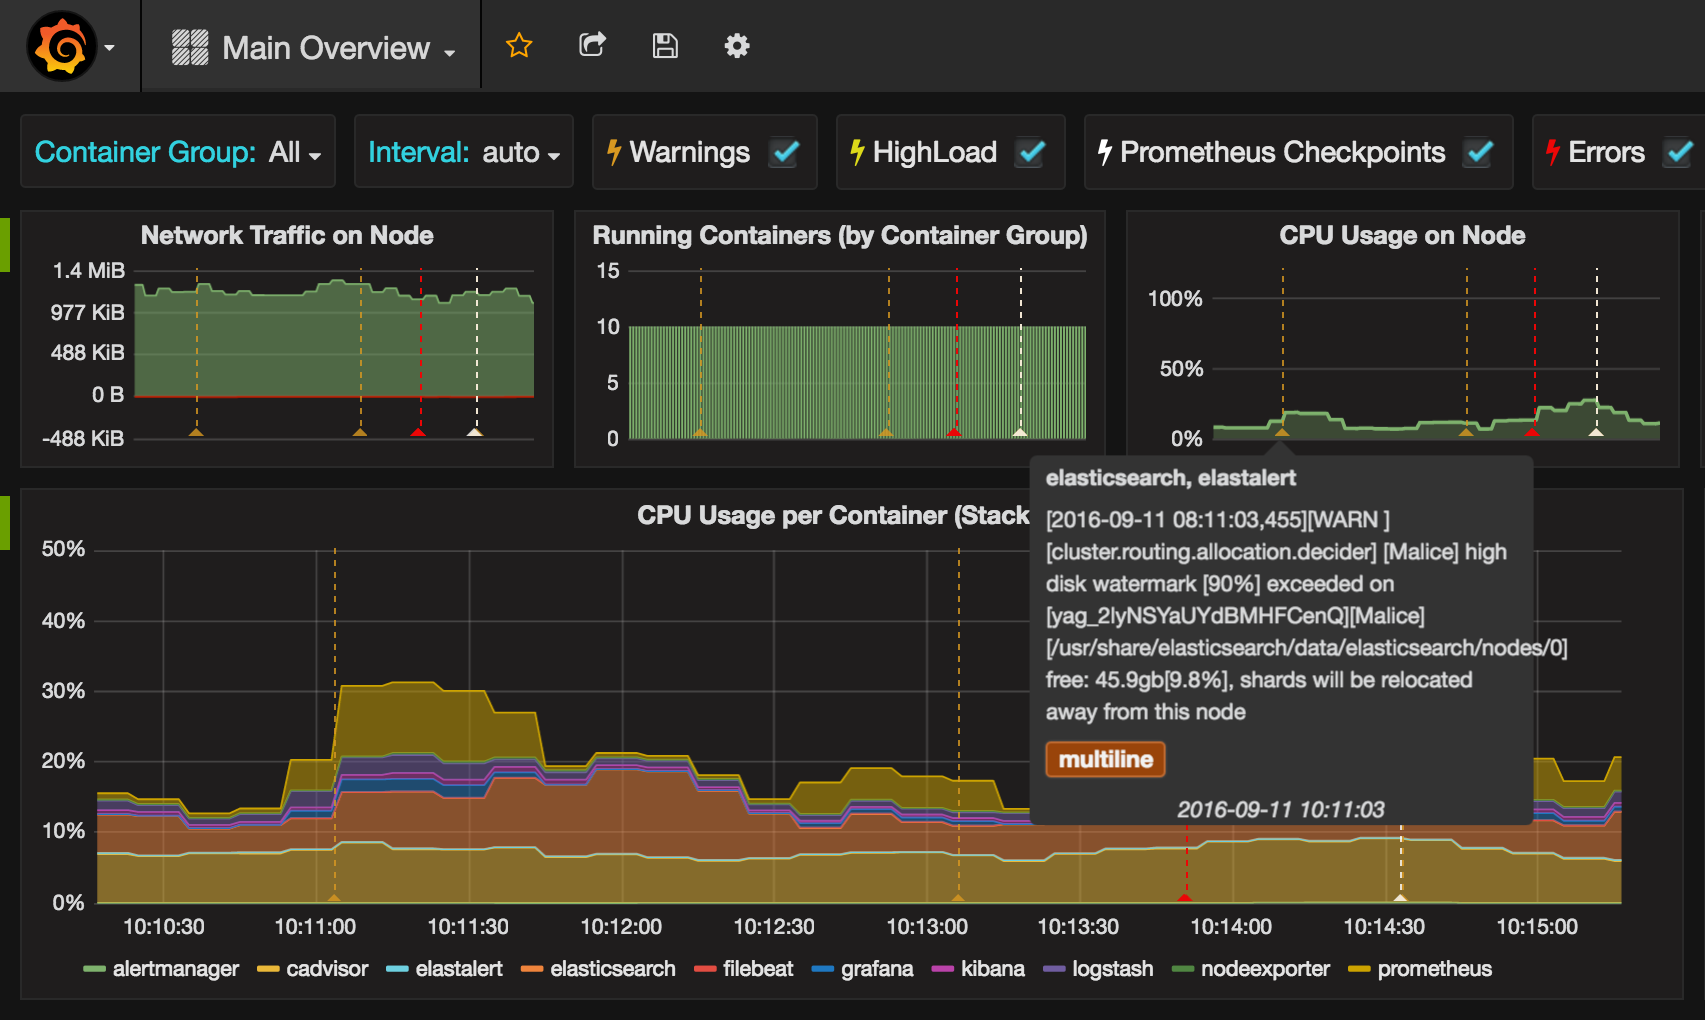
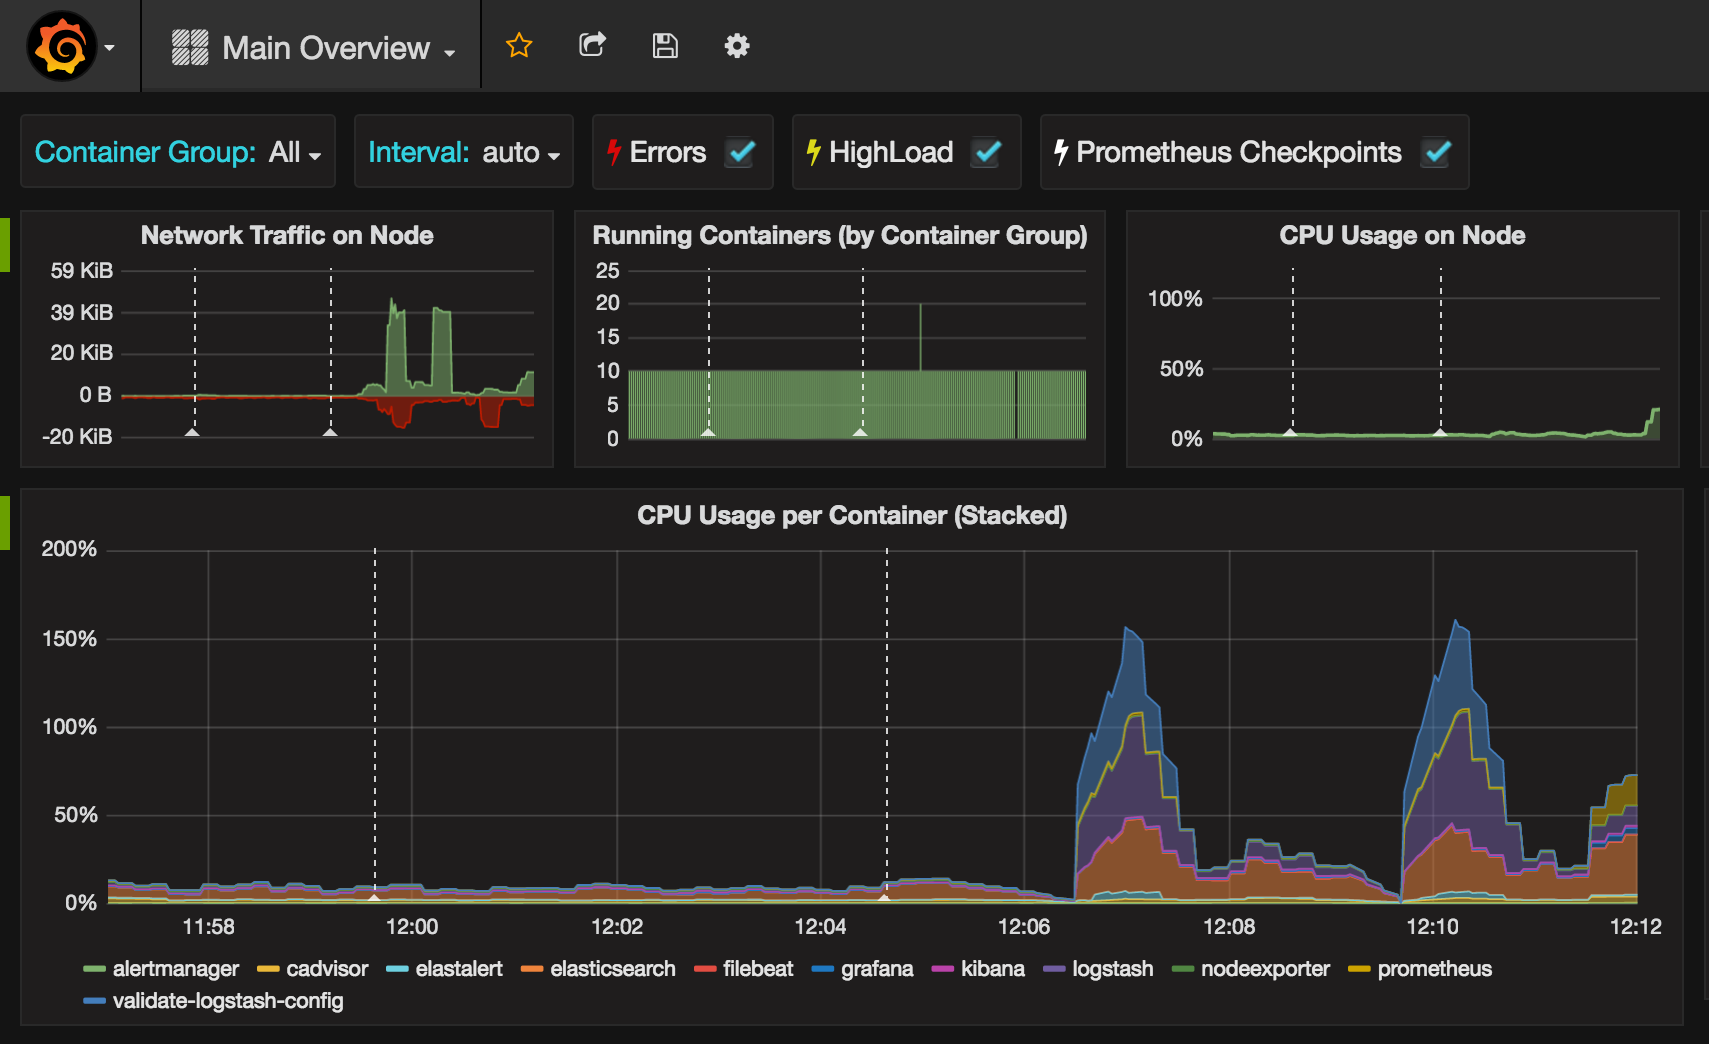
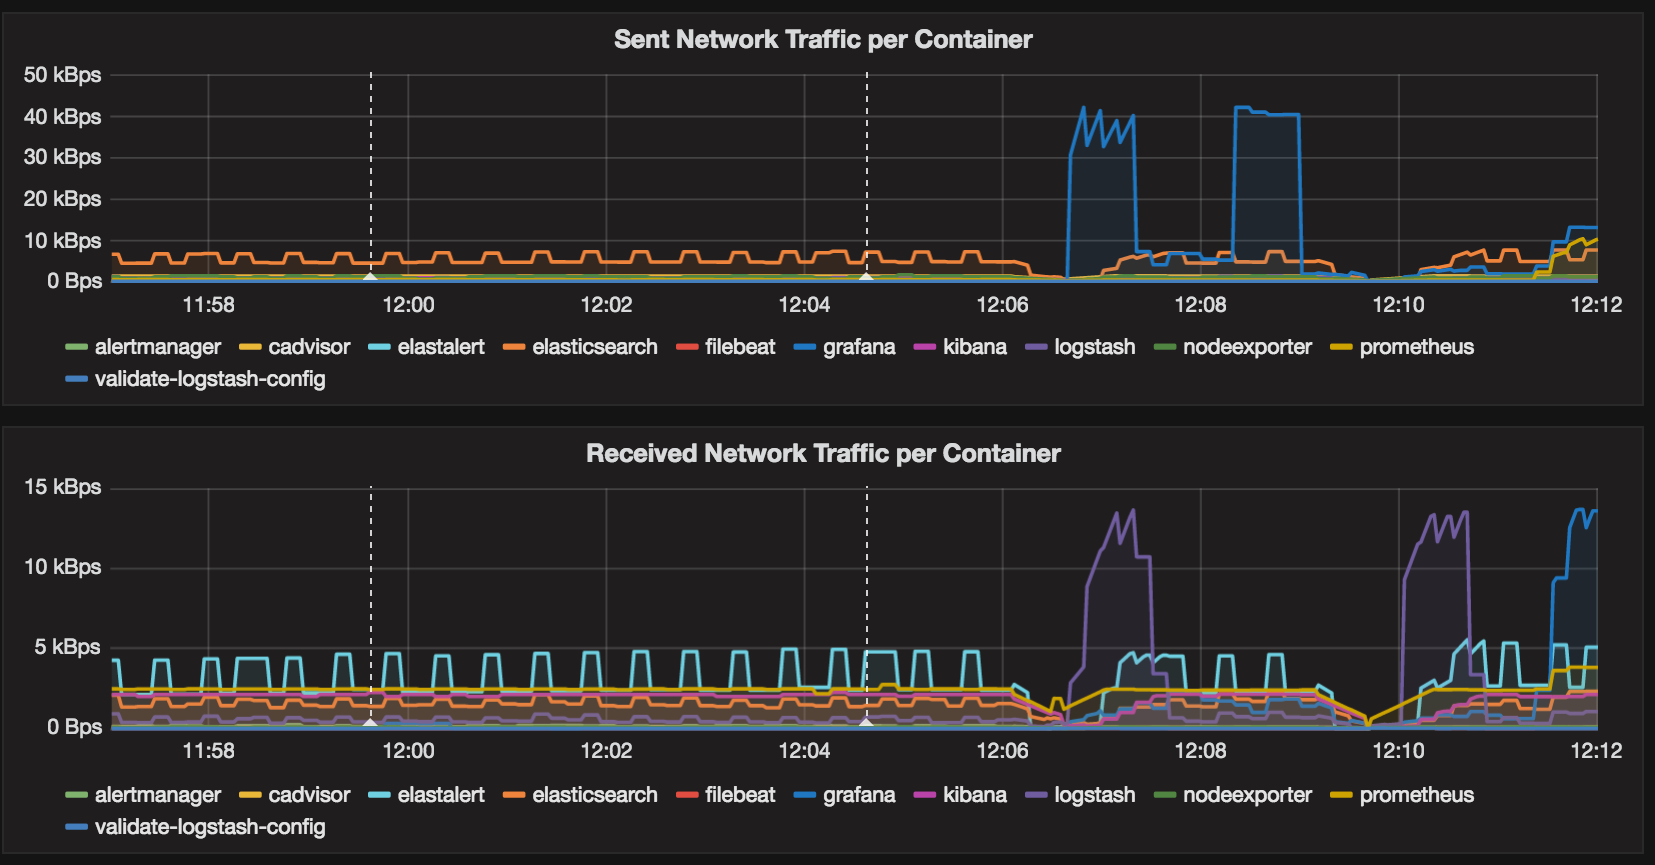
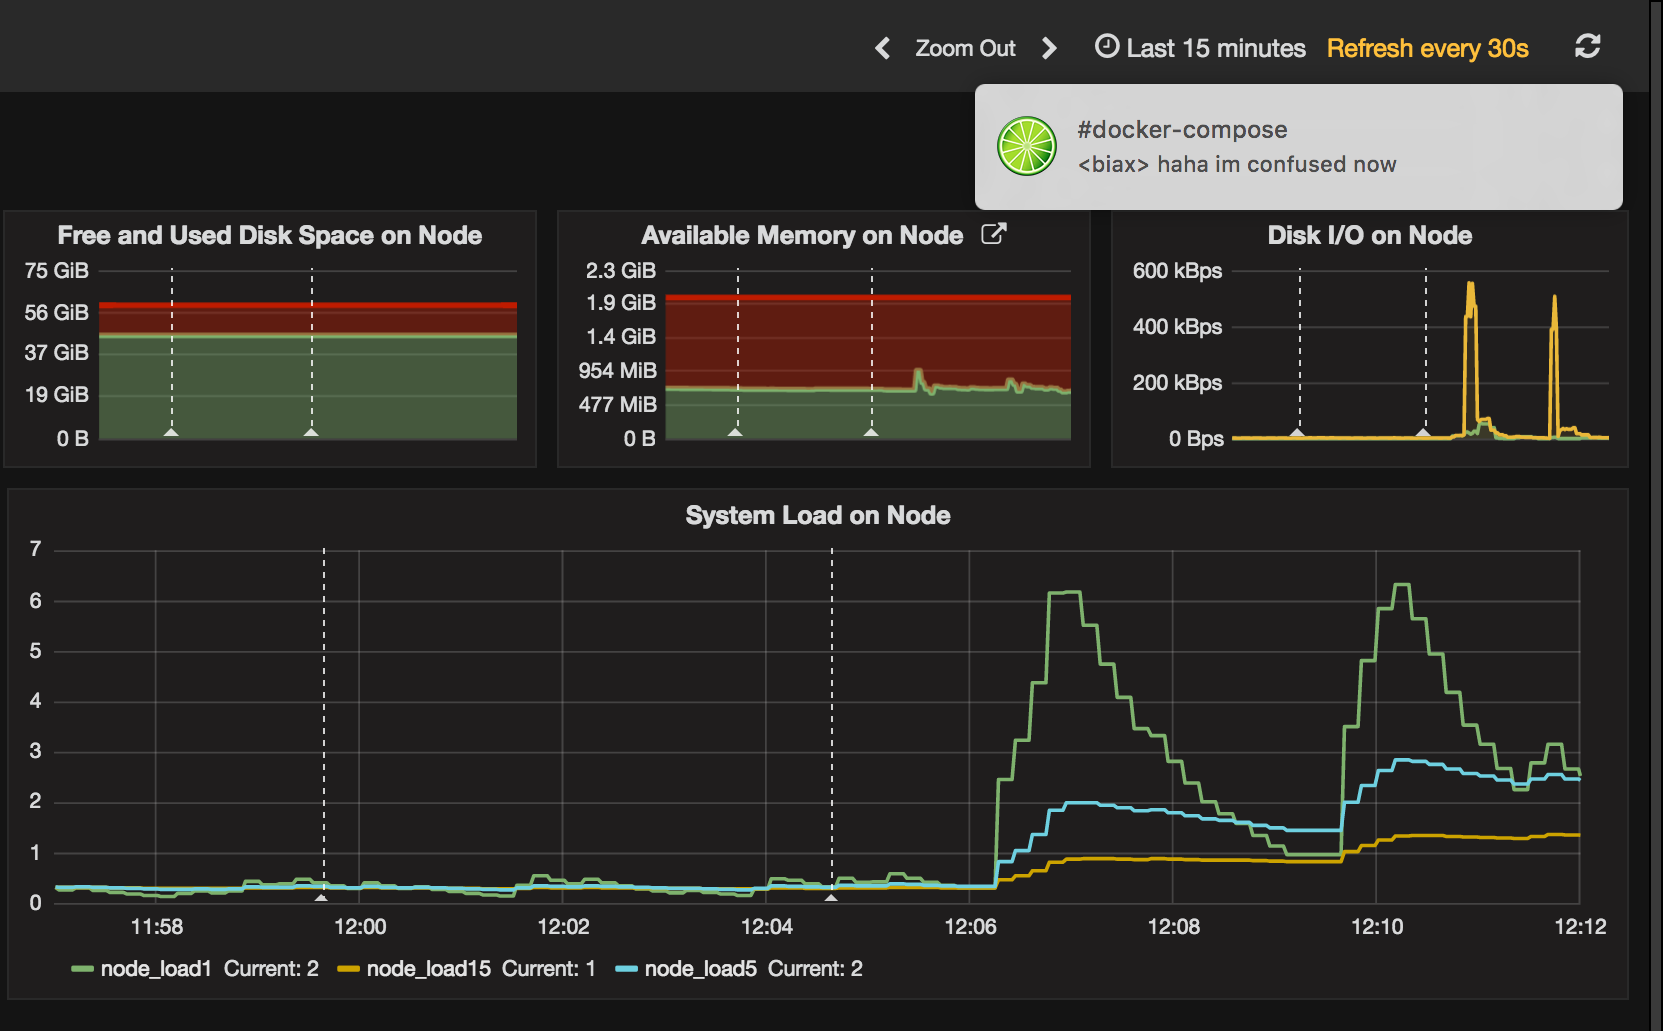
The screenshot should be pretty self-explanatory. Includes templating for container groups. The original (from the Github repository above) also draws annotations into the graphs by pulling user-defined log events and Prometheus alerts from an Elasticsearch (second screenshot).
Description from the Github repo:
- This is an out of the box monitoring, logging and alerting suite for Docker-hosts and their containers, complete with dashboards to monitor and explore your host and container logs and metrics.
- Monitoring: cAdvisor and node_exporter for collection, Prometheus for storage, Grafana for visualisation.
- Logging: Filebeat for collection and log-collection and forwarding, Logstash for aggregation and processing, Elasticsearch as datastore/backend and Kibana as the frontend.
- Alerting: elastalert as a drop-in for Elastic.io's Watcher for alerts triggered by certain container or host log events and Prometheus' Alertmanager for alerts regarding metrics.
Data source config
Collector type:
Collector plugins:
Collector config:
Revisions
Upload an updated version of an exported dashboard.json file from Grafana
| Revision | Description | Created | |
|---|---|---|---|
| Download |
Docker
Easily monitor Docker with Grafana Cloud's out-of-the-box monitoring solution.
Learn more