grafana-screenshot.png grafana-dynamic.png
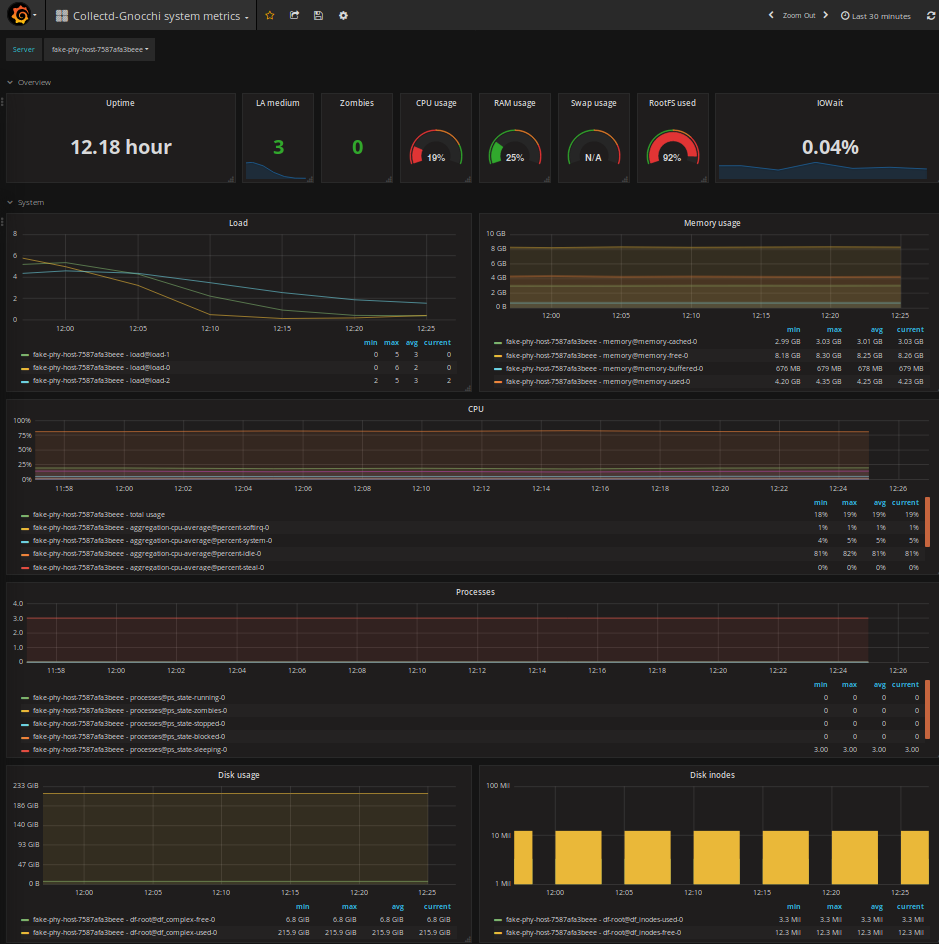
This dashboard shows system metrics collected with Collectd and stored in Gnocchi.
The dashboard uses features that requires Gnocchi >=4.1
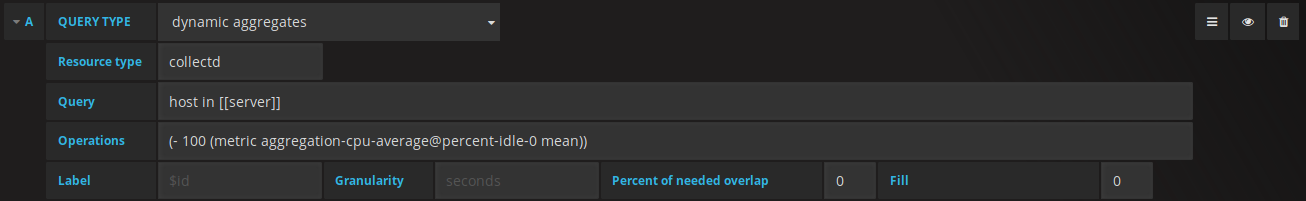
Collector Configuration Details
A special Gnocchi Archive Policy need to be configured to compute the rate of change network metrics:
gnocchi archive-policy create -d granularity:0:05:00,points:8640 rate:low -m rate:last
gnocchi archive-policy-rule create -m "interface-*@if_*" -a rate:low network-interface-rate
The following configuration of Collectd have been used:
Hostname "my-hostname"
FQDNLookup false
Interval 10
Timeout 2
ReadThreads 5
LoadPlugin aggregation
<Plugin aggregation>
<Aggregation>
Plugin "cpu"
Type "percent"
GroupBy "Host"
GroupBy "TypeInstance"
CalculateNum false
CalculateSum false
CalculateAverage true
CalculateMinimum false
CalculateMaximum false
CalculateStddev false
</Aggregation>
</Plugin>
LoadPlugin cpu
<Plugin cpu>
ReportByCpu true
ReportByState true
ValuesPercentage true
</Plugin>
LoadPlugin df
<Plugin df>
ReportInodes true
ValuesPercentage true
</Plugin>
LoadPlugin disk
LoadPlugin memory
<Plugin memory>
ValuesAbsolute true
ValuesPercentage true
</Plugin>
LoadPlugin processes
LoadPlugin uptime
LoadPlugin interface
LoadPlugin load
LoadPlugin network
LoadPlugin python
<Plugin python>
Import "collectd_gnocchi"
<Module collectd_gnocchi>
Endpoint "http://gnocchi-api:8041/"
User admin
</Module>
</Plugin>