Apache
Apache Prometheus Dashboard
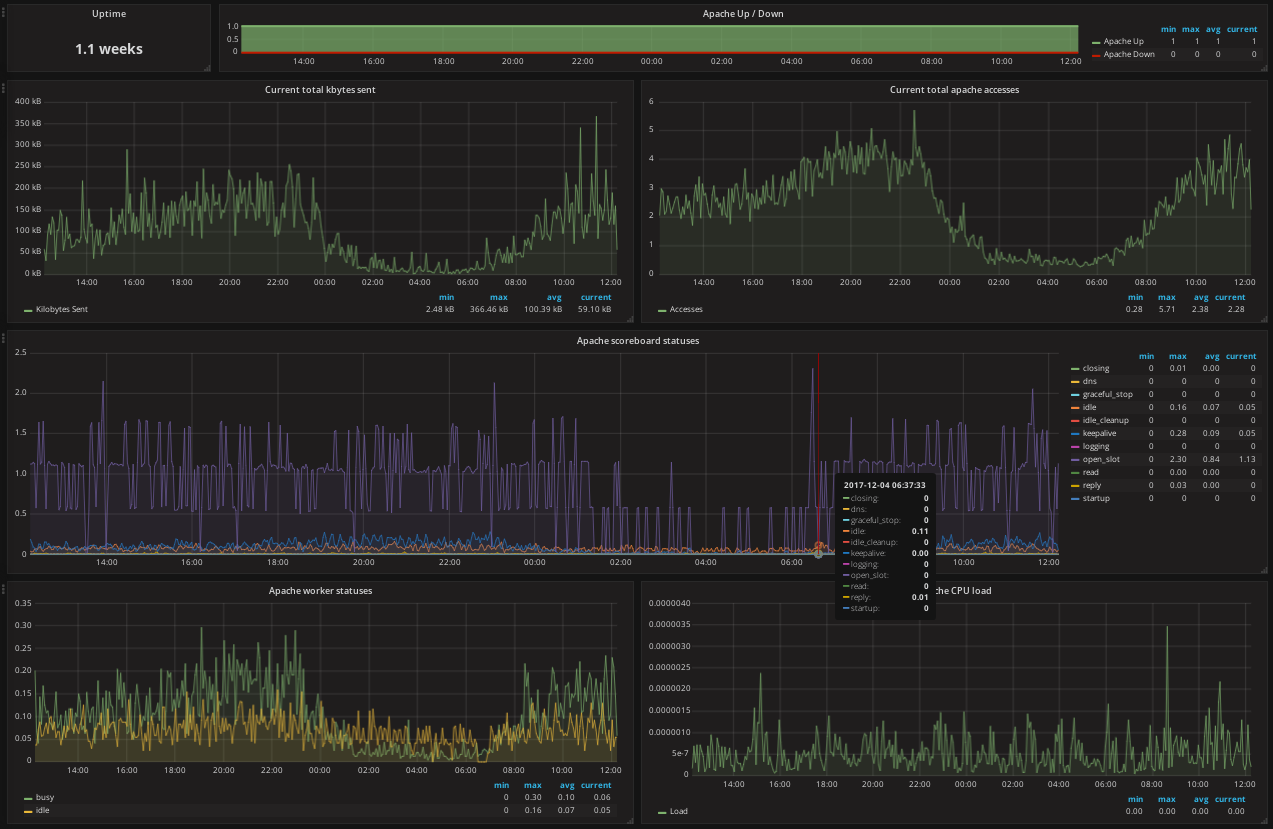
Nearly all values exported by Prometheus Apache exporter graphed.
Available on github: https://github.com/rfmoz/grafana-dashboards.git
Data source config
Collector type:
Collector plugins:
Collector config:
Revisions
Upload an updated version of an exported dashboard.json file from Grafana
| Revision | Description | Created | |
|---|---|---|---|
| Download |