
Prometheus memcached
Prometheus dashboard for memcached servers
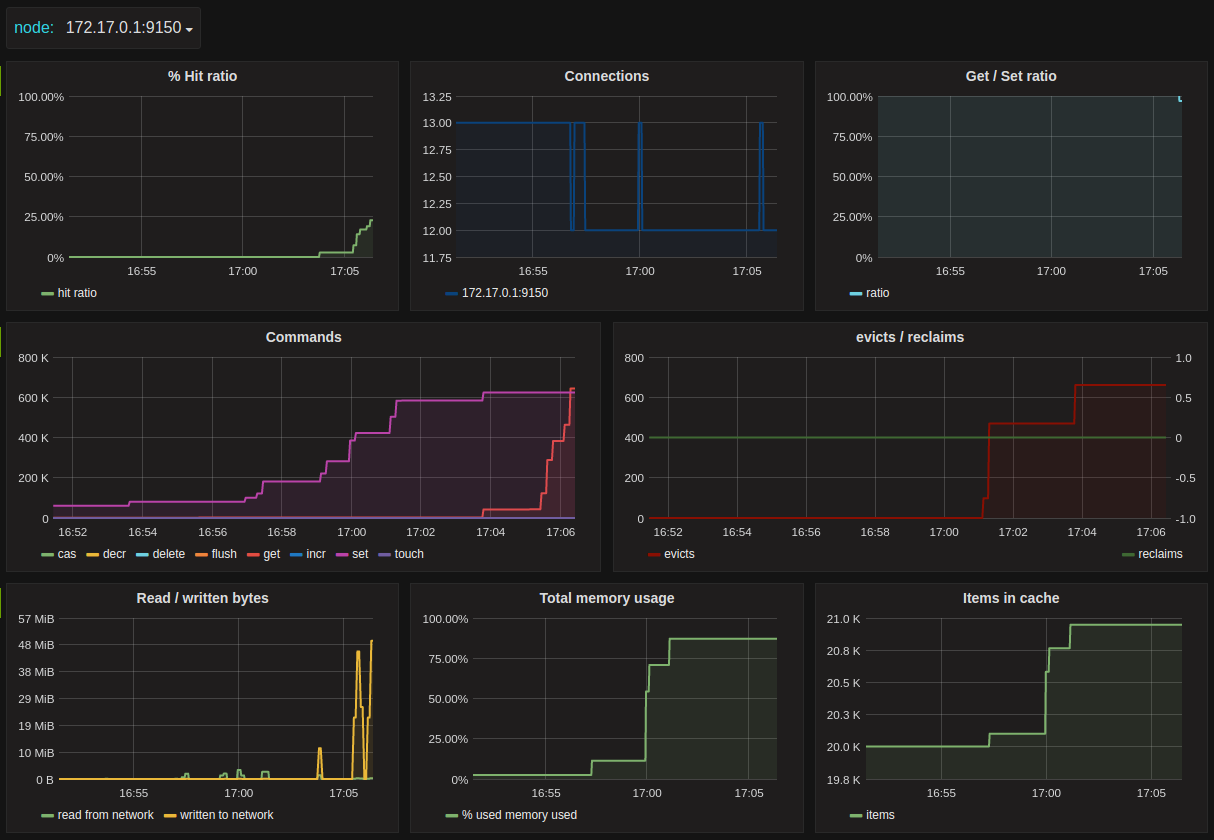
Dashboard for getting a complete overview of your memcached servers using prometheus and memcached_exporter.
Metrics
- % Hit ratio
- Current connections
- Get/set command ratio
- Command usage
- Evict / reclaim
- Network read/write
- Total memory usage
- Items in cache.
This dashboard is based on the metrics created by github.com/prometheus/memcached_exporter using default flags.
Feedback
Comments? suggestions? Please open issues/pull requests to https://github.com/bergquist/dashboards
Data source config
Collector type:
Collector plugins:
Collector config:
Dashboard revisions
Upload an updated version of an exported dashboard.json file from Grafana
| Revision | Decscription | Created | |
|---|---|---|---|
| Download |
Sign up for Grafana Cloud

Get up and running in minutes with the Grafana Cloud free tier, which includes free forever 10k metrics, 50GB logs, 50GB traces, 500 VUh, and more.
Get this dashboard
Data source:
Dependencies: