HAproxy Servers | HAproxy
HAproxy backend servers
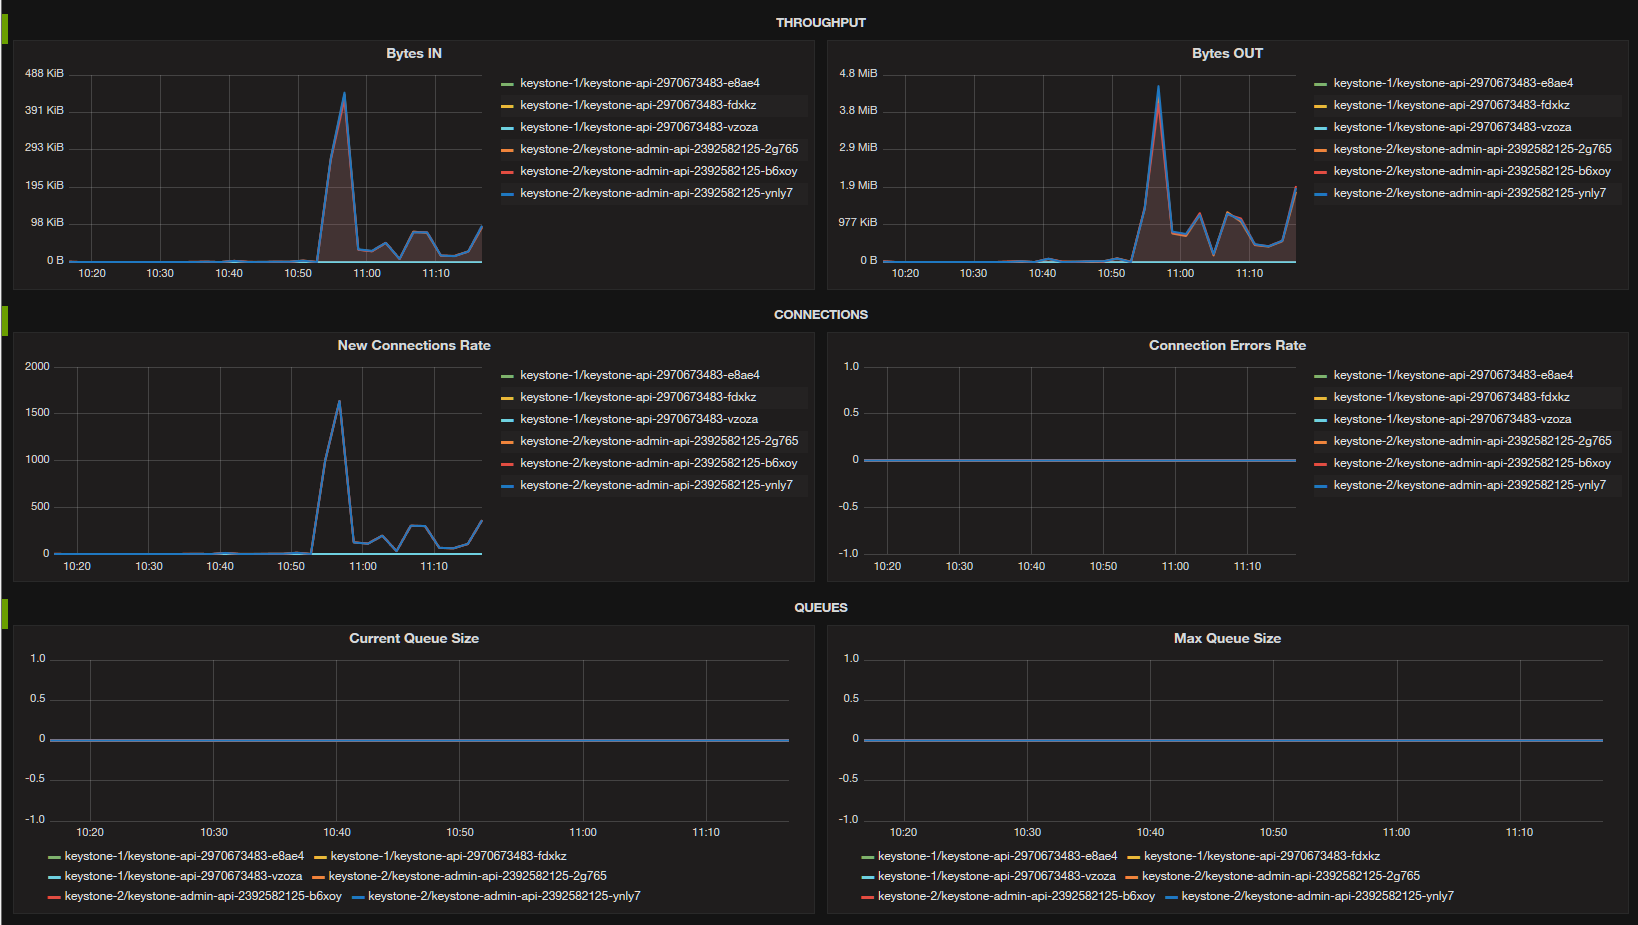
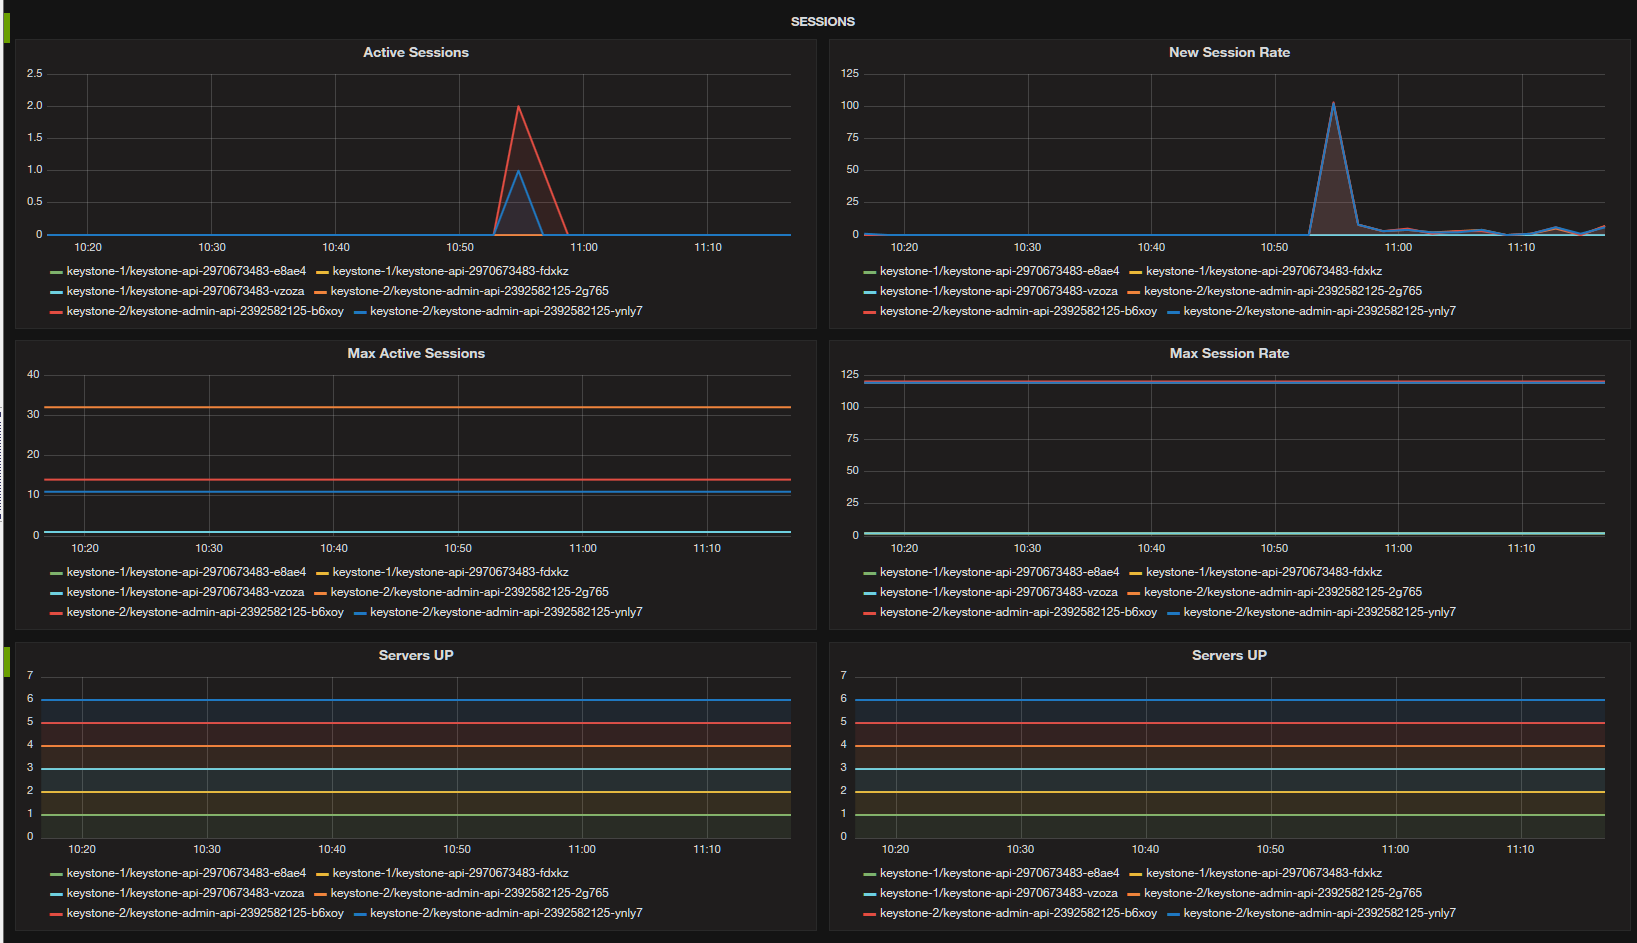
This dashboard displays the detailed number of responses and their split by HTTP codes along aggregated throughput for the haproxy backend servers.
It requires that you gather haproxy metrics using the haproxy_exporter from prometheus link
Example prometheus configuration:
  - job_name: 'loadbalancer1'
    static_configs:
      - targets: ['172.18.0.108:9101']
        labels:
          alias: loadbalancer1
You need to have the stats option configured in your global section of haproxy.cfg, example:
global
	log /dev/log	local0
	log /dev/log	local1 notice
	user haproxy
	group haproxy
	maxconn  16000
	stats  socket /var/lib/haproxy/stats level admin
	tune.bufsize  32768
	tune.maxrewrite  1024
	tune.ssl.default-dh-param 2048
	daemon
You can start the exporter to listen on the unix socket:
haproxy_exporter -haproxy.scrape-uri unix:/var/lib/haproxy/stats
Data source config
Collector type:
Collector plugins:
Collector config:
Revisions
Upload an updated version of an exported dashboard.json file from Grafana
| Revision | Description | Created | |
|---|---|---|---|
| Download |
HAProxy
Easily monitor HAProxy, a free, fast, and reliable reverse-proxy, with Grafana Cloud's out-of-the-box monitoring solution.
Learn more