Prometheus 2.0 Overview
Get started faster with Grafana Cloud then easily build these dashboards. https://grafana.com/products/cloud/ Overview of metrics from Prometheus 2.0. Useful for using prometheus to monitor your prometheus. Revisions welcome!
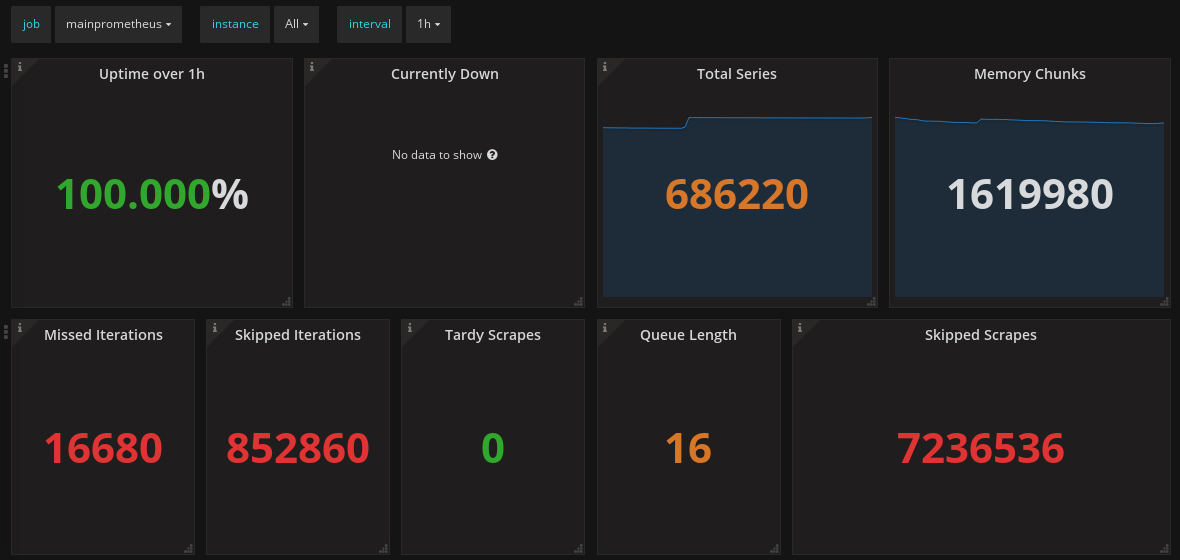
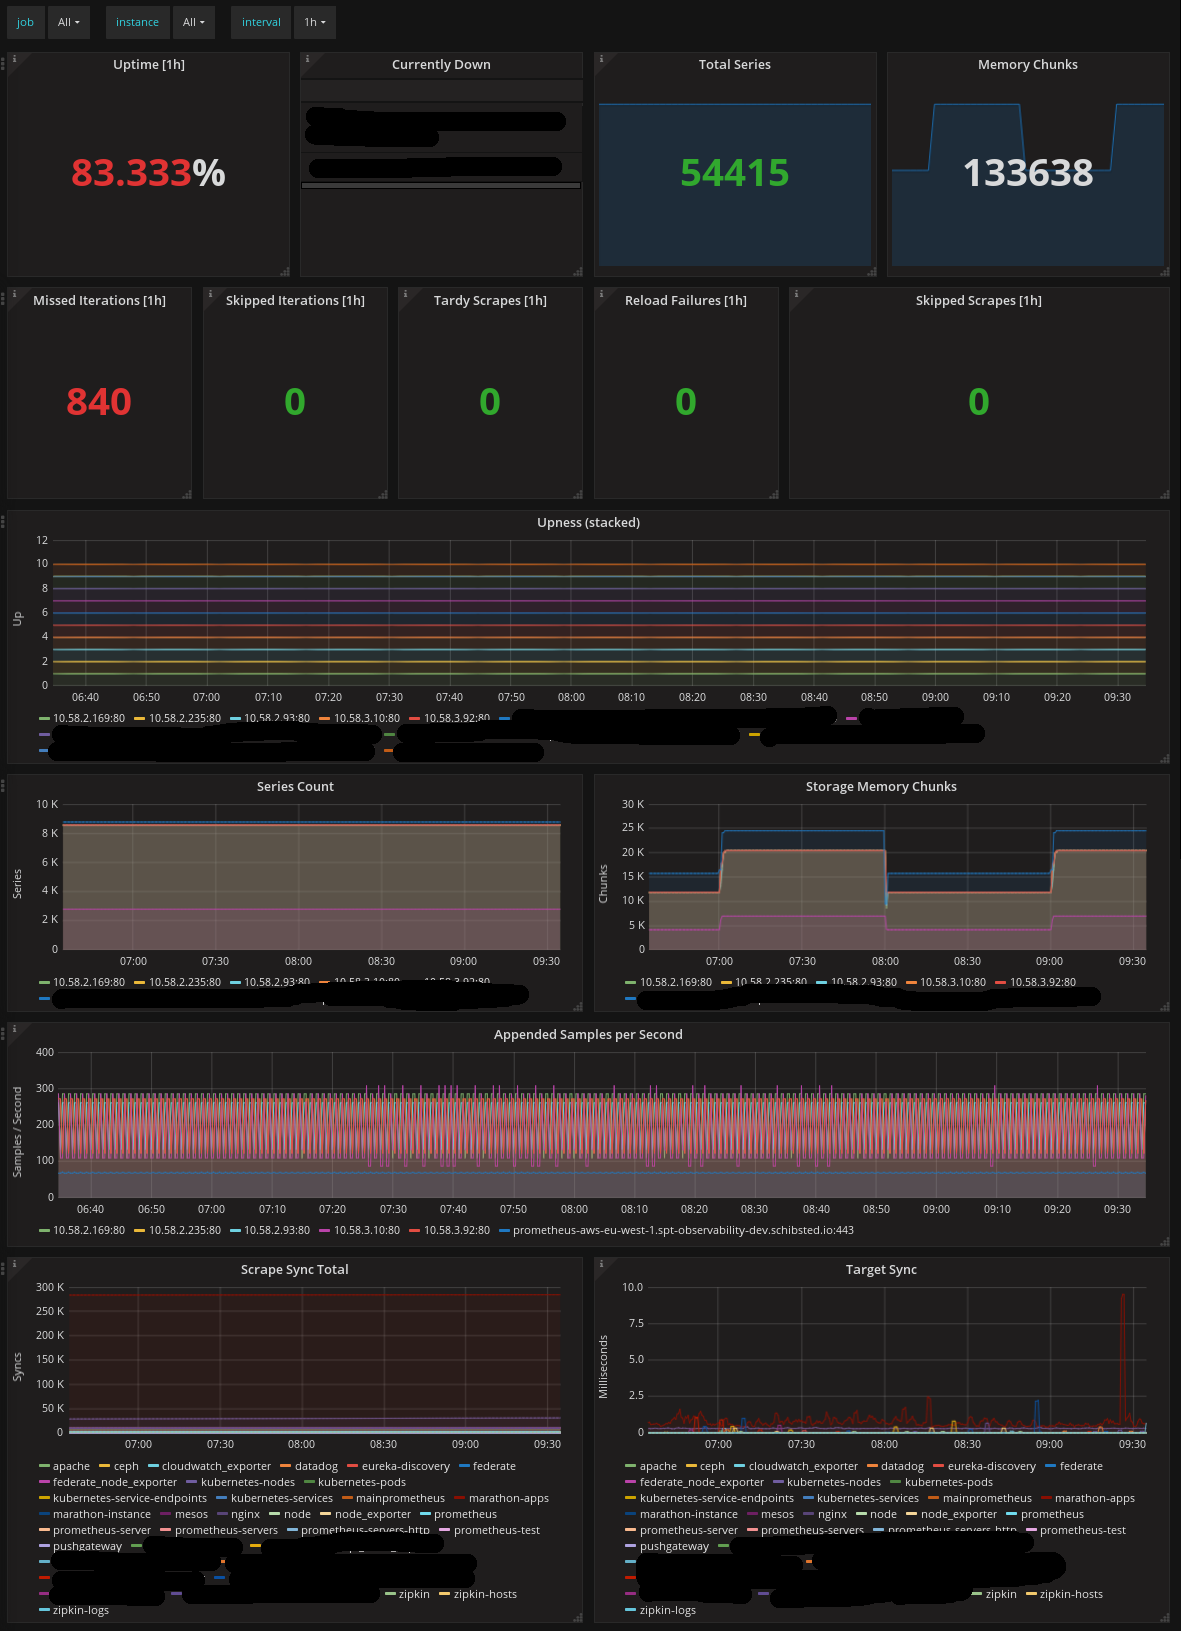
Prometheus server provides its own metrics on /metrics. This dashboard graphs some of them, with intelligent templating (ie for when you have different jobs of prometheus servers).
Please note: this graph works for metrics from Prometheus 2.0, not 1.0.0 as the Dependencies state.
Get started faster with a Grafana Cloud trial: https://grafana.com/products/cloud/
Data source config
Collector config:
Upload an updated version of an exported dashboard.json file from Grafana
| Revision | Description | Created | |
|---|---|---|---|
| Download |
Metrics Endpoint (Prometheus)
Easily monitor any Prometheus-compatible and publicly accessible metrics URL with Grafana Cloud's out-of-the-box monitoring solution.
Learn more