
Selenoid Stats
Browsers and resource usage for project https://github.com/aerokube/selenoid
Example dashboard for Selenoid’s Sending Statistics to External Systems help section, but with telegraf + influxdb pair.
Features
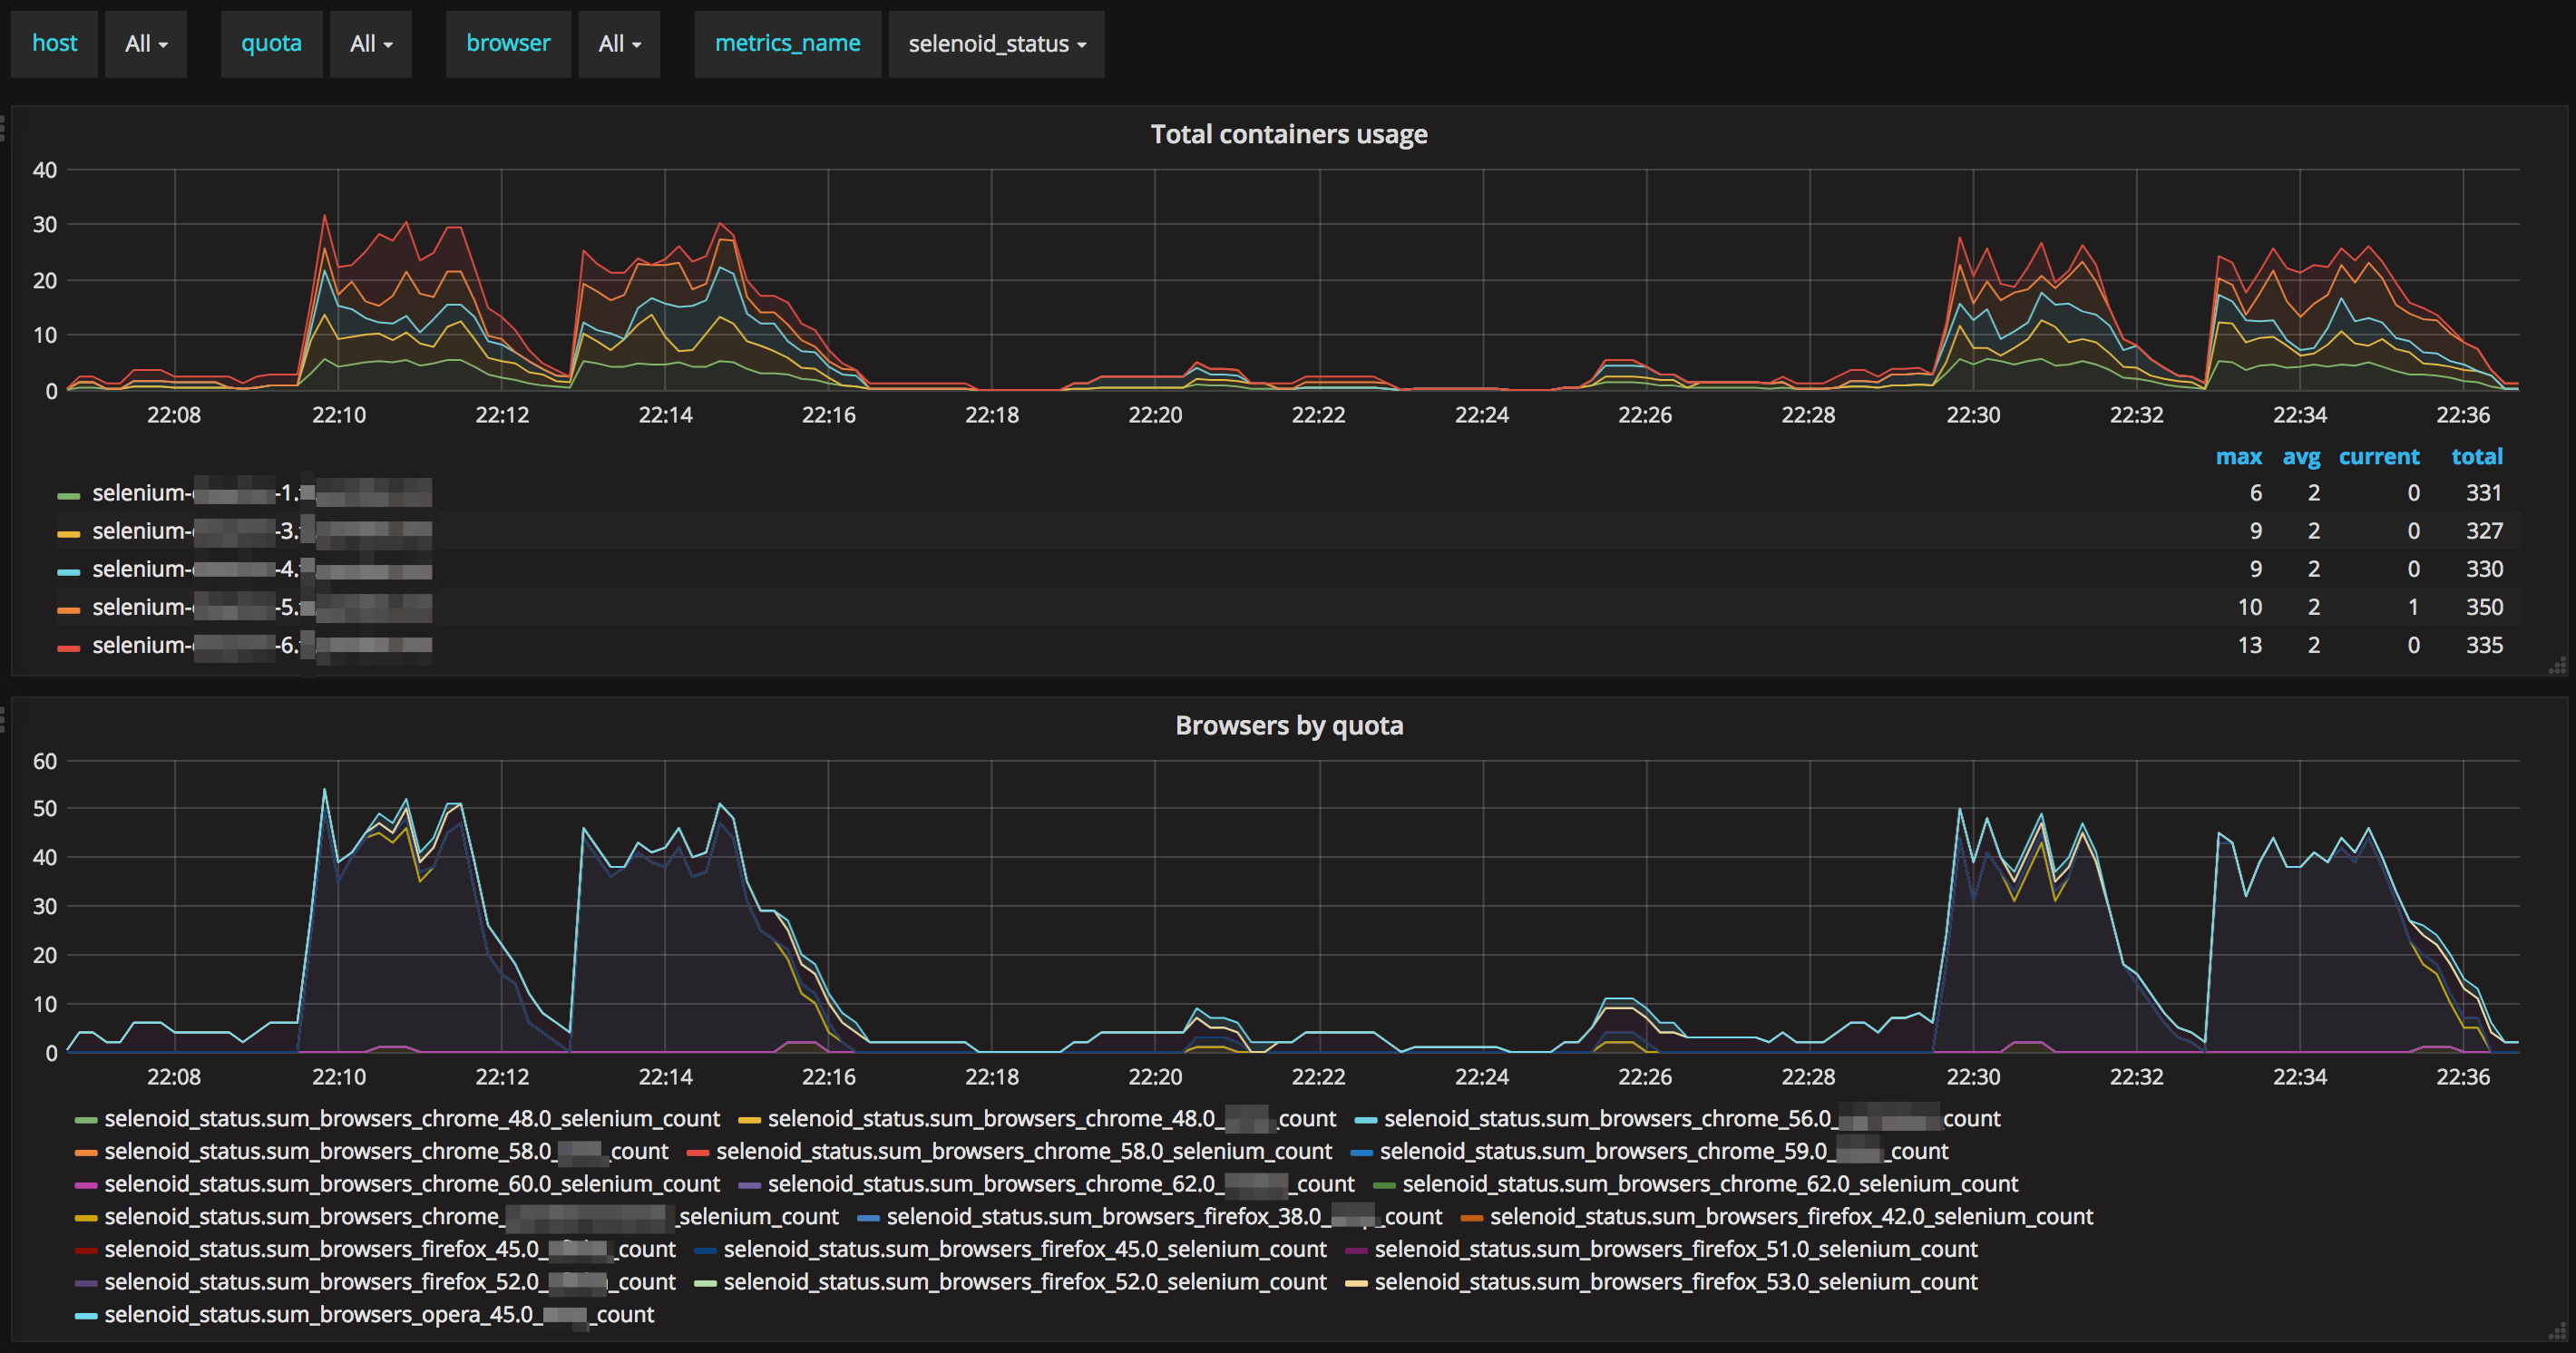
- Shows total usage of browsers on each host
- Can show usage of browsers in quota
- Can show browser usage in quotas
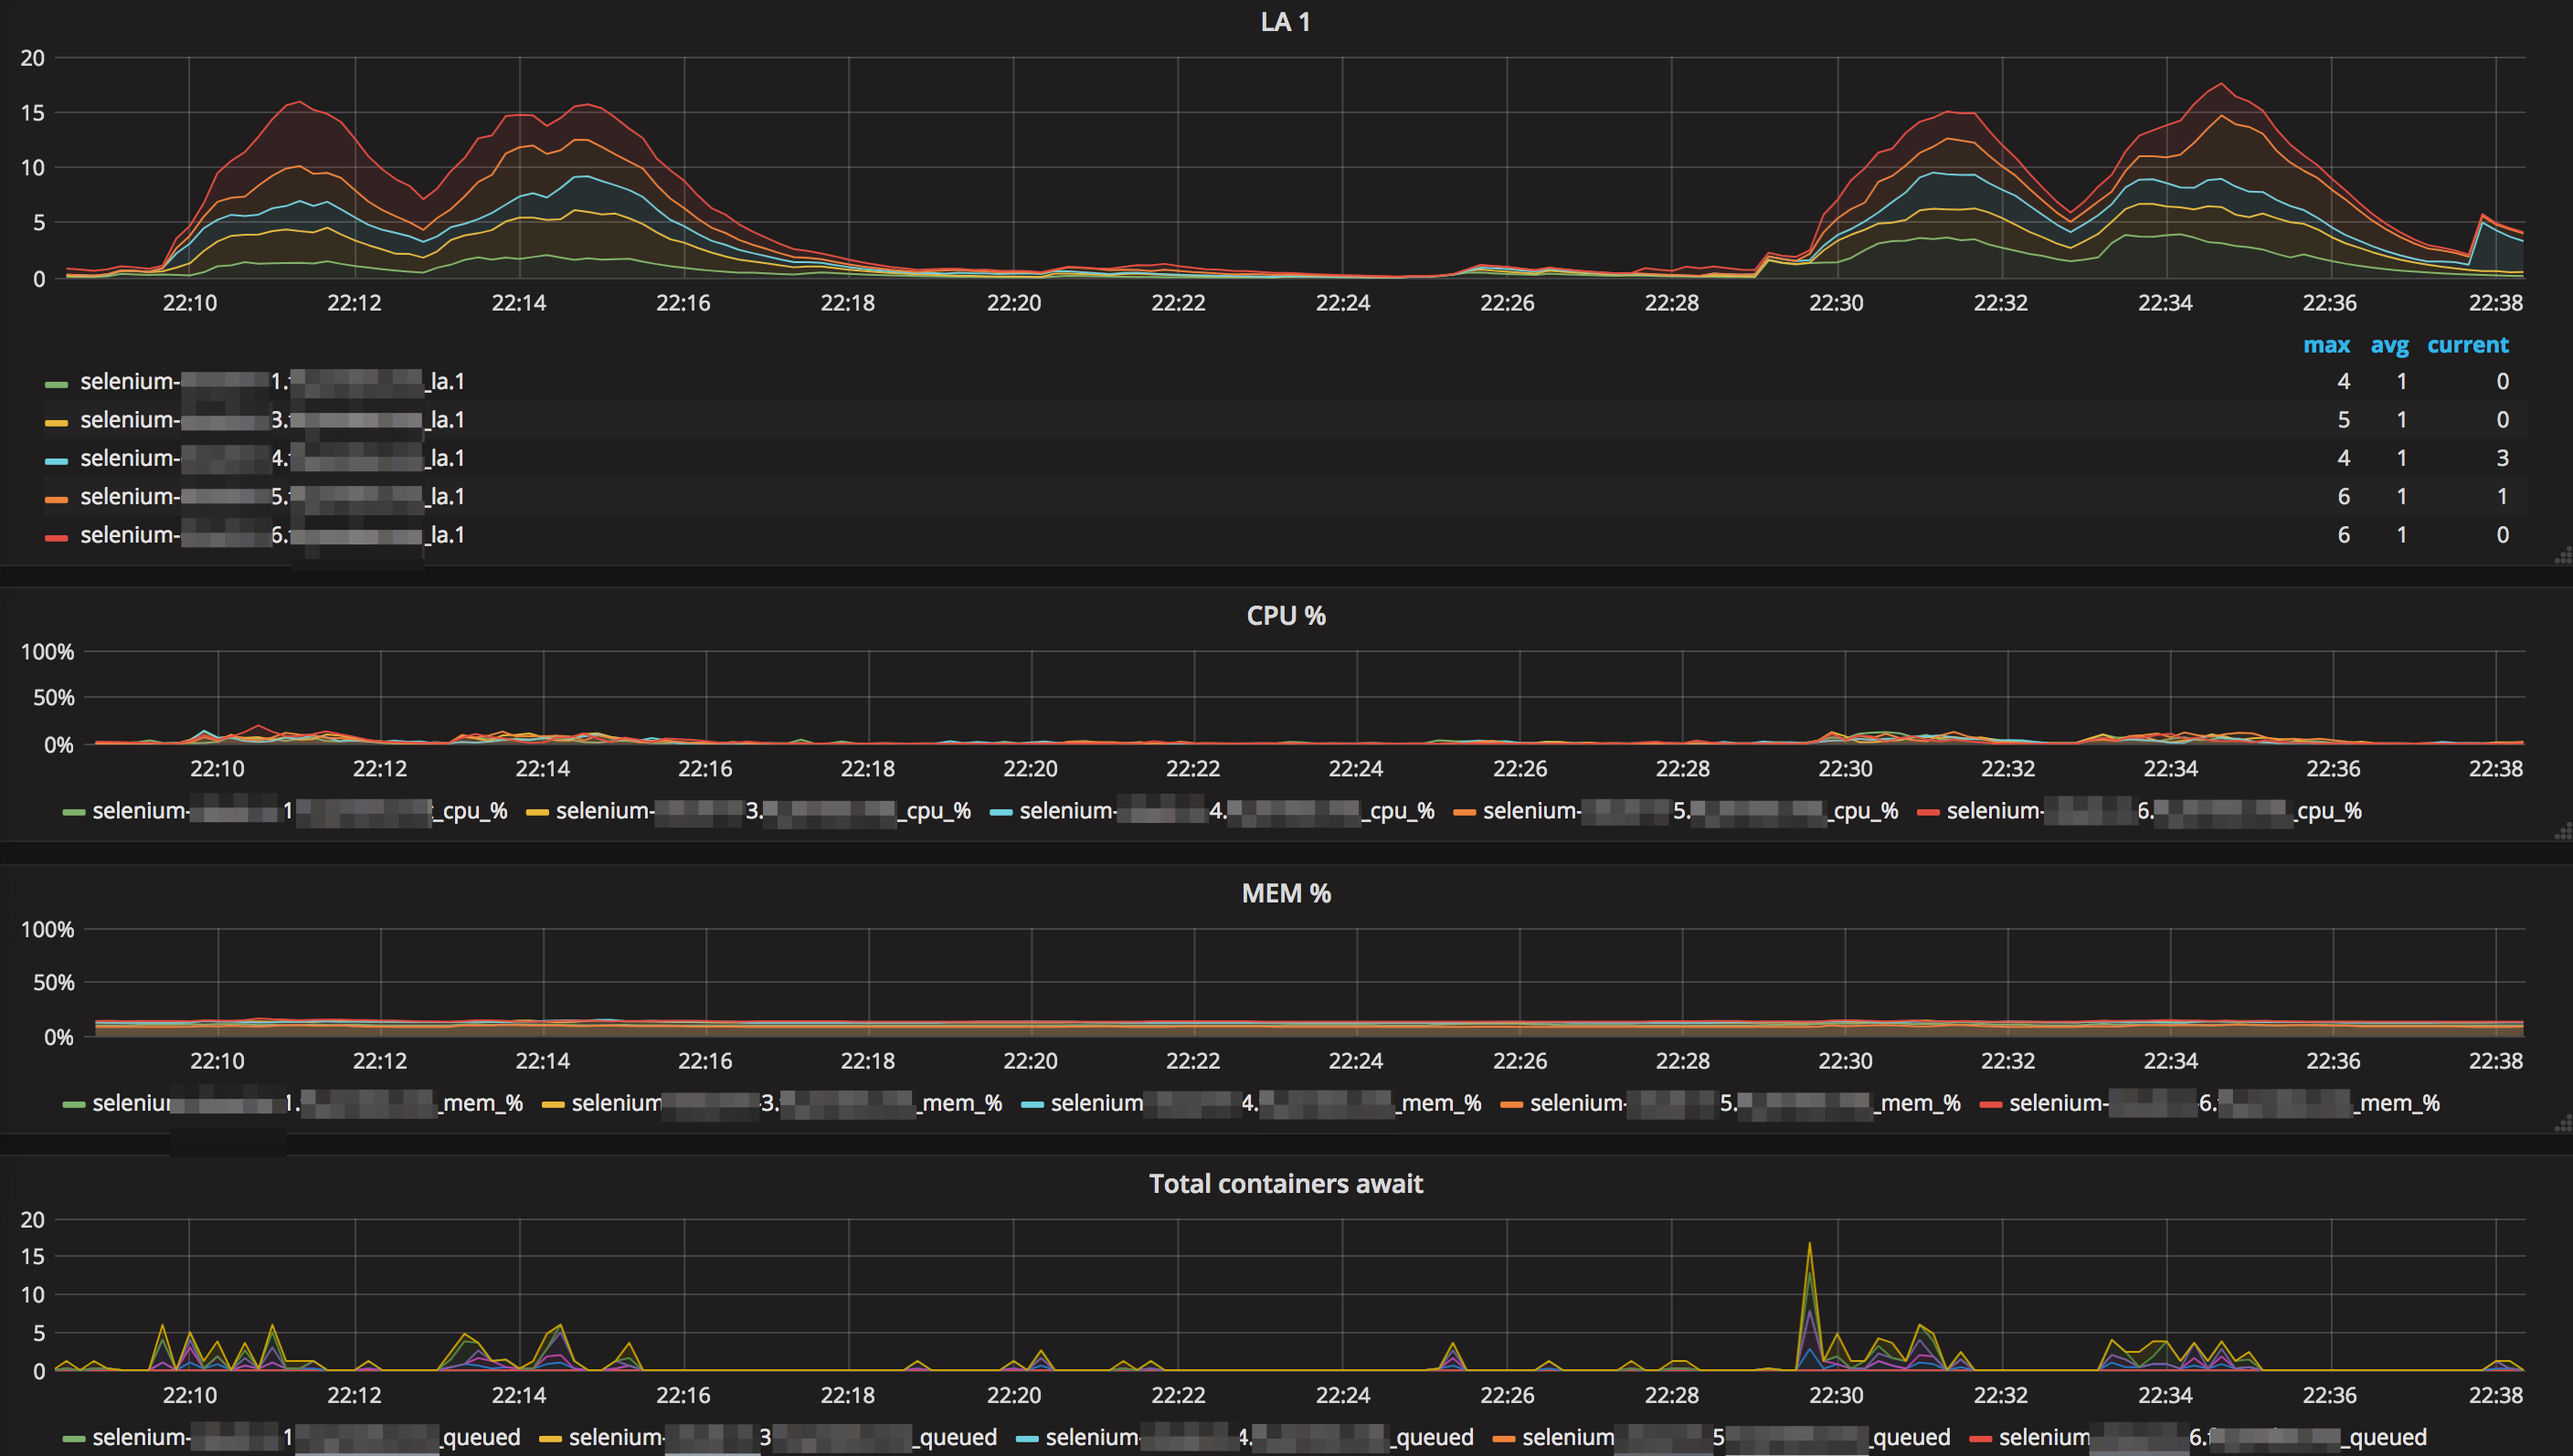
- Can match LA with active browsers
Requirements
You should install telegraf agent on each selenoid host to make possible system metrics collection.
Example
Example of ready-to-use telegraf+influxdb+grafana with docker-compose can be found at https://github.com/aerokube/selenoid-grafana-example
Data source config
Collector type:
Collector plugins:
Collector config:
Dashboard revisions
Upload an updated version of an exported dashboard.json file from Grafana
| Revision | Decscription | Created | |
|---|---|---|---|
| Download |
Sign up for Grafana Cloud

Get up and running in minutes with the Grafana Cloud free tier, which includes free forever 10k metrics, 50GB logs, 50GB traces, 500 VUh, and more.
Get this dashboard
Data source:
Dependencies: