Deepstream Enterprise Dashboard
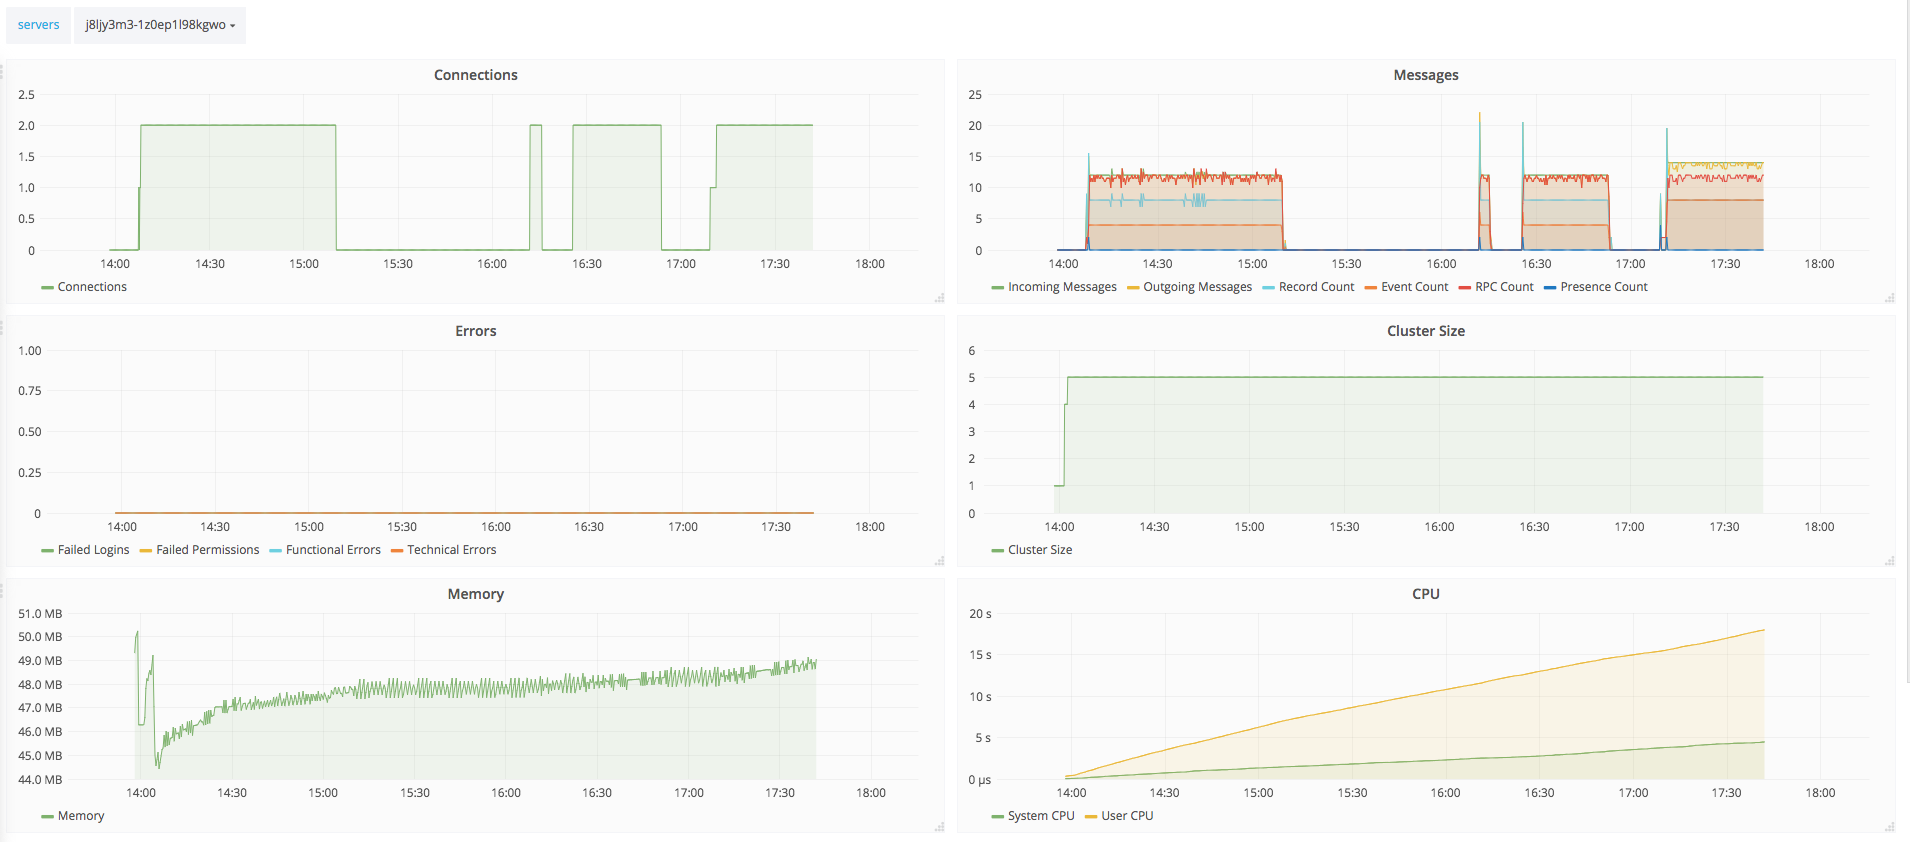
A dashboard for deepstream enterprise that shows metrics over time such as messages, connections, cluster size and CPU usage.
This dashboard is for use with deepstream-enterprise and needs to be backed by an InfluxDB instance.
Typically it will be easiest to use a Logstash agent to push your deepstream data to InfluxDB, for this, the Logstash configuration could look as follows:
input {
  http_poller {
    # List of urls to hit
    # URLs can either have a simple format for a get request
    # Or use more complex HTTP features
    urls => {
      local_deepstream => "http://localhost:7070/"
    }
    # Maximum amount of time to wait for a request to complete
    request_timeout => 5
    # How far apart requests should be
    interval => 10
    # Decode the results as JSON
    codec => "json"
  }
}
output {
  influxdb {
    codec => "json"
    send_as_tags => ["serverName"]
    use_event_fields_for_data_points => true
    db => "deepstream"
    measurement => "deepstream"
    data_points => {}
    host => "<Your InfluxDB URL>"
  }
}
Data source config
Collector config:
Upload an updated version of an exported dashboard.json file from Grafana
| Revision | Description | Created | |
|---|---|---|---|
| Download |
Cilium Enterprise
Easily monitor your deployment of Cilium Enterprise with Grafana Cloud's out-of-the-box monitoring solution.
Learn more
