Apache Overview
Performance metrics for Apache
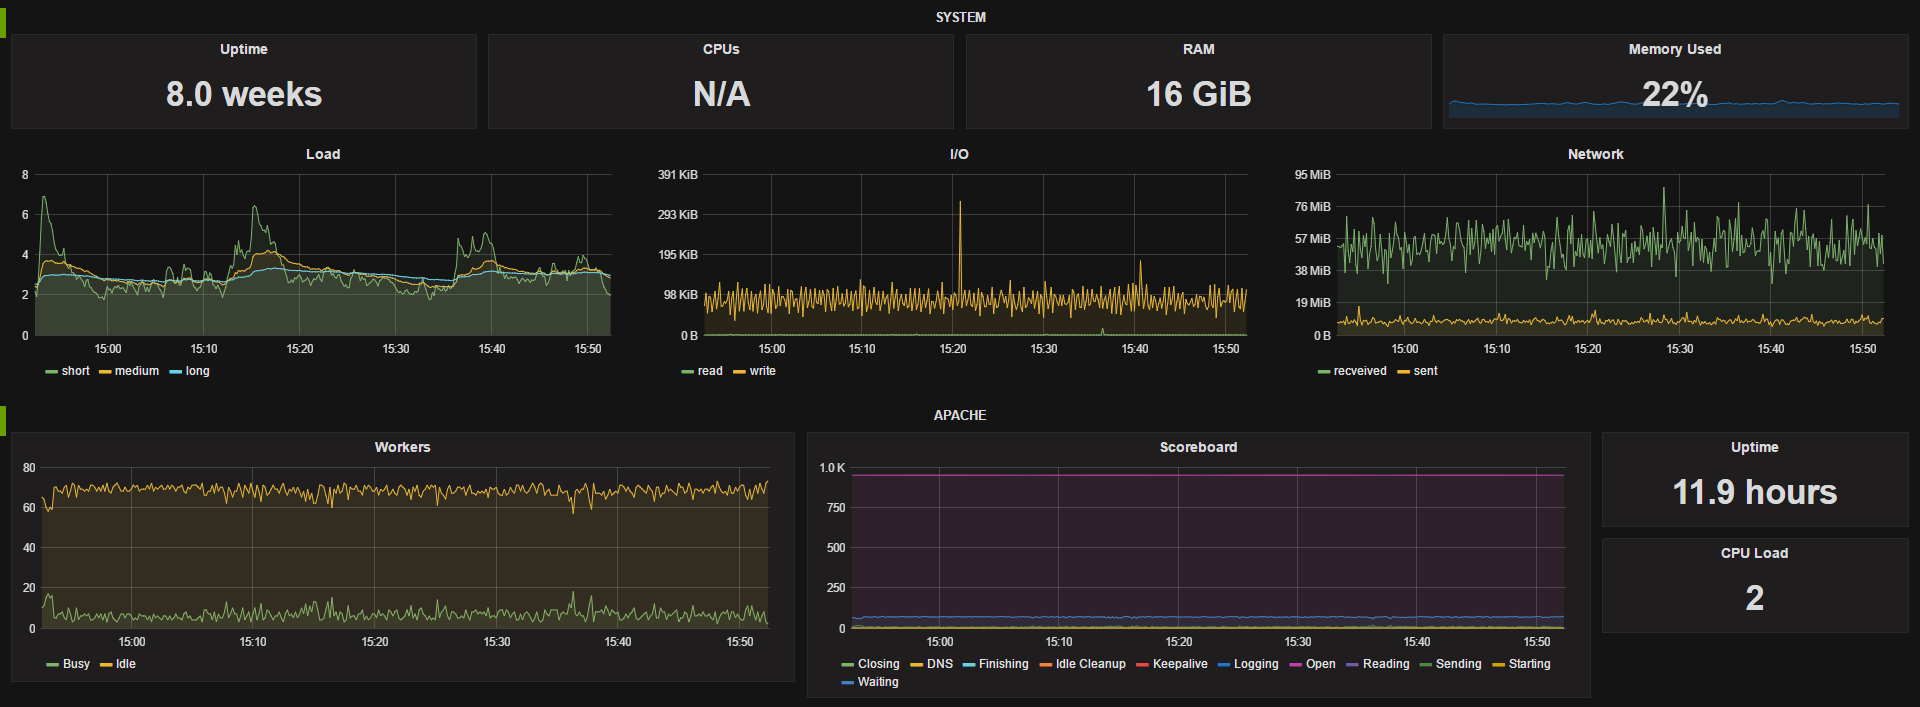
The dashboard provides the following;
System stats for uptime, cpu count, RAM, free memory %, and panels for load, I/O and network traffic. Apache workers and scoreboard panels and uptime and CPU load single stats.
Metrics come from the Telegraf using the Apache plugin and requires local access to Apache's server status page (Extended stats should be enabled).
The dashboard utilizes templating to dynamically choose the datasource and host In our usecase we have a different datasource for each of our environments (dev, qa, staging and prod) so being able to easily switch between them is very useful, you could easily remove this option if you have a single data source. The available hosts gets updated when you change data srouces.
Data source config
Collector config:
Upload an updated version of an exported dashboard.json file from Grafana
| Revision | Description | Created | |
|---|---|---|---|
| Download |