Java Micrometer
Java metrics exposed with Micrometer
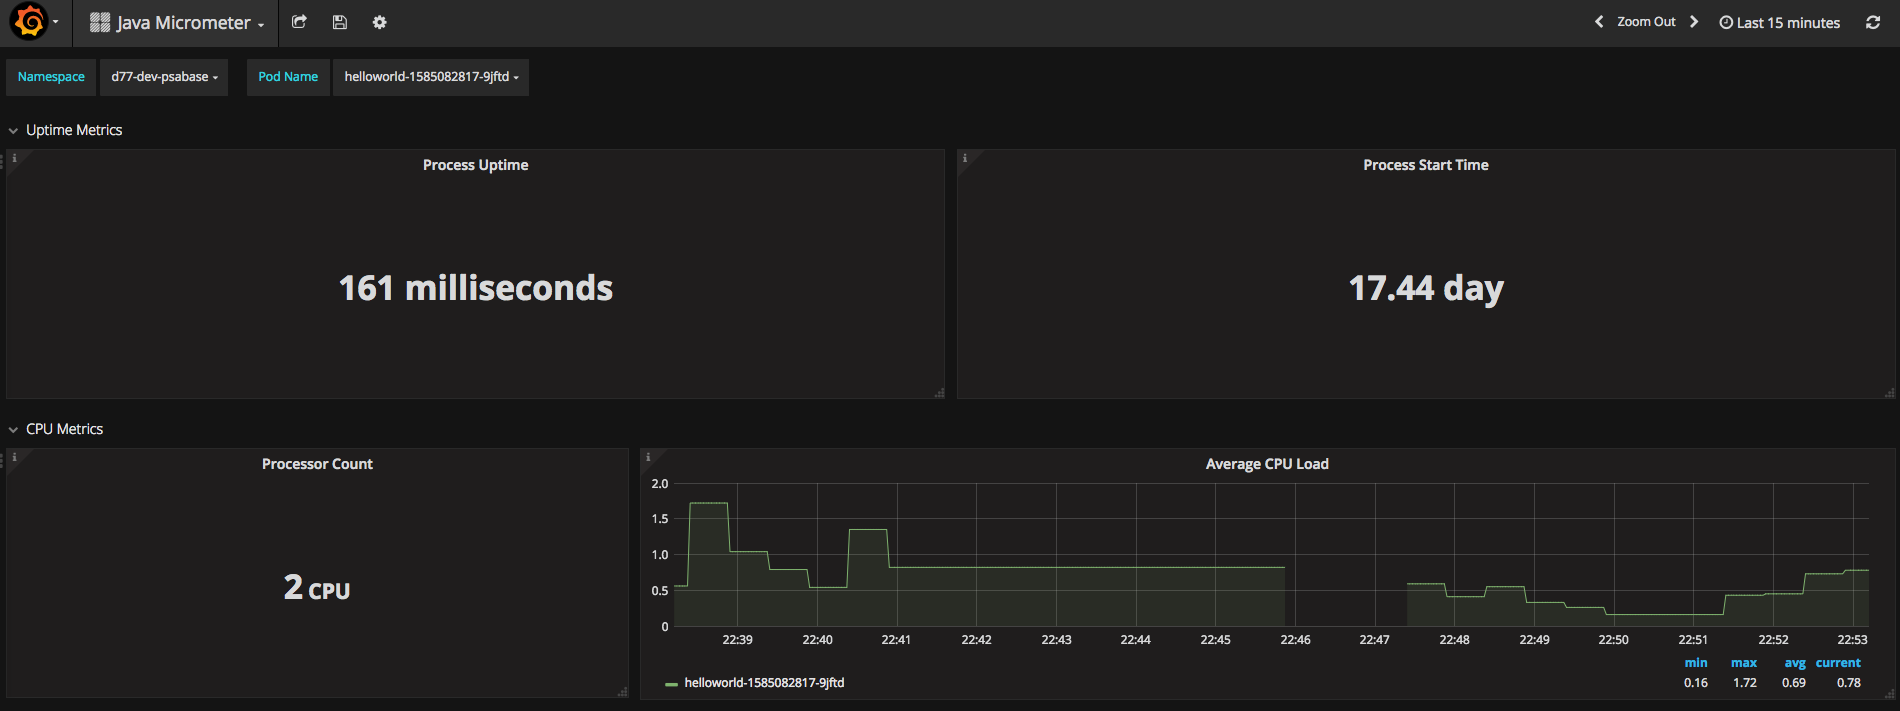
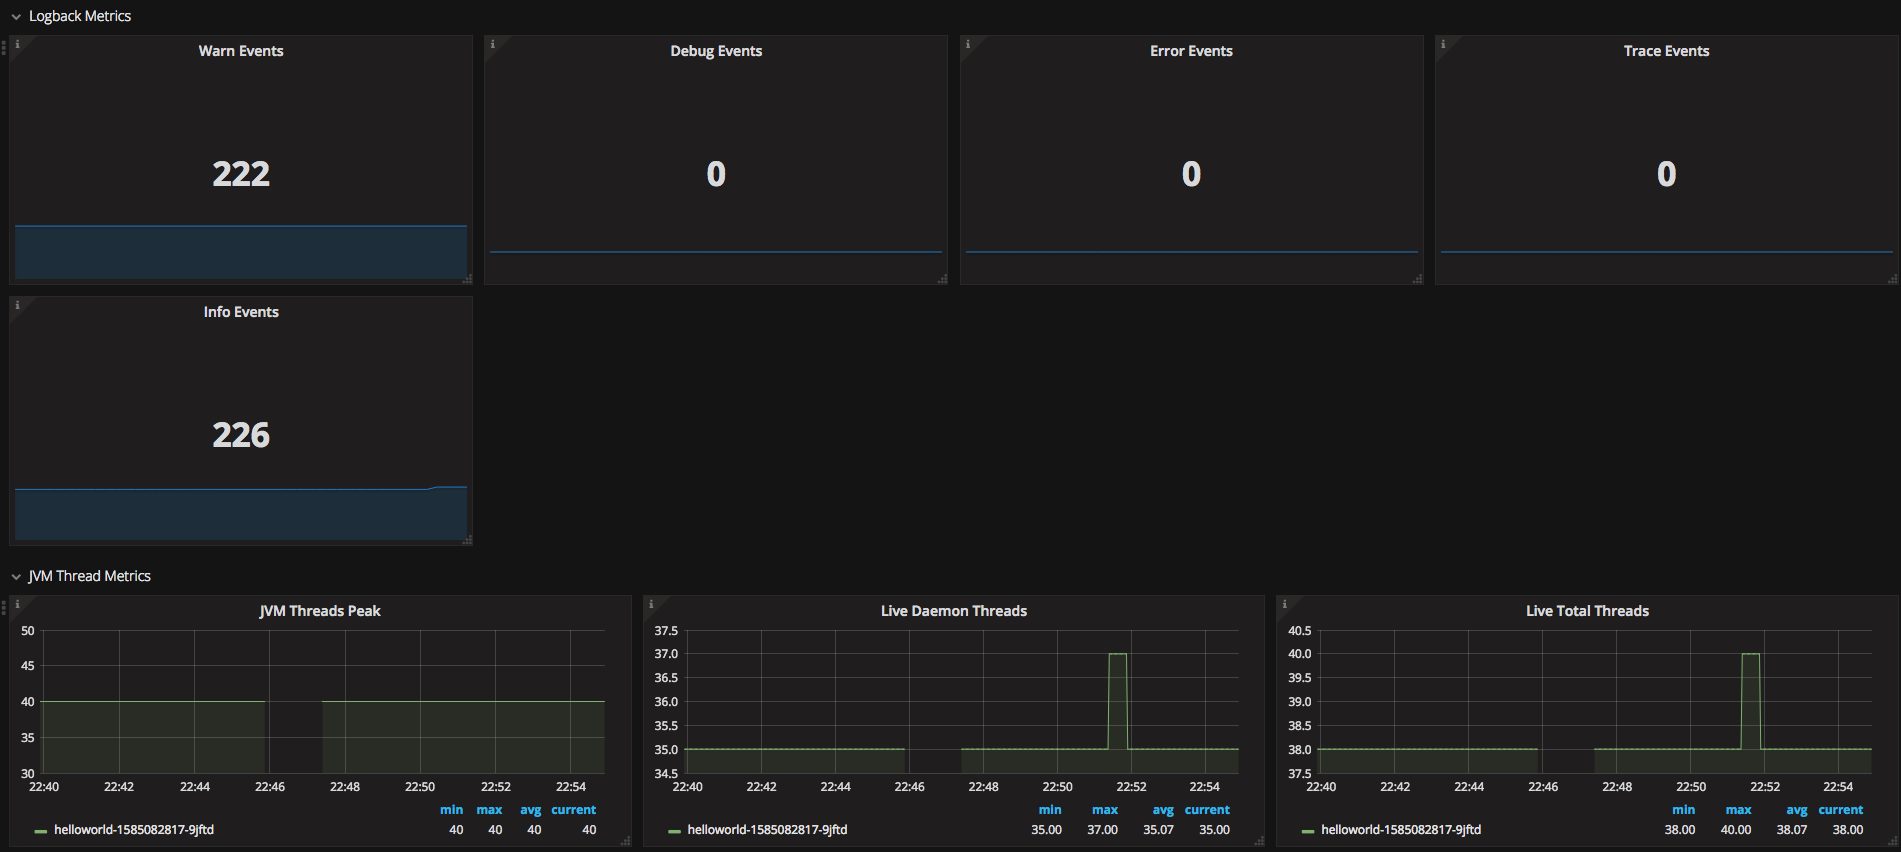
Grafana dashboard for metrics exposed through MicroMeter in a Spring Boot application that is running as a MicroService in a Kubernetes Container environment. The following list of metrics is exposed:
- Uptime metrics
- CPU metrics
- Logback metrics
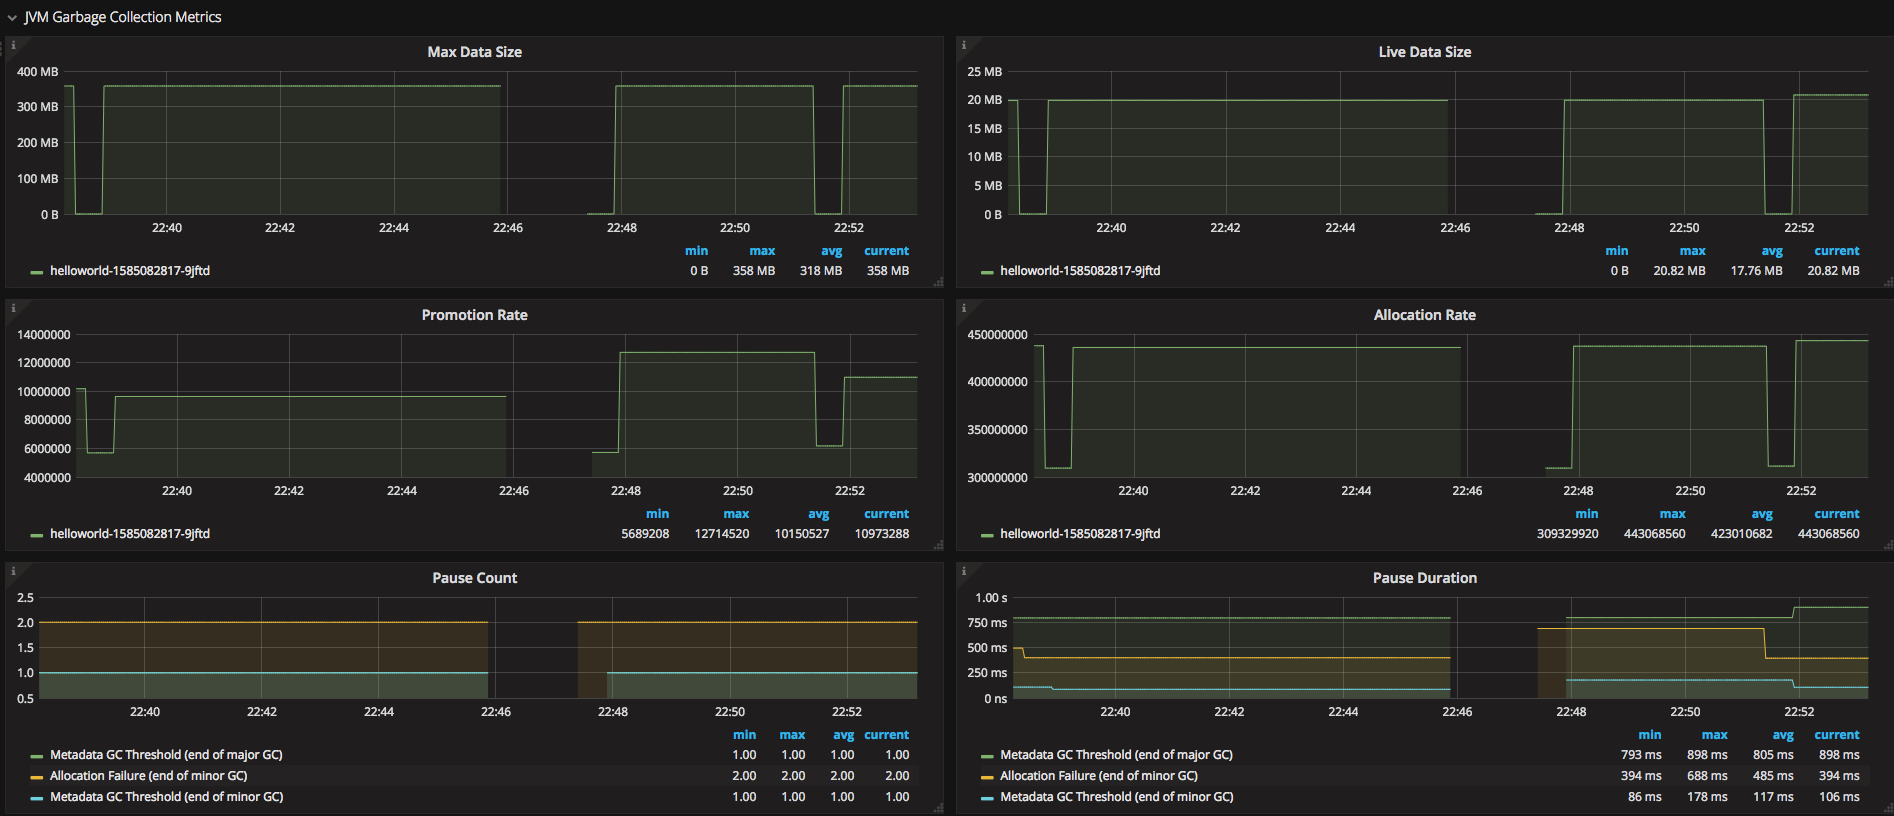
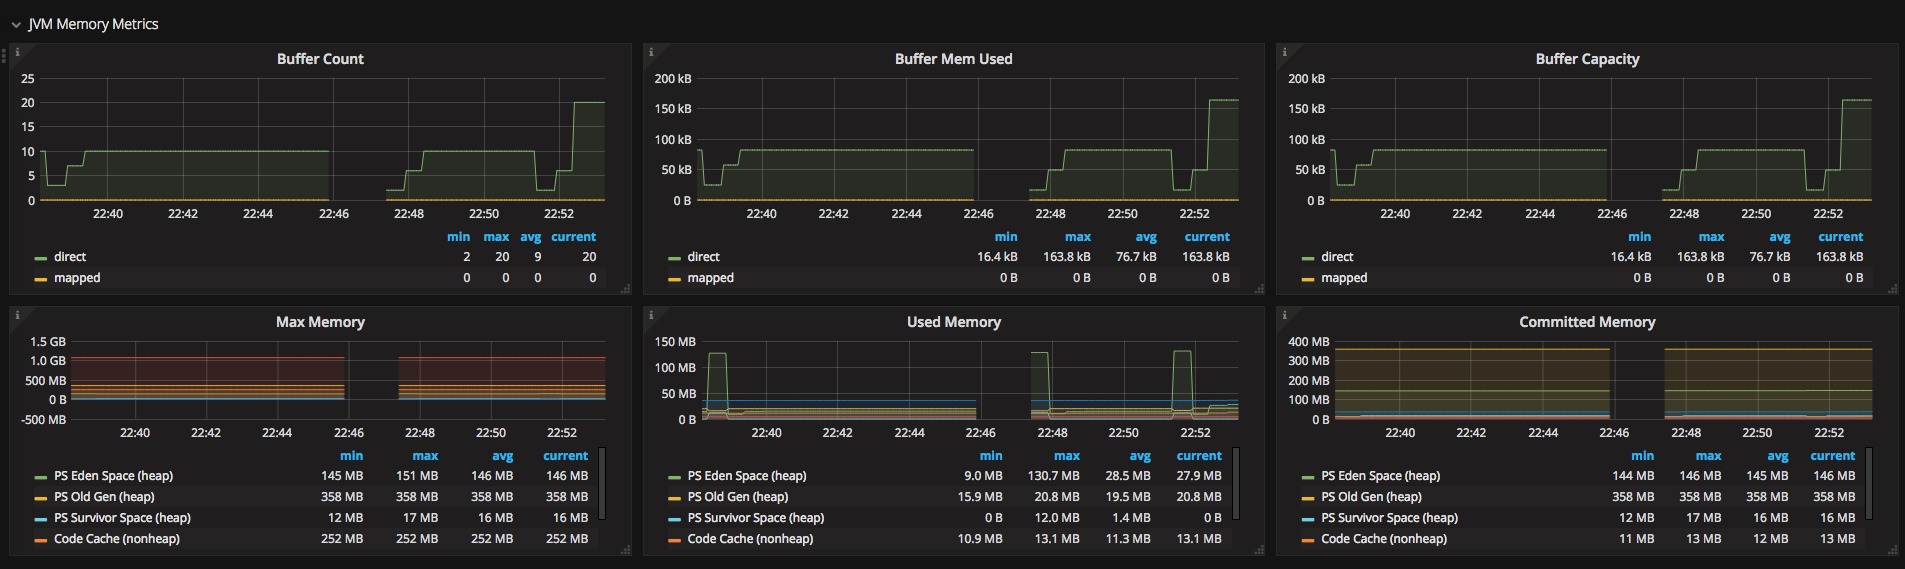
- JVM Thread, Memory and Garbage Collection metrics
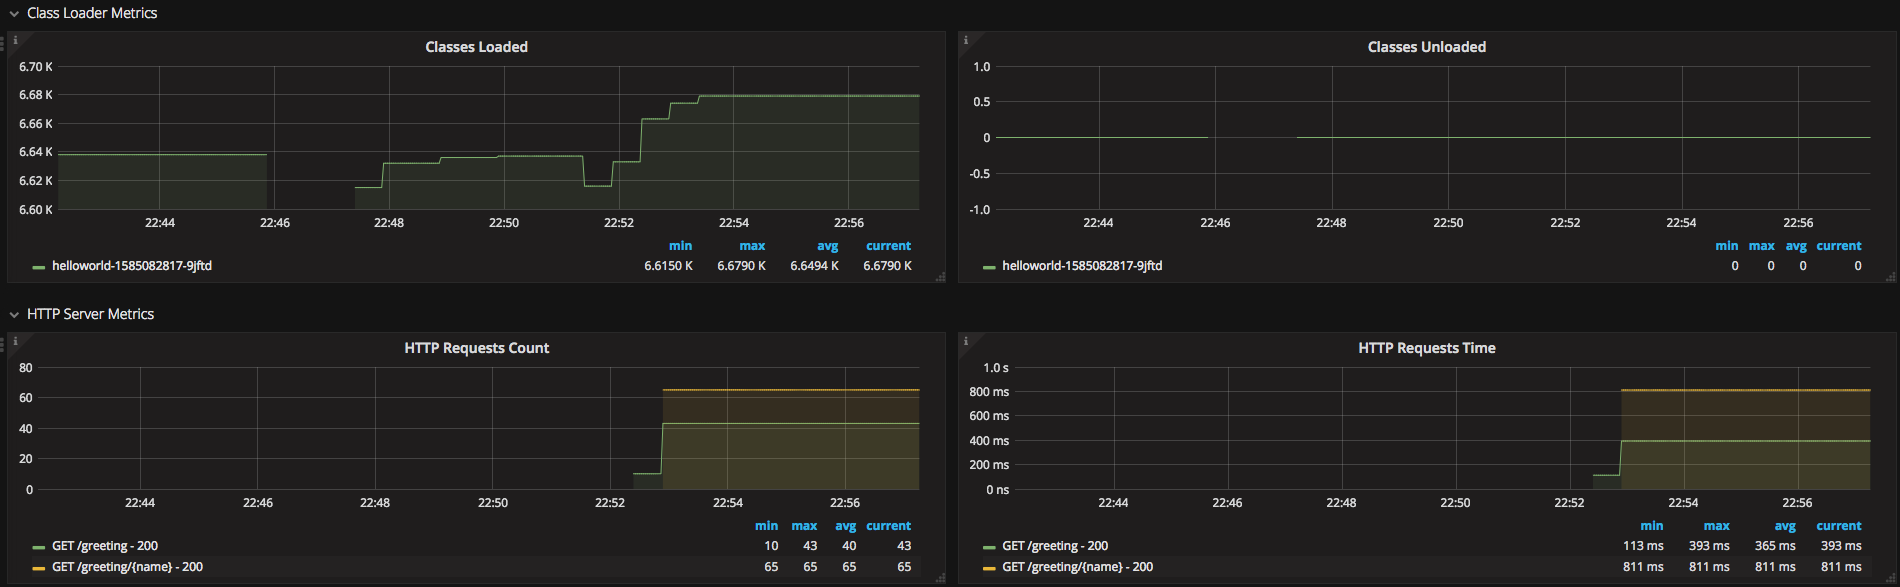
- Class Loader metrics
- HTTP Server metrics
More information on Micrometer can be found at http://micrometer.io/docs/prometheus
Data source config
Collector type:
Collector plugins:
Collector config:
Revisions
Upload an updated version of an exported dashboard.json file from Grafana
| Revision | Description | Created | |
|---|---|---|---|
| Download |
Java Virtual Machine (JVM)
Easily monitor a Java virtual machine, which allows computers to run Java programs, with Grafana Cloud's out-of-the-box monitoring solution.
Learn more