Generic Node
Dashboard to get an overview of one Linux server.
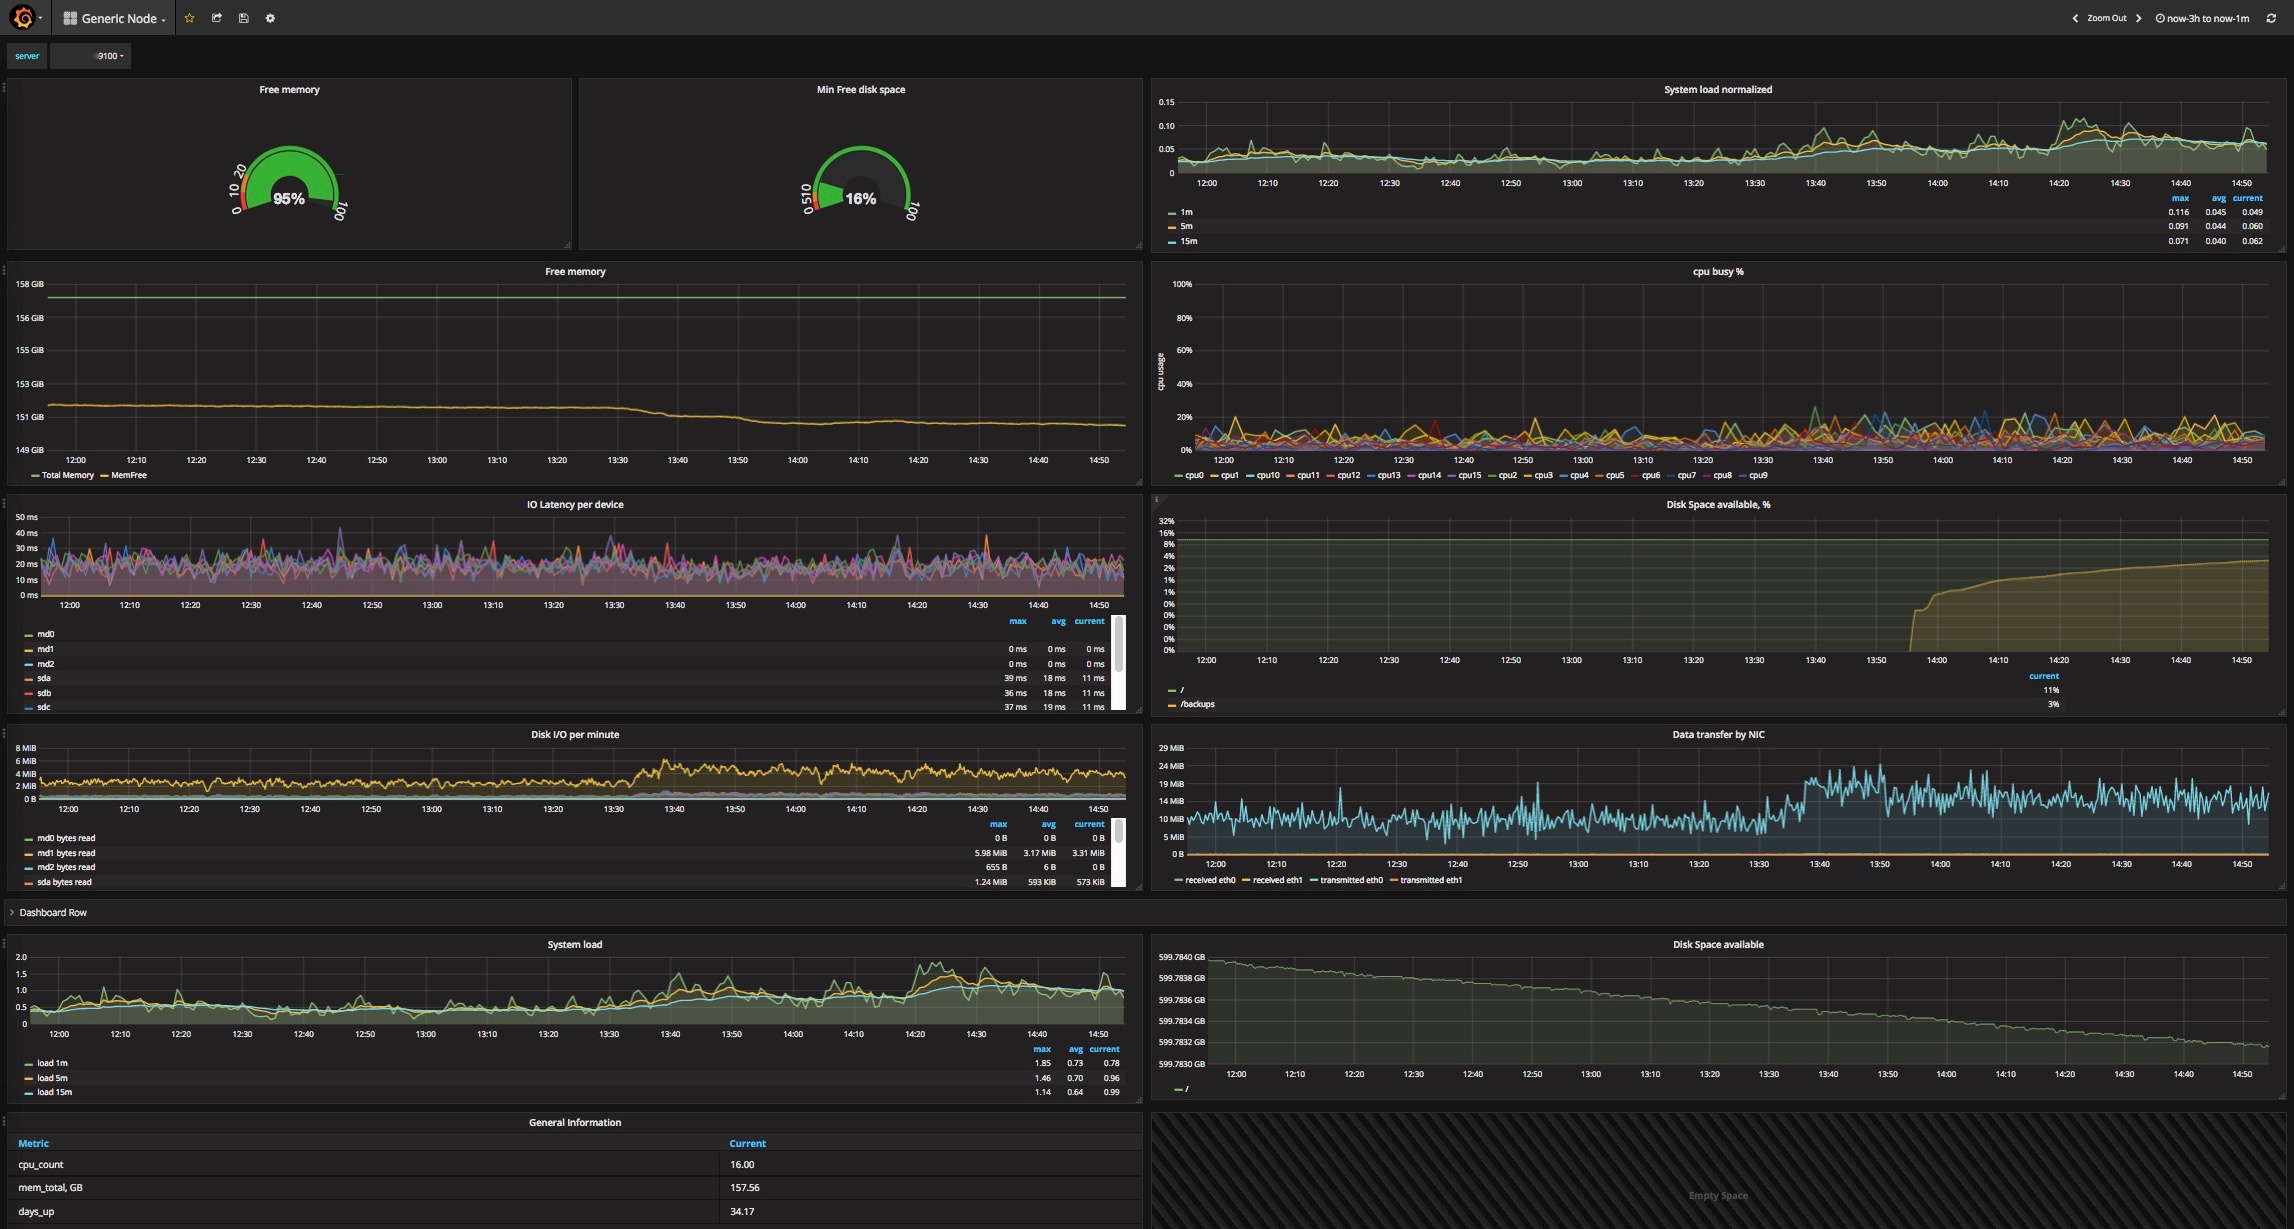
- The dashboard assumes that the node_exporter job is called db_nodes. Replace it for your needs. A metric node_filesystem_avail is calculated by Prometheus rule. Save this to a file /etc/prometheus/rules/compute_metrics.rules on your Prometheus server:
node::node_filesystem_avail::percent= round(100*(min by (job,instance,mountpoint,fstype) (node_filesystem_avail{fstype !~ "rpc_pipefs|rootfs|tmpfs",device!="/etc/auto.misc",mountpoint !~ "/boot|/net|/selinux"}/node_filesystem_size{fstype !~ "rpc_pipefs|rootfs|tmpfs",device!="/etc/auto.misc",mountpoint !~ "/boot|/net|/selinux"})),0.01)
- "System load normalized" chart shows system load divided by number of CPU cores
Data source config
Collector type:
Collector plugins:
Collector config:
Revisions
Upload an updated version of an exported dashboard.json file from Grafana
| Revision | Description | Created | |
|---|---|---|---|
| Download |
Linux Server
Monitor Linux with Grafana. Easily monitor your Linux deployment with Grafana Cloud's out-of-the-box monitoring solution.
Learn more