
Kubernetes Calico
Calico cluster monitoring dashboard

A dashboard to show Calico Felix metrics. The metrics displayed are:
- Active Local Endpoints
- Active Local Policies
- Active Local Selectors
- Active Local Tags
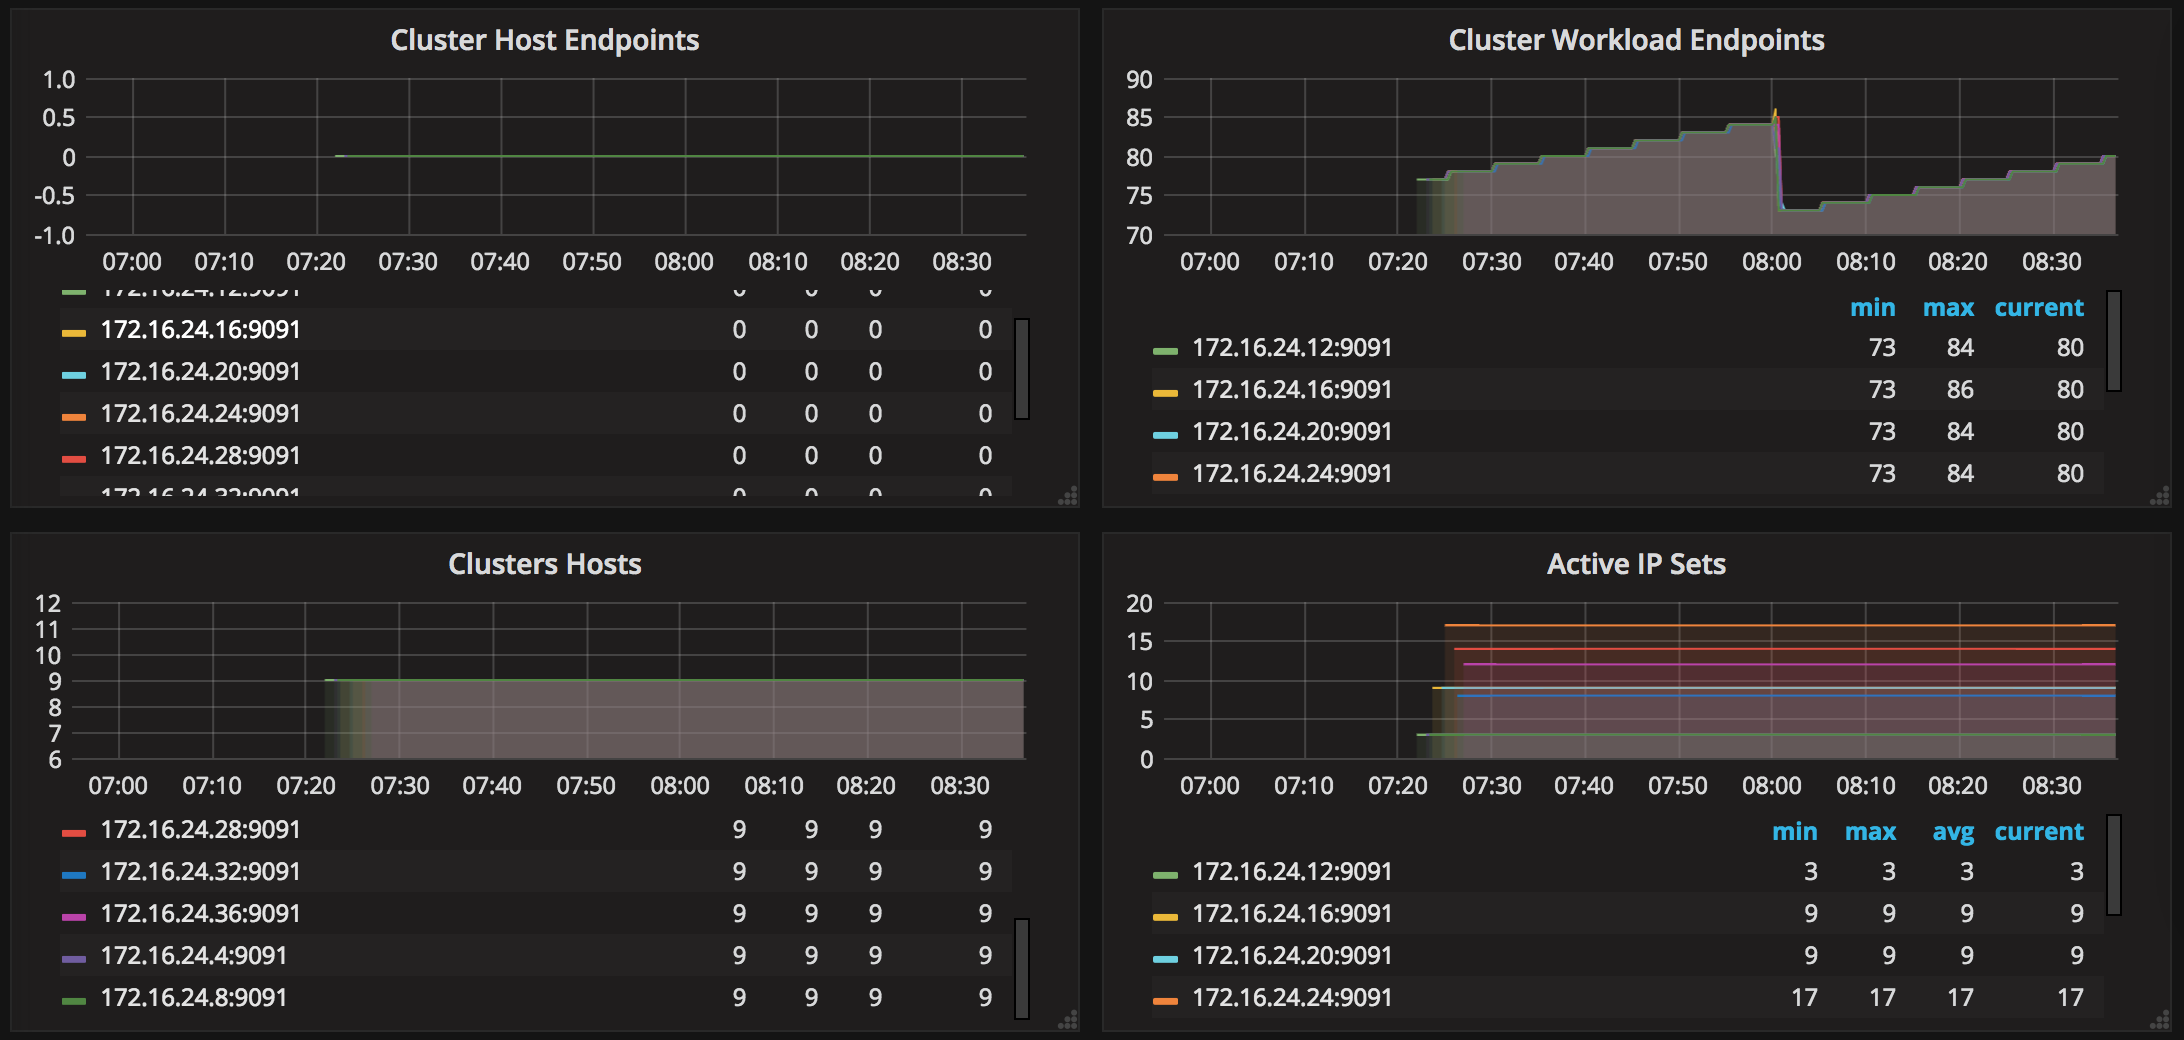
- Cluster Host Endpoints
- Cluster Workload Endpoints
- Cluster Hosts
- Active IP Sets
- Active IP Table Chains
- Active IP Set Command Failures
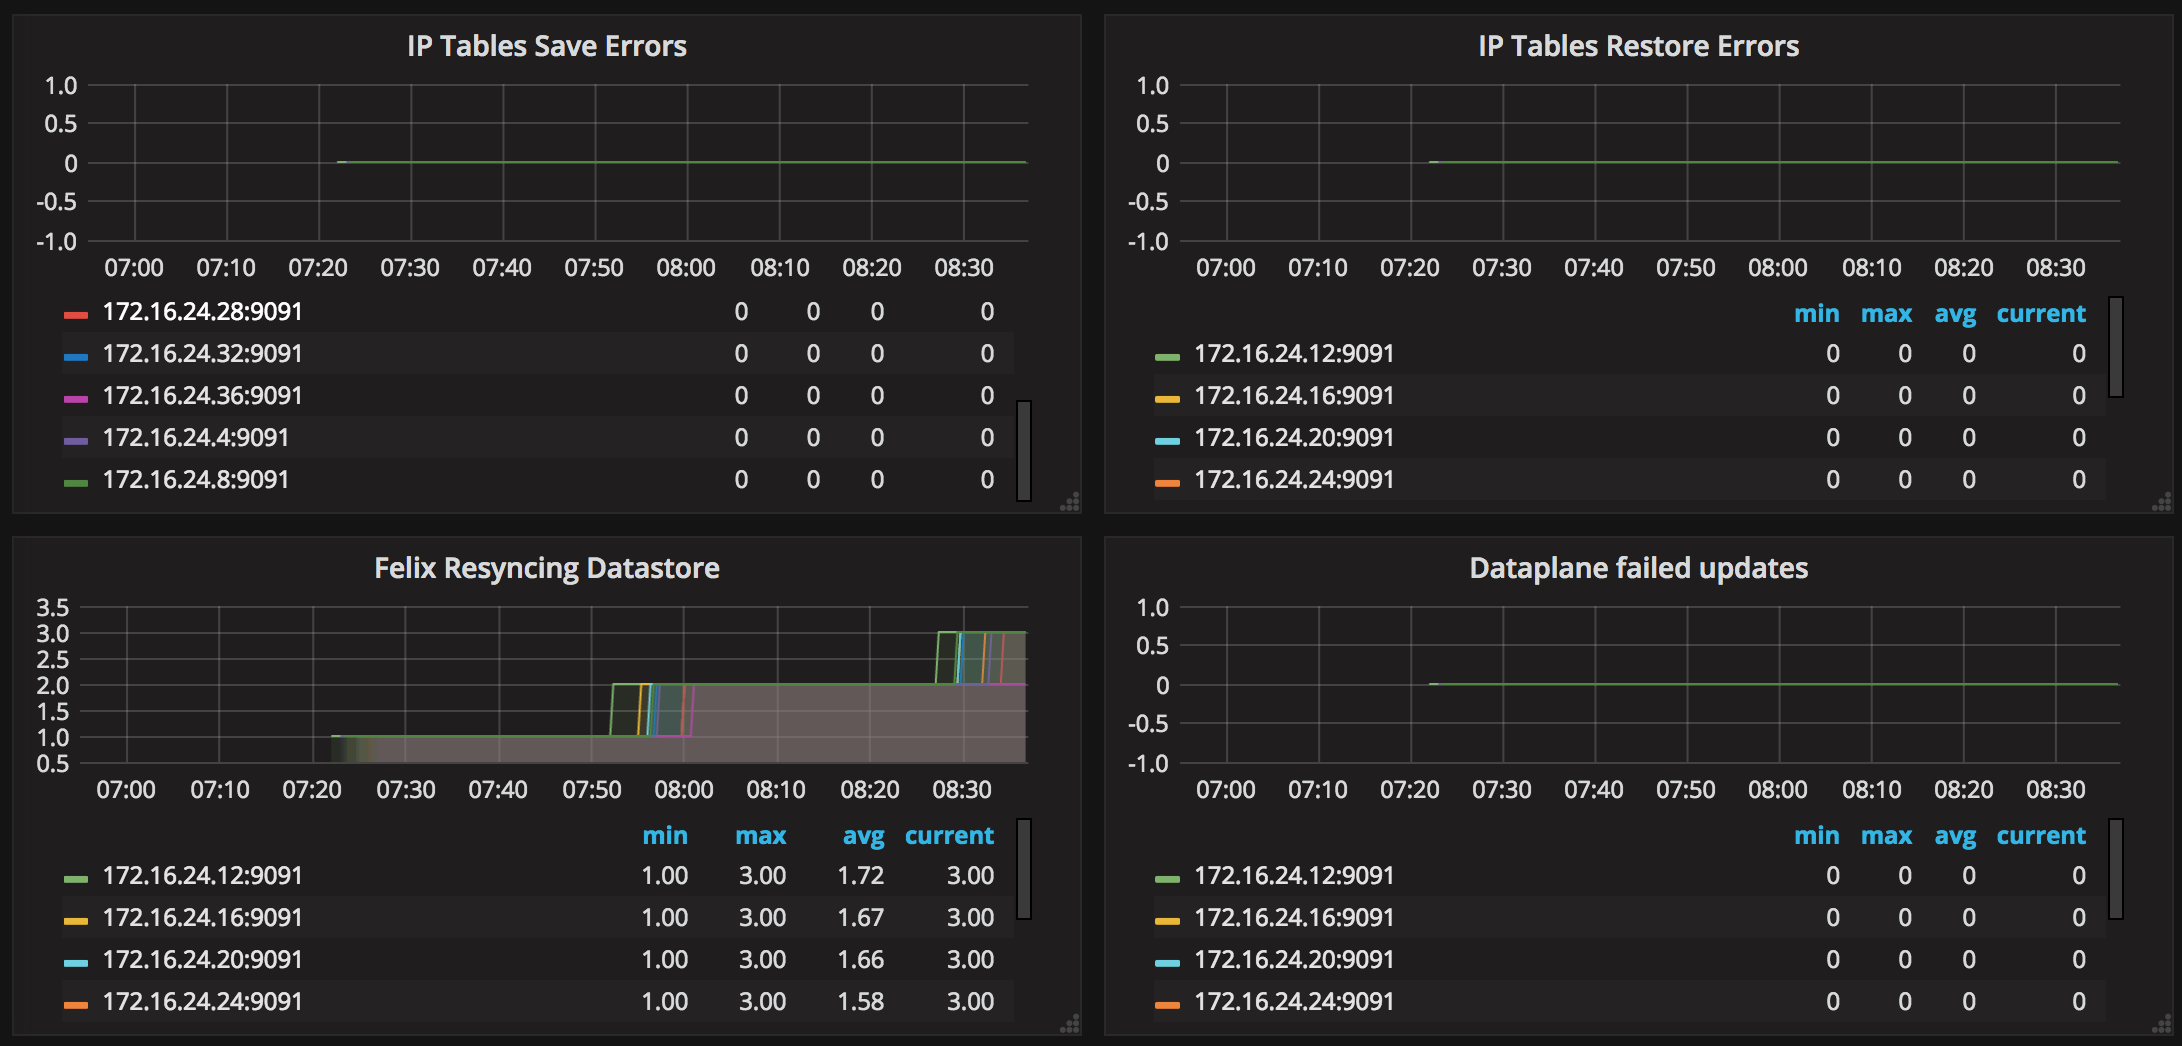
- IP Tables Save Errors
- IP Tables Restore Errors
- Felix Resyncing Datastore
- Dataplane Failed Updates
Data source config
Collector type:
Collector plugins:
Collector config:
Revisions
Upload an updated version of an exported dashboard.json file from Grafana
| Revision | Description | Created | |
|---|---|---|---|
| Download |
Kubernetes
Monitor your Kubernetes deployment with prebuilt visualizations that allow you to drill down from a high-level cluster overview to pod-specific details in minutes.
Learn more