Docker monitoring - alicek106 revision
Docker monitoring with Prometheus and cAdvisor
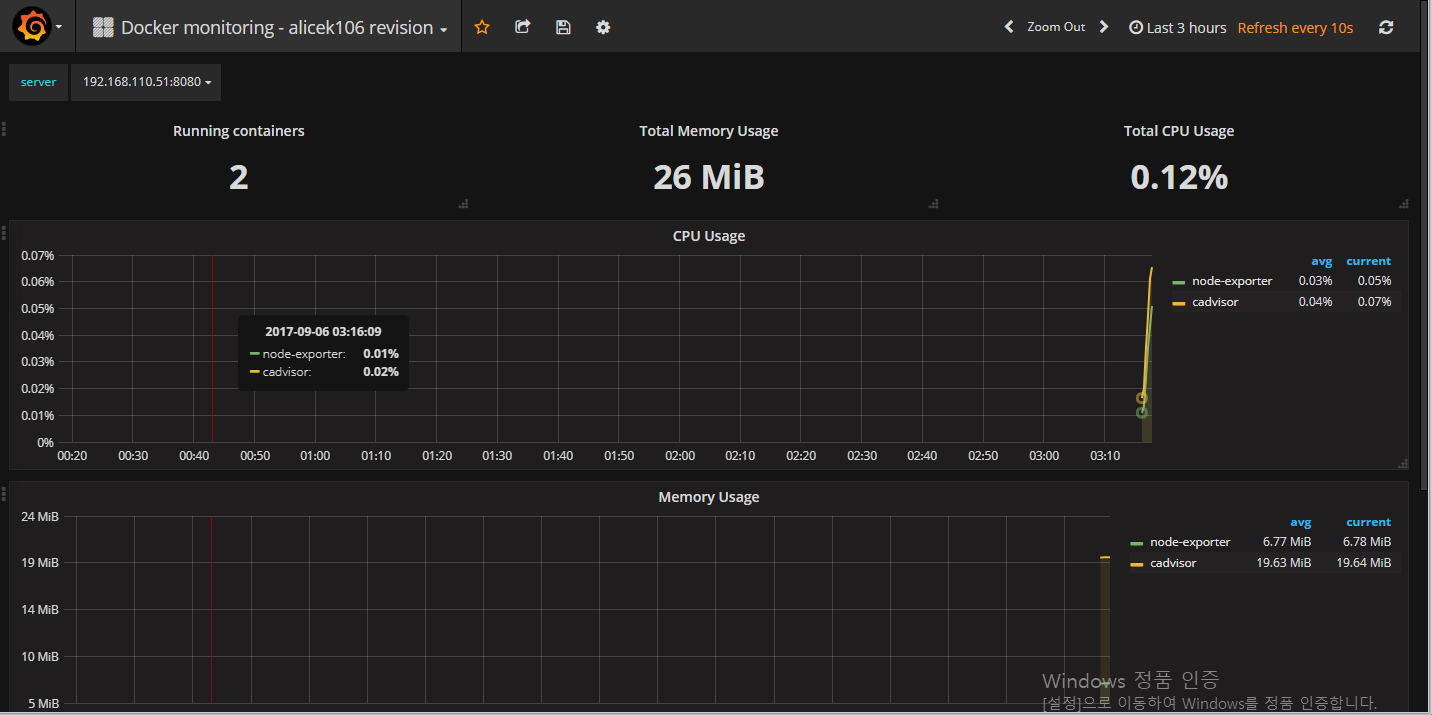
Based on https://grafana.com/dashboards/193, I revised some queries.
-> Select server and update graph to corresponding server. Except it, everything is same.
Data source config
Collector type:
Collector plugins:
Collector config:
Revisions
Upload an updated version of an exported dashboard.json file from Grafana
| Revision | Description | Created | |
|---|---|---|---|
| Download |
Docker
Easily monitor Docker with Grafana Cloud's out-of-the-box monitoring solution.
Learn more