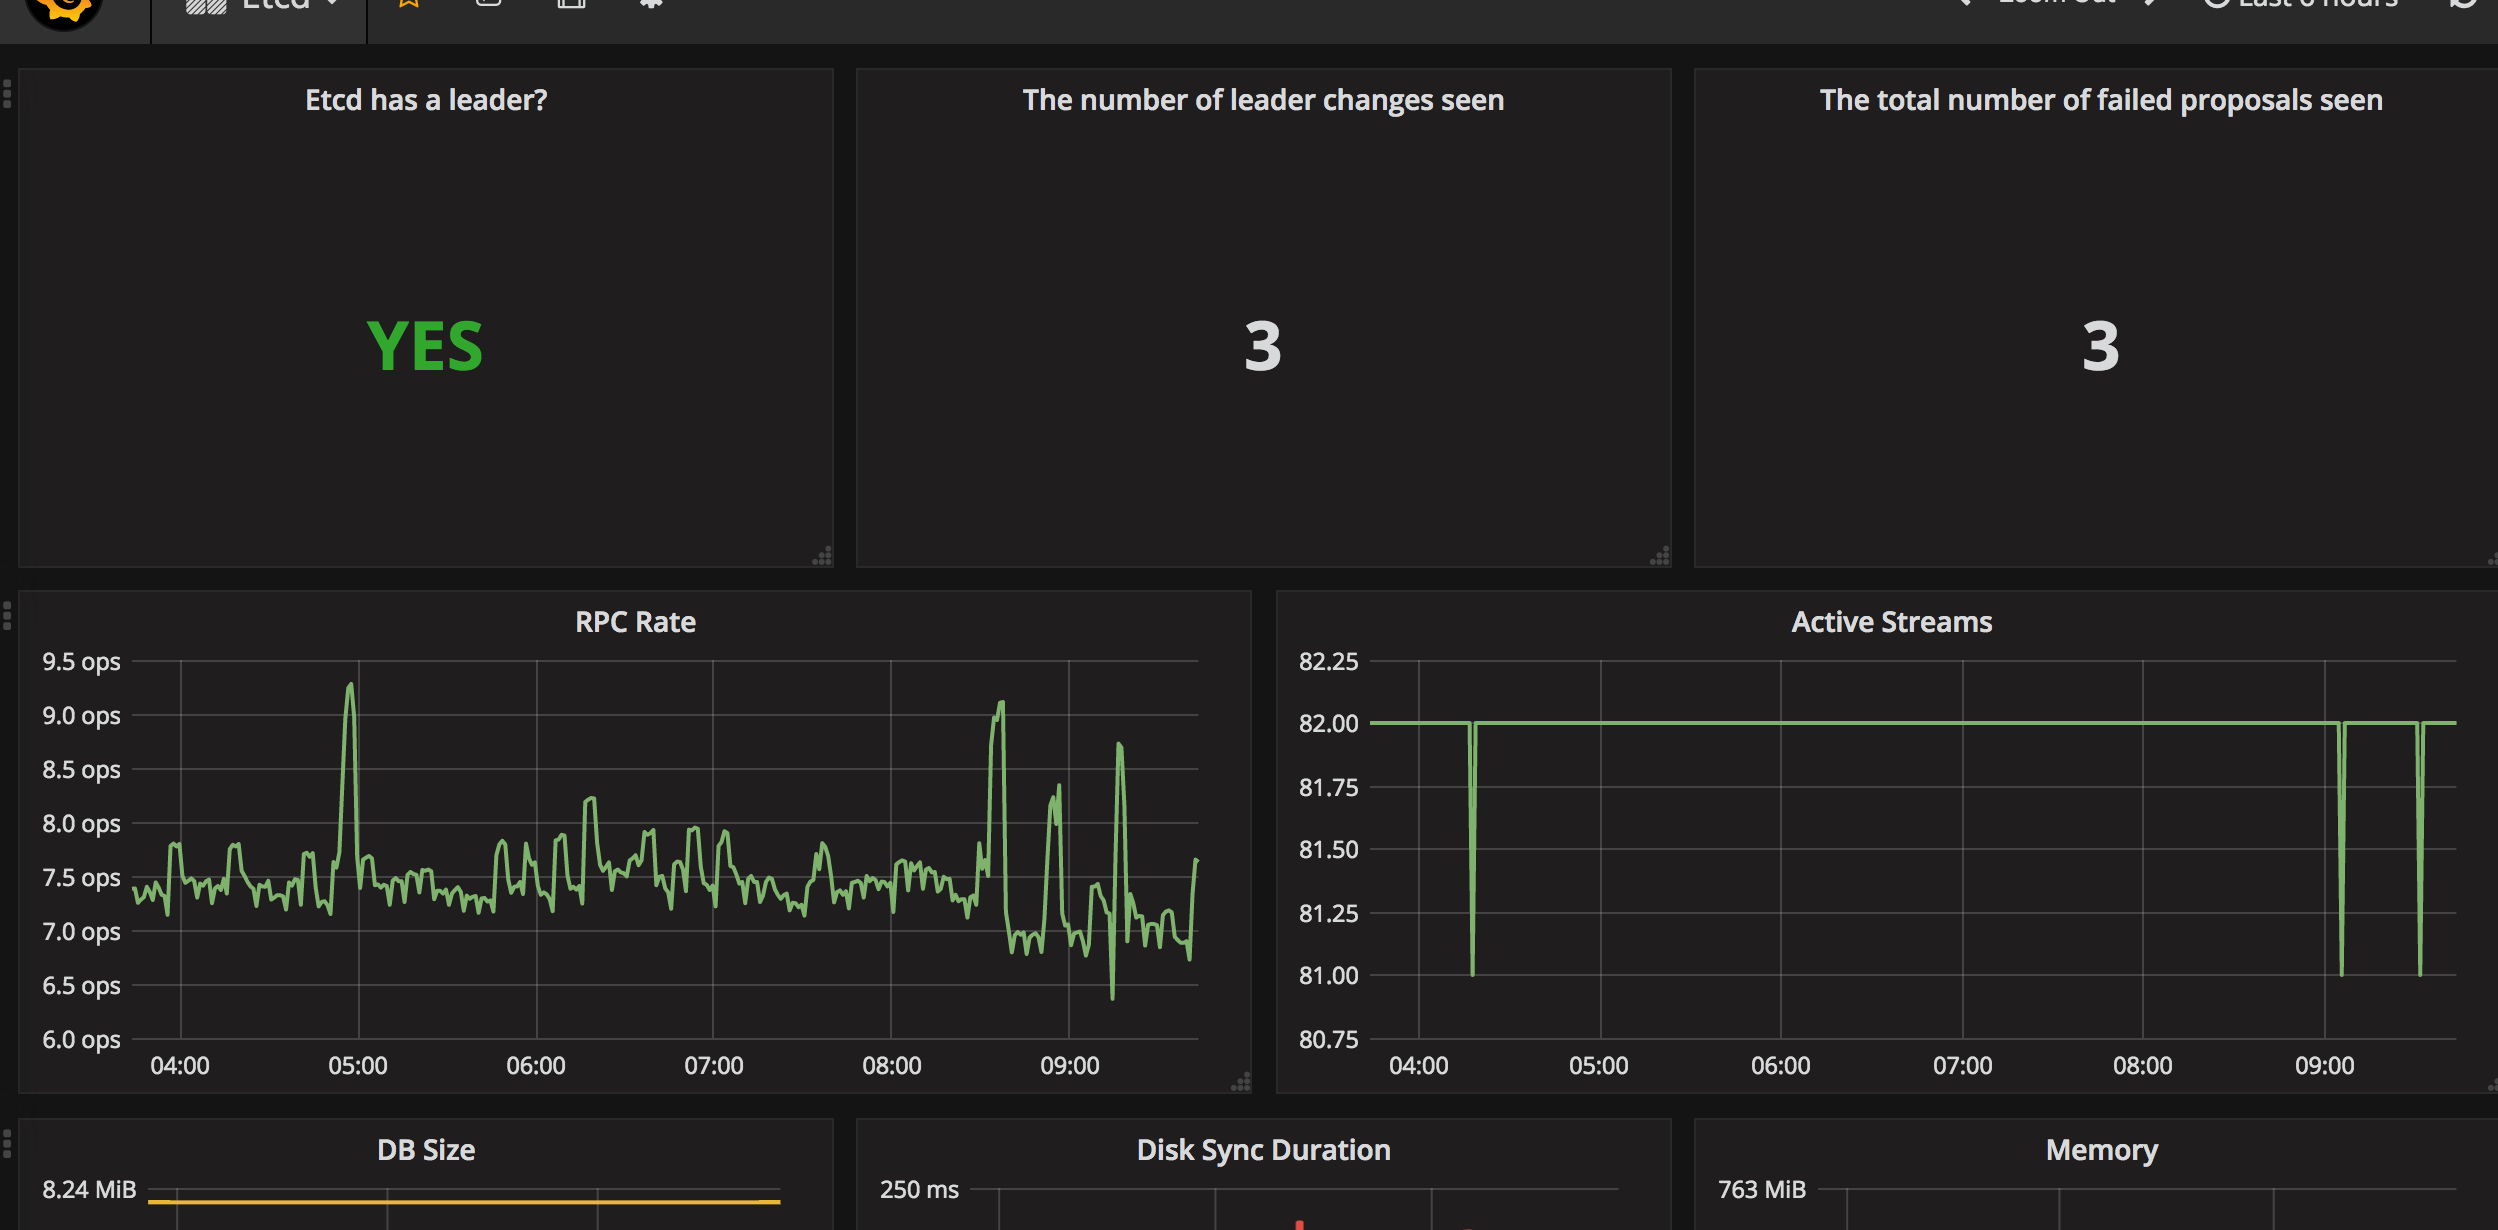
Etcd by Prometheus
Etcd Dashboard for Prometheus metrics scraper
Tested with:
- kube-aws 0.9.7
- Kubernetes 1.6
- Prometheus Operator 0.11.1
- Prometheus 1.7.0
The Etcd cluster is running outside of Kubernetes on EC2 instances. I've used Prometheus Operator ServiceMonitor to scrape the data.
Inspired from:
CoreOs Etcd metrics doc: https://coreos.com/etcd/docs/latest/metrics.html
https://github.com/lwolf/kube-monitoring/blob/master/dashboards/etcd-overview.json
Please contribute, comment, feedback, suggestions here: https://github.com/VinceMD/Grafana-Dashboards/blob/master/etcd-prometheus-dashboard.json
Data source config
Collector type:
Collector plugins:
Collector config:
Revisions
Upload an updated version of an exported dashboard.json file from Grafana
| Revision | Description | Created | |
|---|---|---|---|
| Download |
etcd
Easily monitor etcd, a distributed key-value store, ewith Grafana Cloud's out-of-the-box monitoring solution.
Learn more