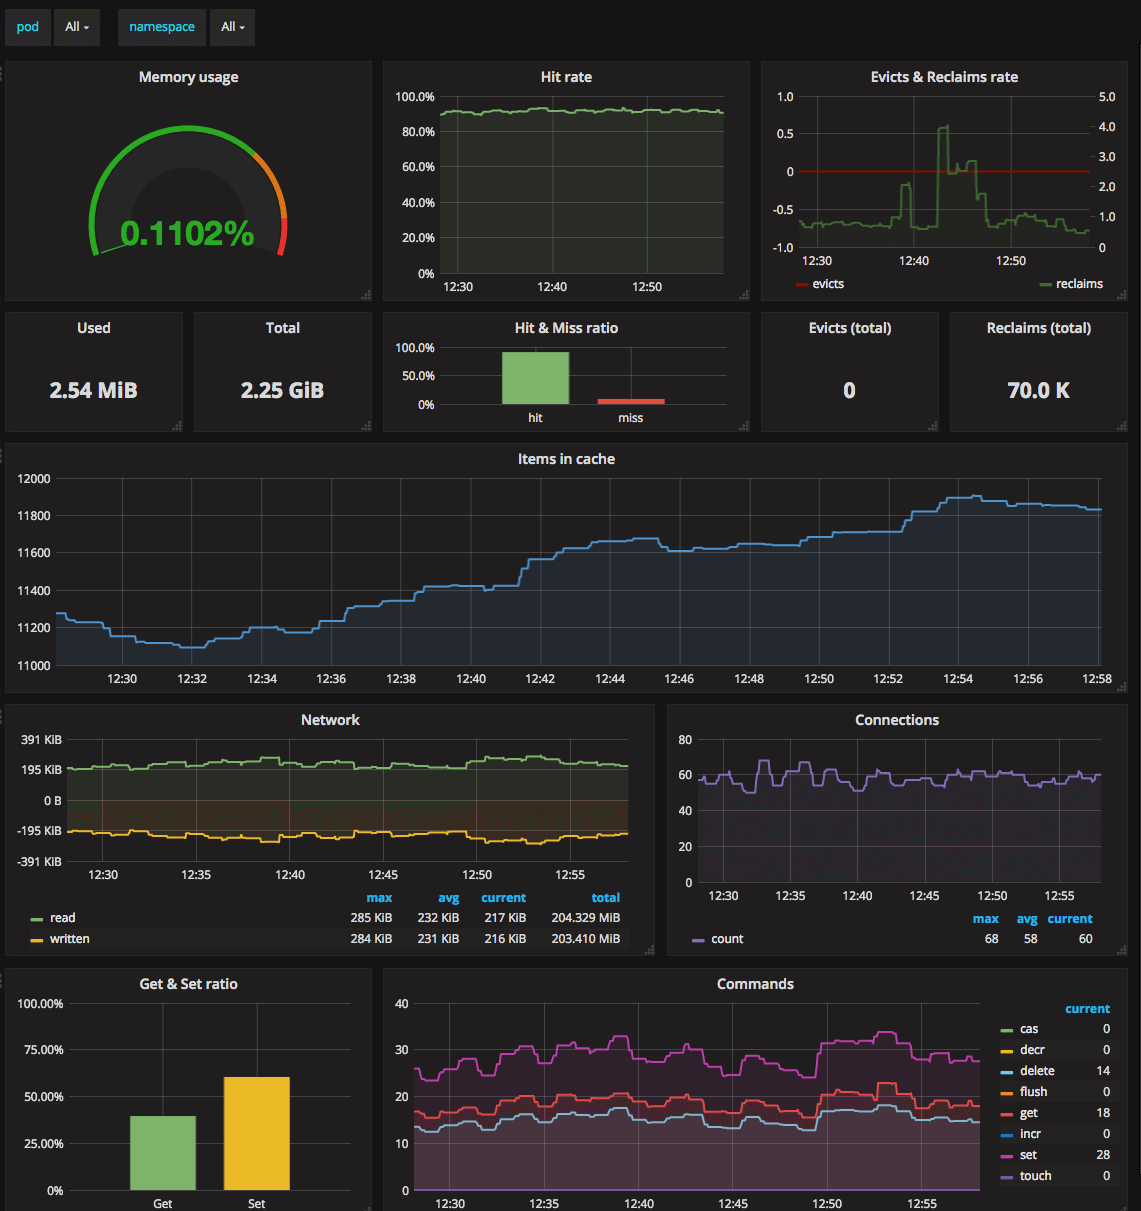
Memcached Pods monitoring (via Prometheus)
Monitors Kubernetes Memcached Pods. Shows memory usage, hit rate, evicts and reclaims rate, items in cache, network stats, commands rate. Requires Memcached Exporter for Prometheus.
Metrics
- Memory usage
- Hit & Miss ratio
- Evicts & Reclaims
- Items in cache
- Network stats
- Commands usage
Requirements
- Kubernetes cluster with deployed Prometheus and Grafana.
- Memcached Exporter deployed alongside with Memcached Pod.
Your Prometheus configuration should contain the following scrape_config:
scrape_configs:
  - job_name: kubernetes-pods
    kubernetes_sd_configs:
      - role: pod
    relabel_configs:
      - source_labels: [__meta_kubernetes_pod_annotation_prometheus_io_scrape]
        action: keep
        regex: true
      - source_labels: [__meta_kubernetes_pod_annotation_prometheus_io_path]
        action: replace
        target_label: __metrics_path__
        regex: (.+)
      - source_labels: [__address__, __meta_kubernetes_pod_annotation_prometheus_io_port]
        action: replace
        regex: ([^:]+)(?::\d+)?;(\d+)
        replacement: $1:$2
        target_label: __address__
      - action: labelmap
        regex: __meta_kubernetes_pod_label_(.+)
      - source_labels: [__meta_kubernetes_namespace]
        action: replace
        target_label: kubernetes_namespace
      - source_labels: [__meta_kubernetes_pod_name]
        action: replace
        target_label: kubernetes_pod_name
Your Memcached Pod should contain prometheus.io/* annotations:
kind: StatefulSet
apiVersion: apps/v1beta1
metadata:
  name: my-memcached
spec:
  serviceName: my-memcached
  replicas: 1
  template:
    metadata:
      annotations:
        prometheus.io/scrape: 'true'
        prometheus.io/port: '9150'
    spec:
      containers:
        - name: memcached
          image: memcached:alpine
          ports:
            - name: memcache
              containerPort: 11211
        - name: metrics
          image: quay.io/prometheus/memcached-exporter:v0.3.0
          ports:
            - name: metrics
              containerPort: 9150
Issues
If you have any problems with or questions about this dashboard, please contact us through a GitHub issue.
Data source config
Collector type:
Collector plugins:
Collector config:
Revisions
Upload an updated version of an exported dashboard.json file from Grafana
| Revision | Description | Created | |
|---|---|---|---|
| Download |
Memcached
Easily monitor Memcached, the distributed, in-memory key-value store, with Grafana Cloud's out-of-the-box monitoring solution.
Learn more