Teamspeak 3 Metrics (InfluxDB)
Visualize collected metrics of all virtual server instances of a single Teamspeak 3 server using InfluxDB and Telegraf in combination with the telegraf-teamspeak3 executable script.
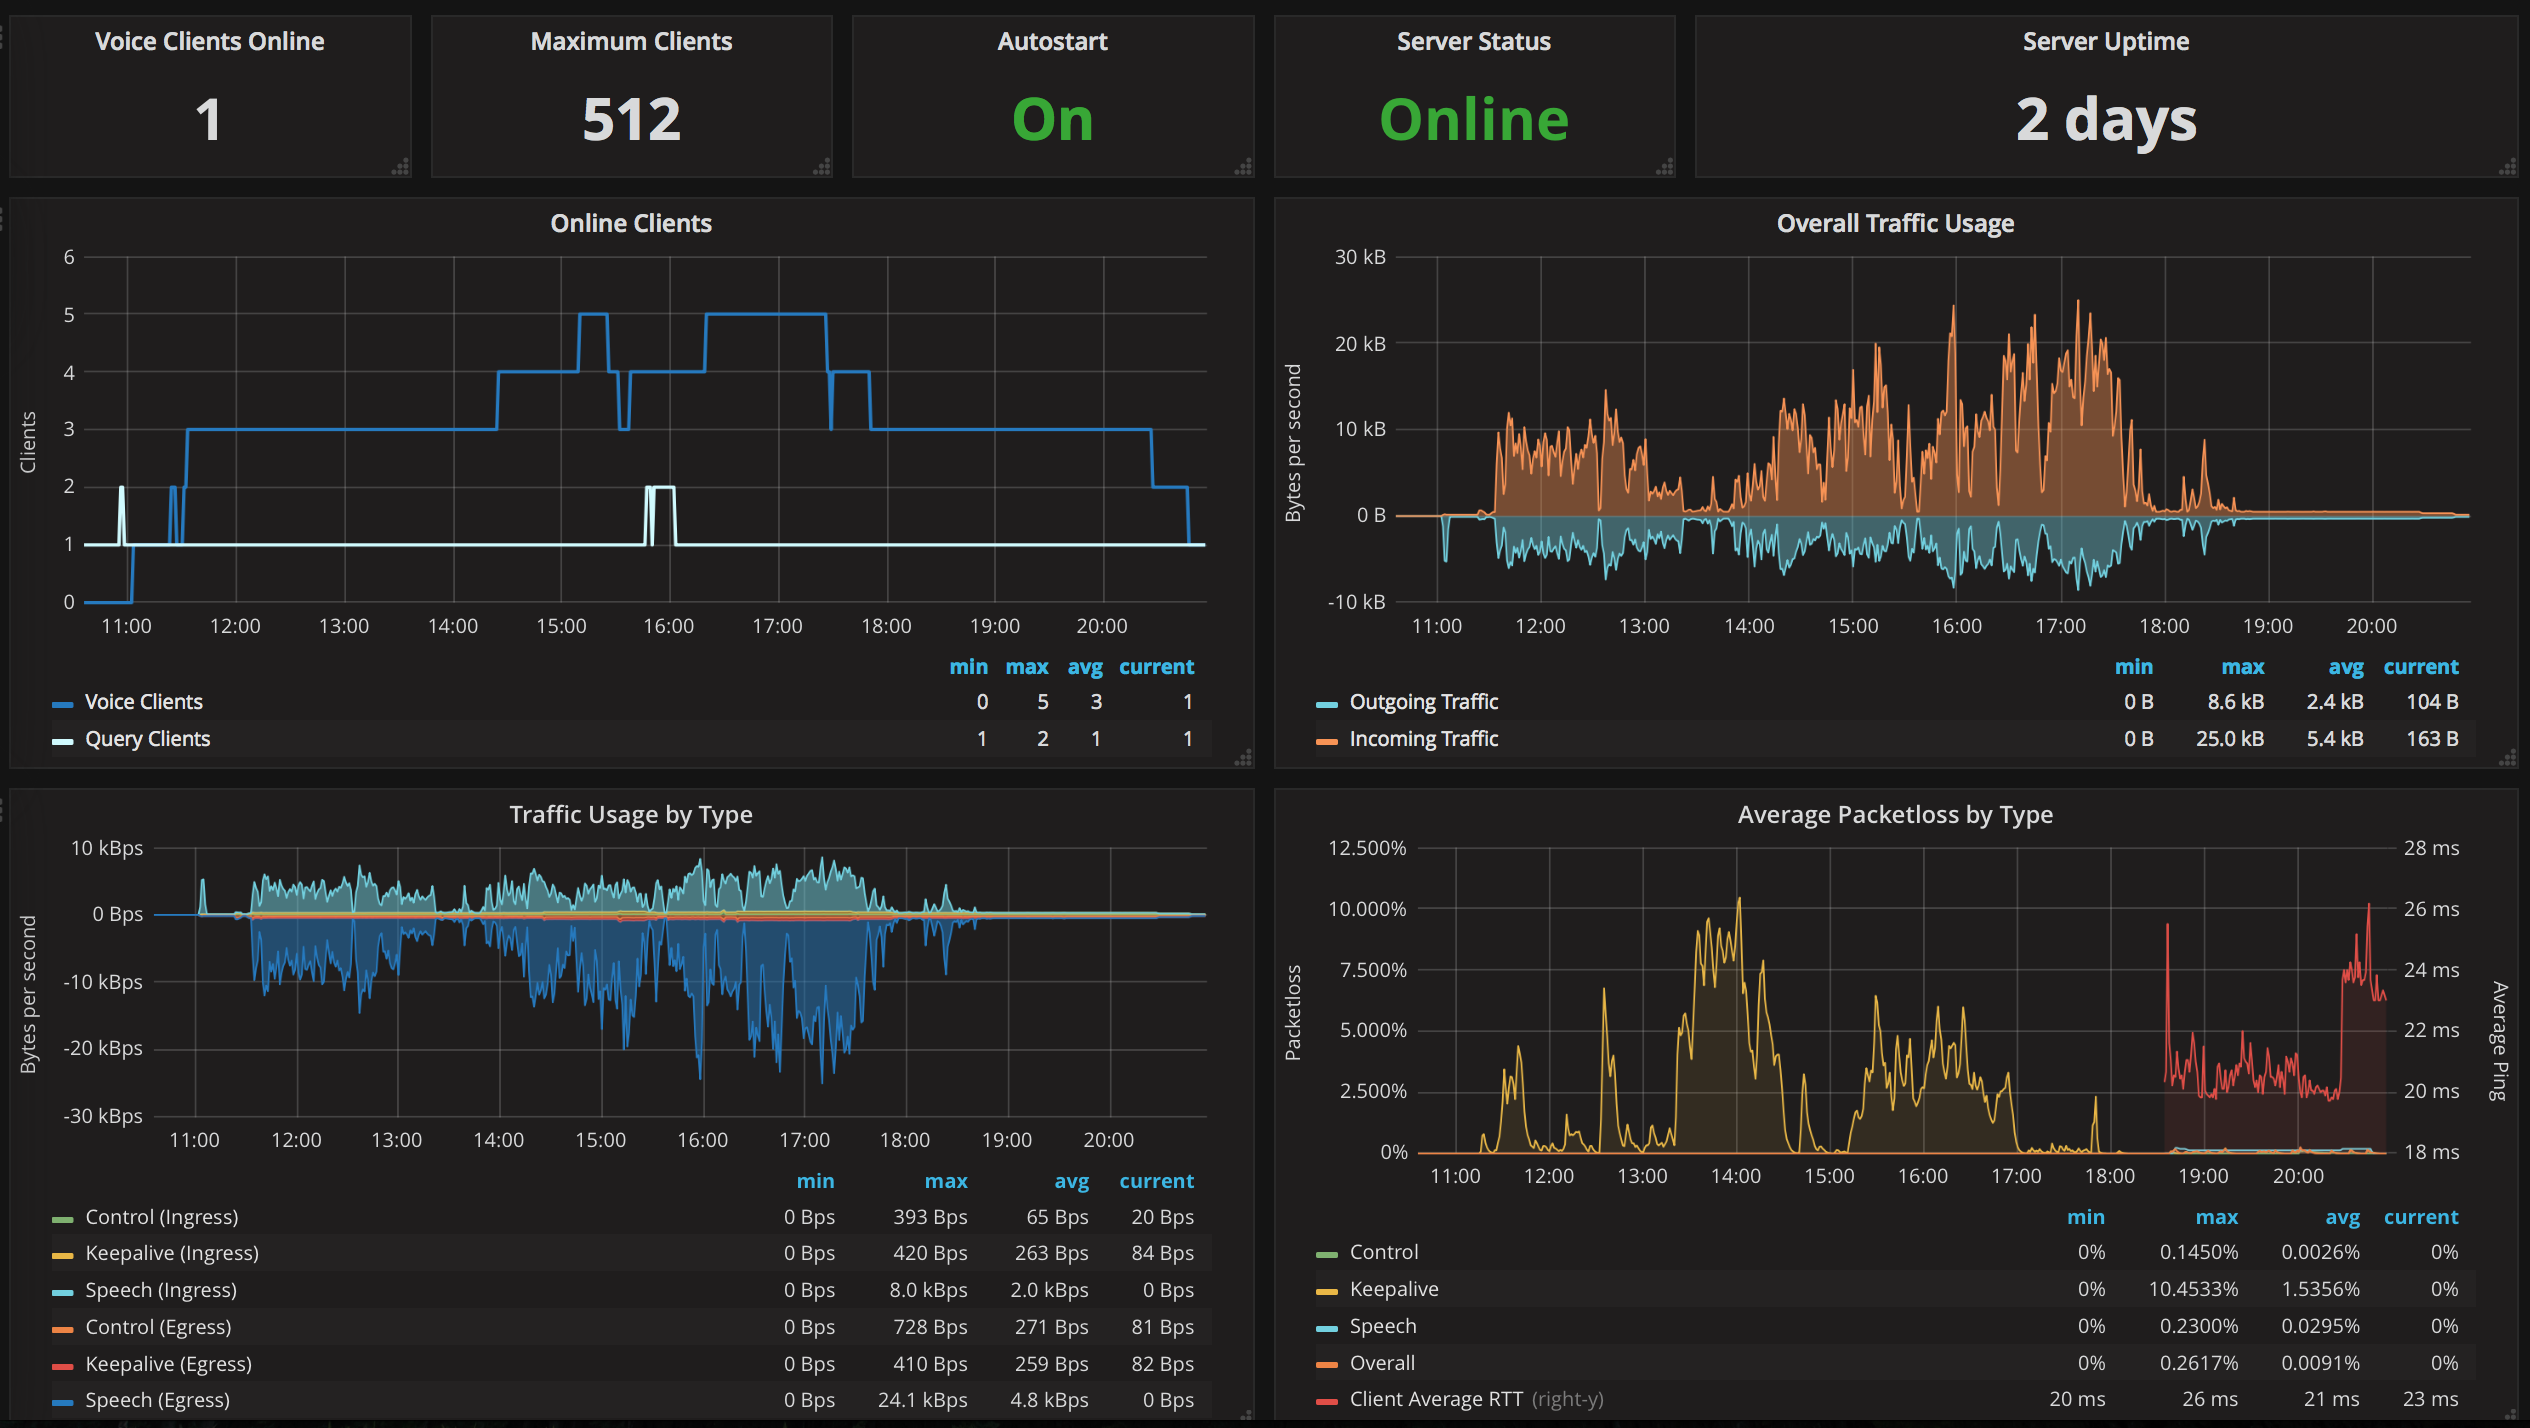
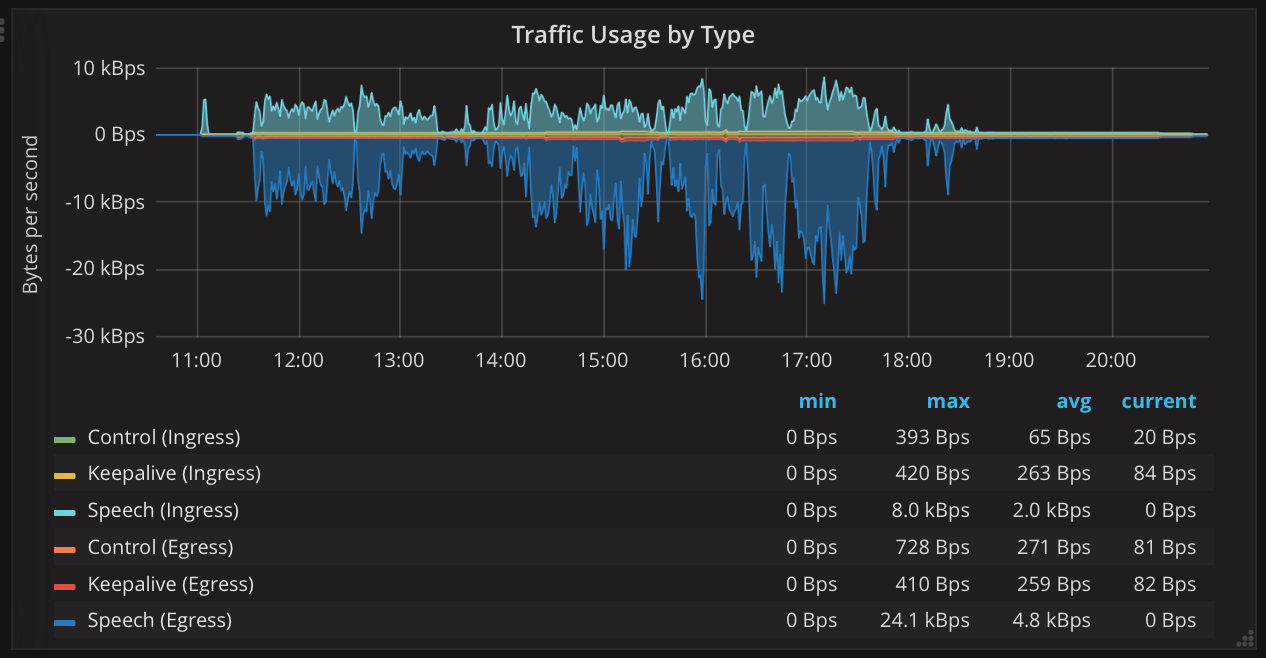
A single Teamspeak 3 server is able to host multiple virtual server instances. Depending on your license (Free, NPL, AHP, etc.) you are allowed to create more than one of those virtual server instance. Keep informed about the clients, bandwidth usage and packetloss using Telegraf and InfluxDB in combination with Grafana to visualize all key metrics of your virtual server(s). The metrics are collected via Teamspeak 3 ServerQuery which is a powerful command line interface to manage and monitor your (virtual) servers.
The necessary Telegraf executable is available on GitHub: https://github.com/thannaske/telegraf-teamspeak3
Data source config
Collector config:
Upload an updated version of an exported dashboard.json file from Grafana
| Revision | Description | Created | |
|---|---|---|---|
| Download |