
System Overview
This Dashboard provides a general overview of a system, with templating to select the datasource and host.
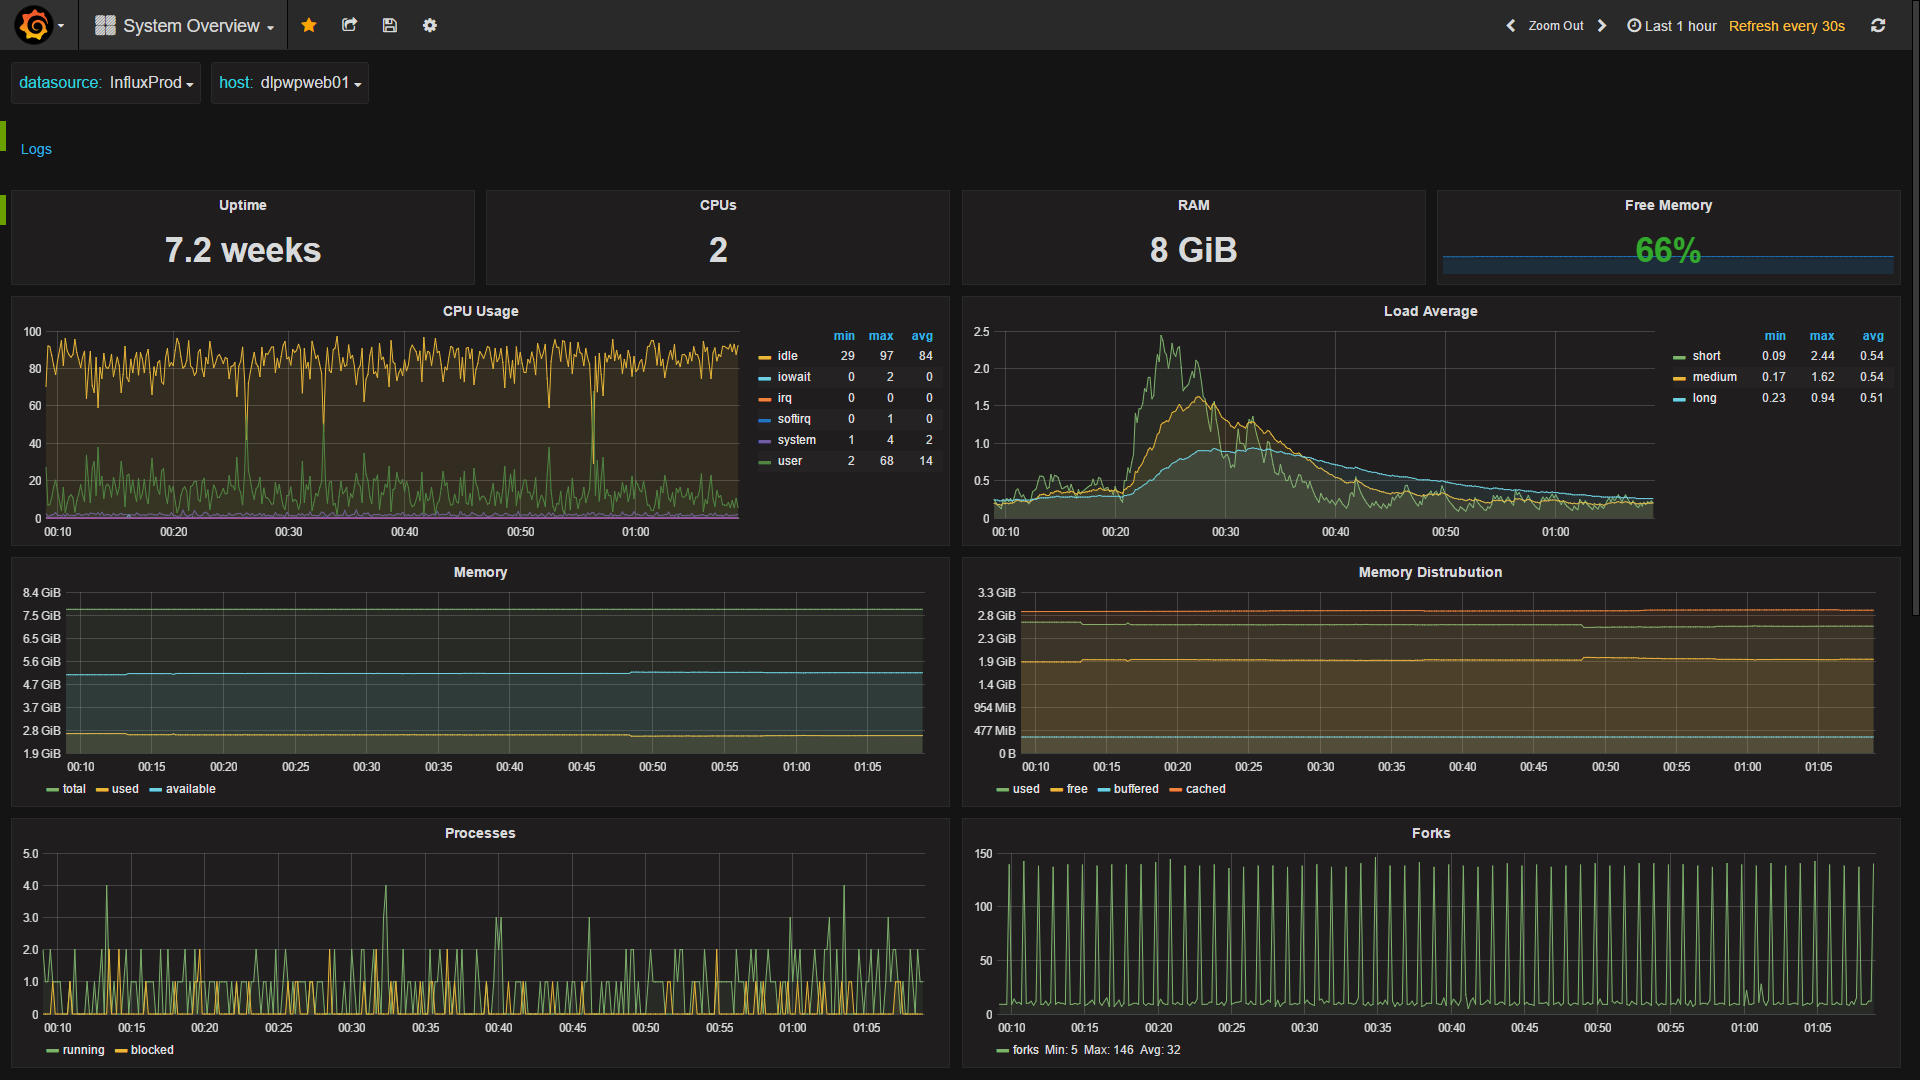
The dashboard provides the following; Single stats for uptime, cpu count, RAM, free memory %
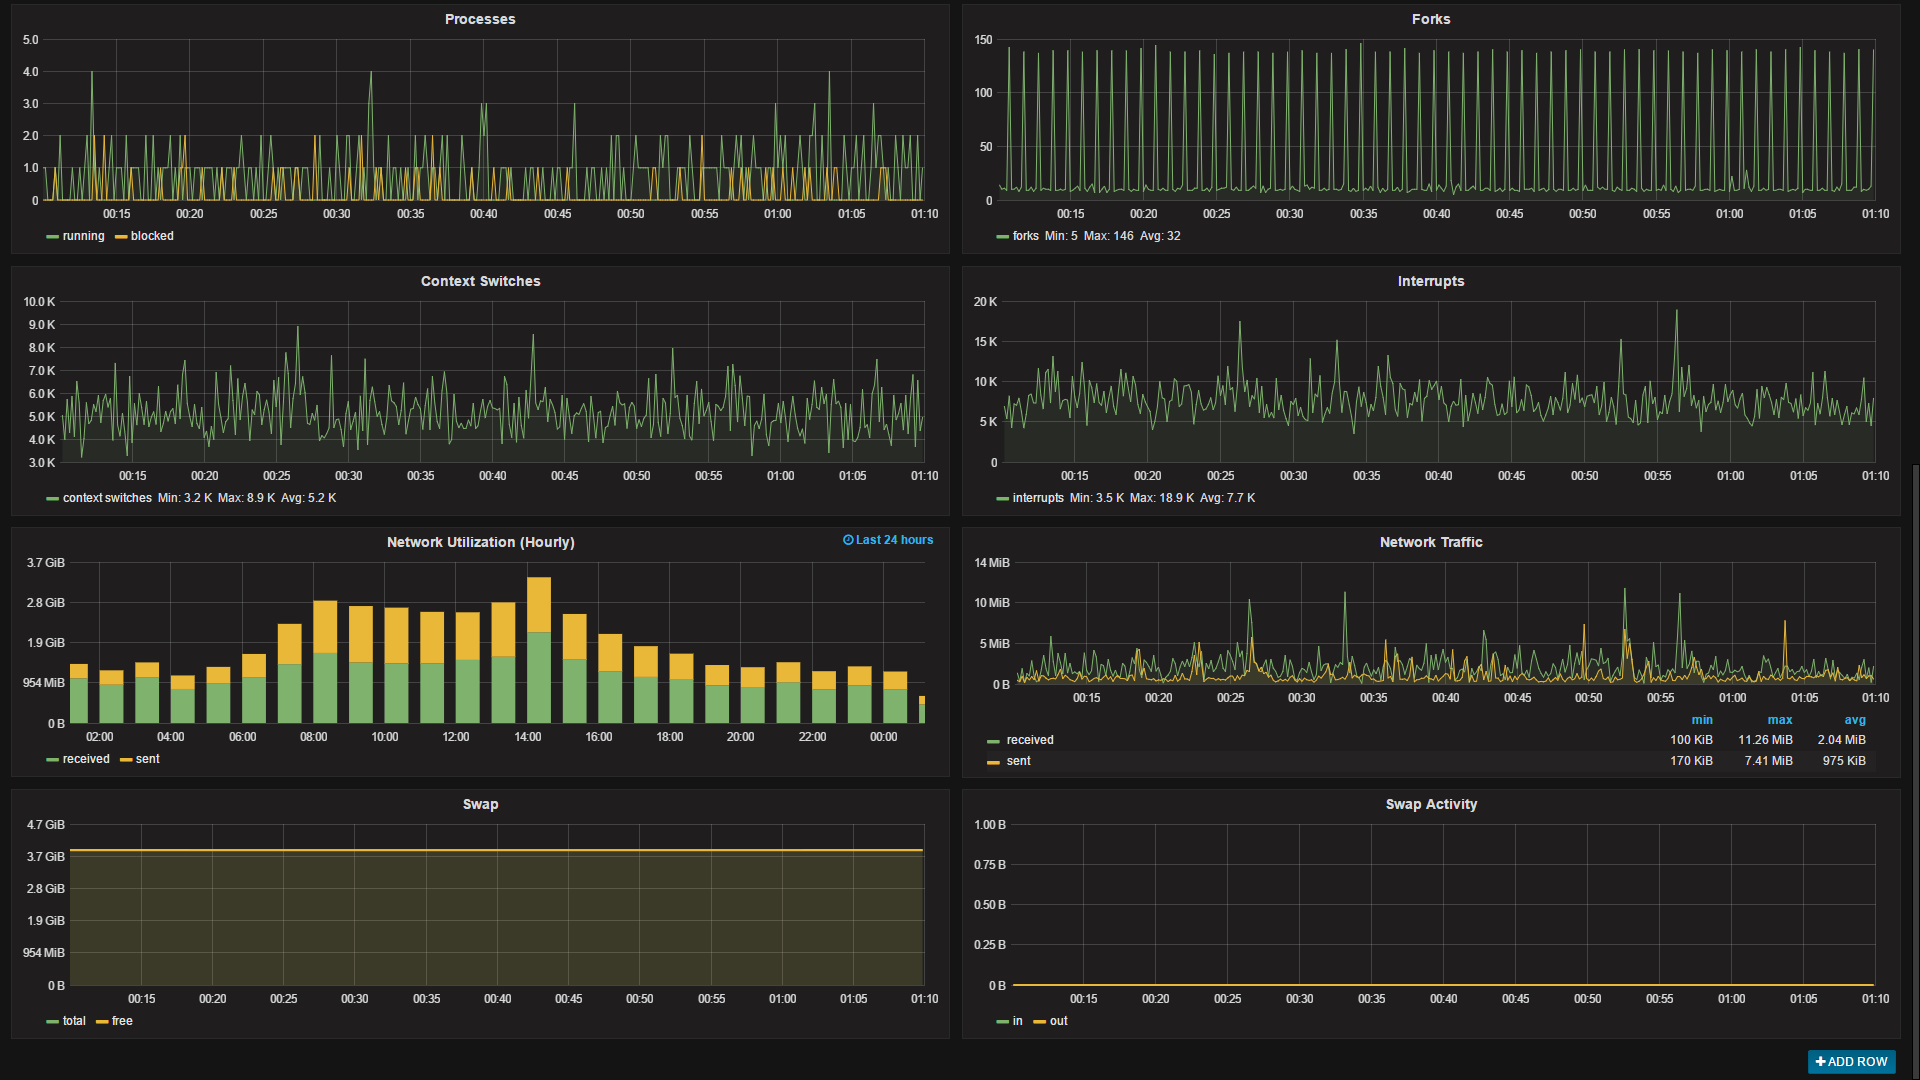
Panels for CPU usage, load, memory use and distribution, processes, forks, context switches and interrupts. Realtime and hourly summary of network bandwidth utiliization, and swap space utilization and activity.
The dashboard utilizes templating to dynamically choose the datasource and host In our usecase we have a different datasource for each of our environments (dev, qa, staging and prod) so being able to easily switch between them is very useful, you could easily remove this option if you have a single data source. The available hosts gets updated when you change data srouces.
The Log link is simply a link to a GrayLog server with the $host variable added to the URL to return all the logs for the host being viewed. The row with the link can safely be removed if you do not have a use for it.
Data source config
Collector config:
Dashboard revisions
Upload an updated version of an exported dashboard.json file from Grafana
| Revision | Decscription | Created | |
|---|---|---|---|
| Download |
Get this dashboard
Data source:
Dependencies: