Nginx VTS Stats
Show stats from the hnlq715/nginx-vts-exporter.
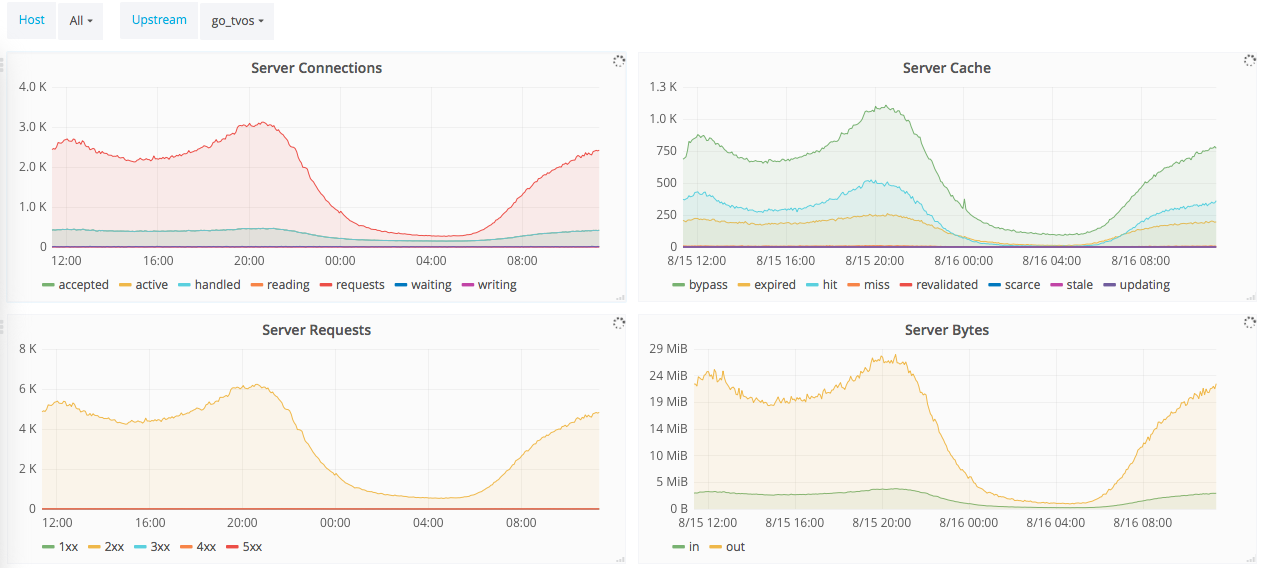
The Nginx VTS Stats dashboard uses the prometheus data source to create a Grafana dashboard with the graph panel.
Data source config
Collector type:
Collector plugins:
Collector config:
Revisions
Upload an updated version of an exported dashboard.json file from Grafana
| Revision | Description | Created | |
|---|---|---|---|
| Download |
NGINX
Easily monitor NGINX, an open source software for web serving, reverse proxying, caching, load balancing, media streaming, and more, with Grafana Cloud's out-of-the-box monitoring solution.
Learn more