
Huginn
Huginn honeypot metrics (https://github.com/ancientswede/Huginn). Counts only, never addresses or anything an attacker typed.
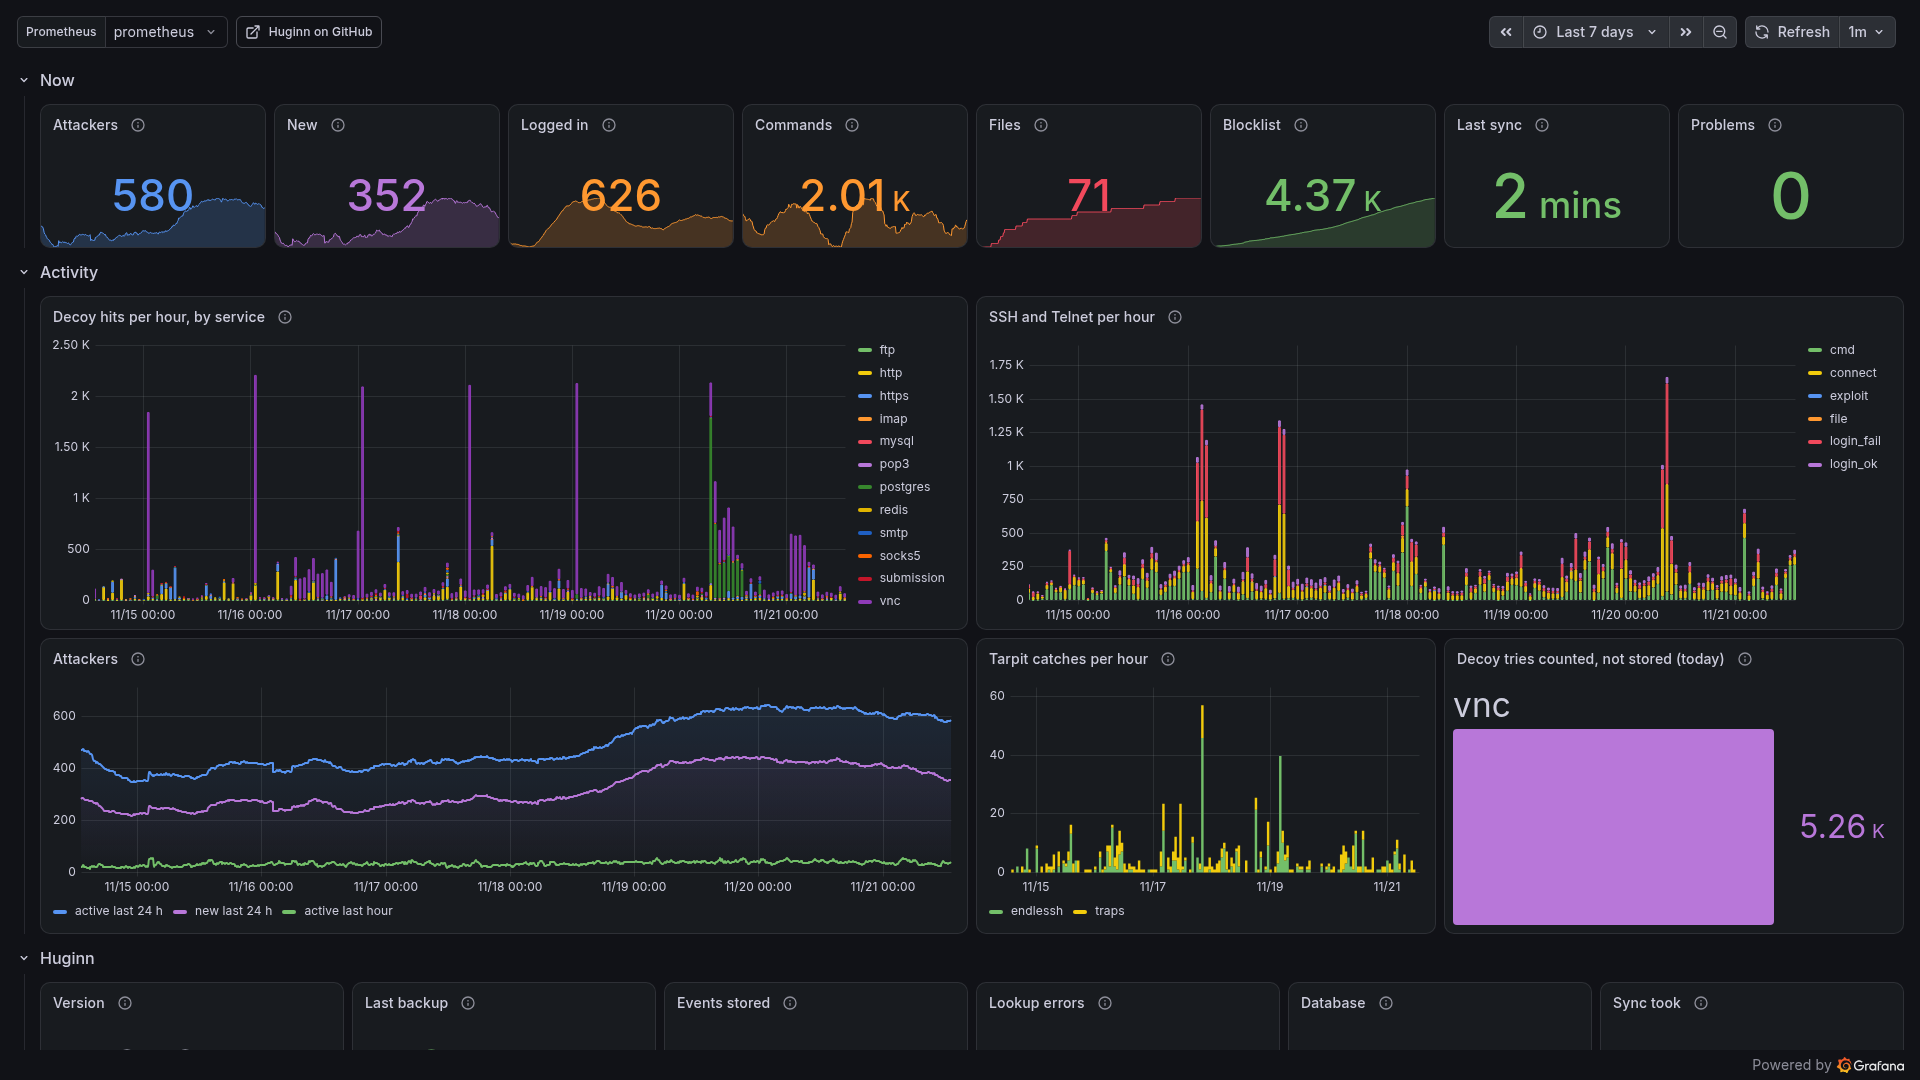
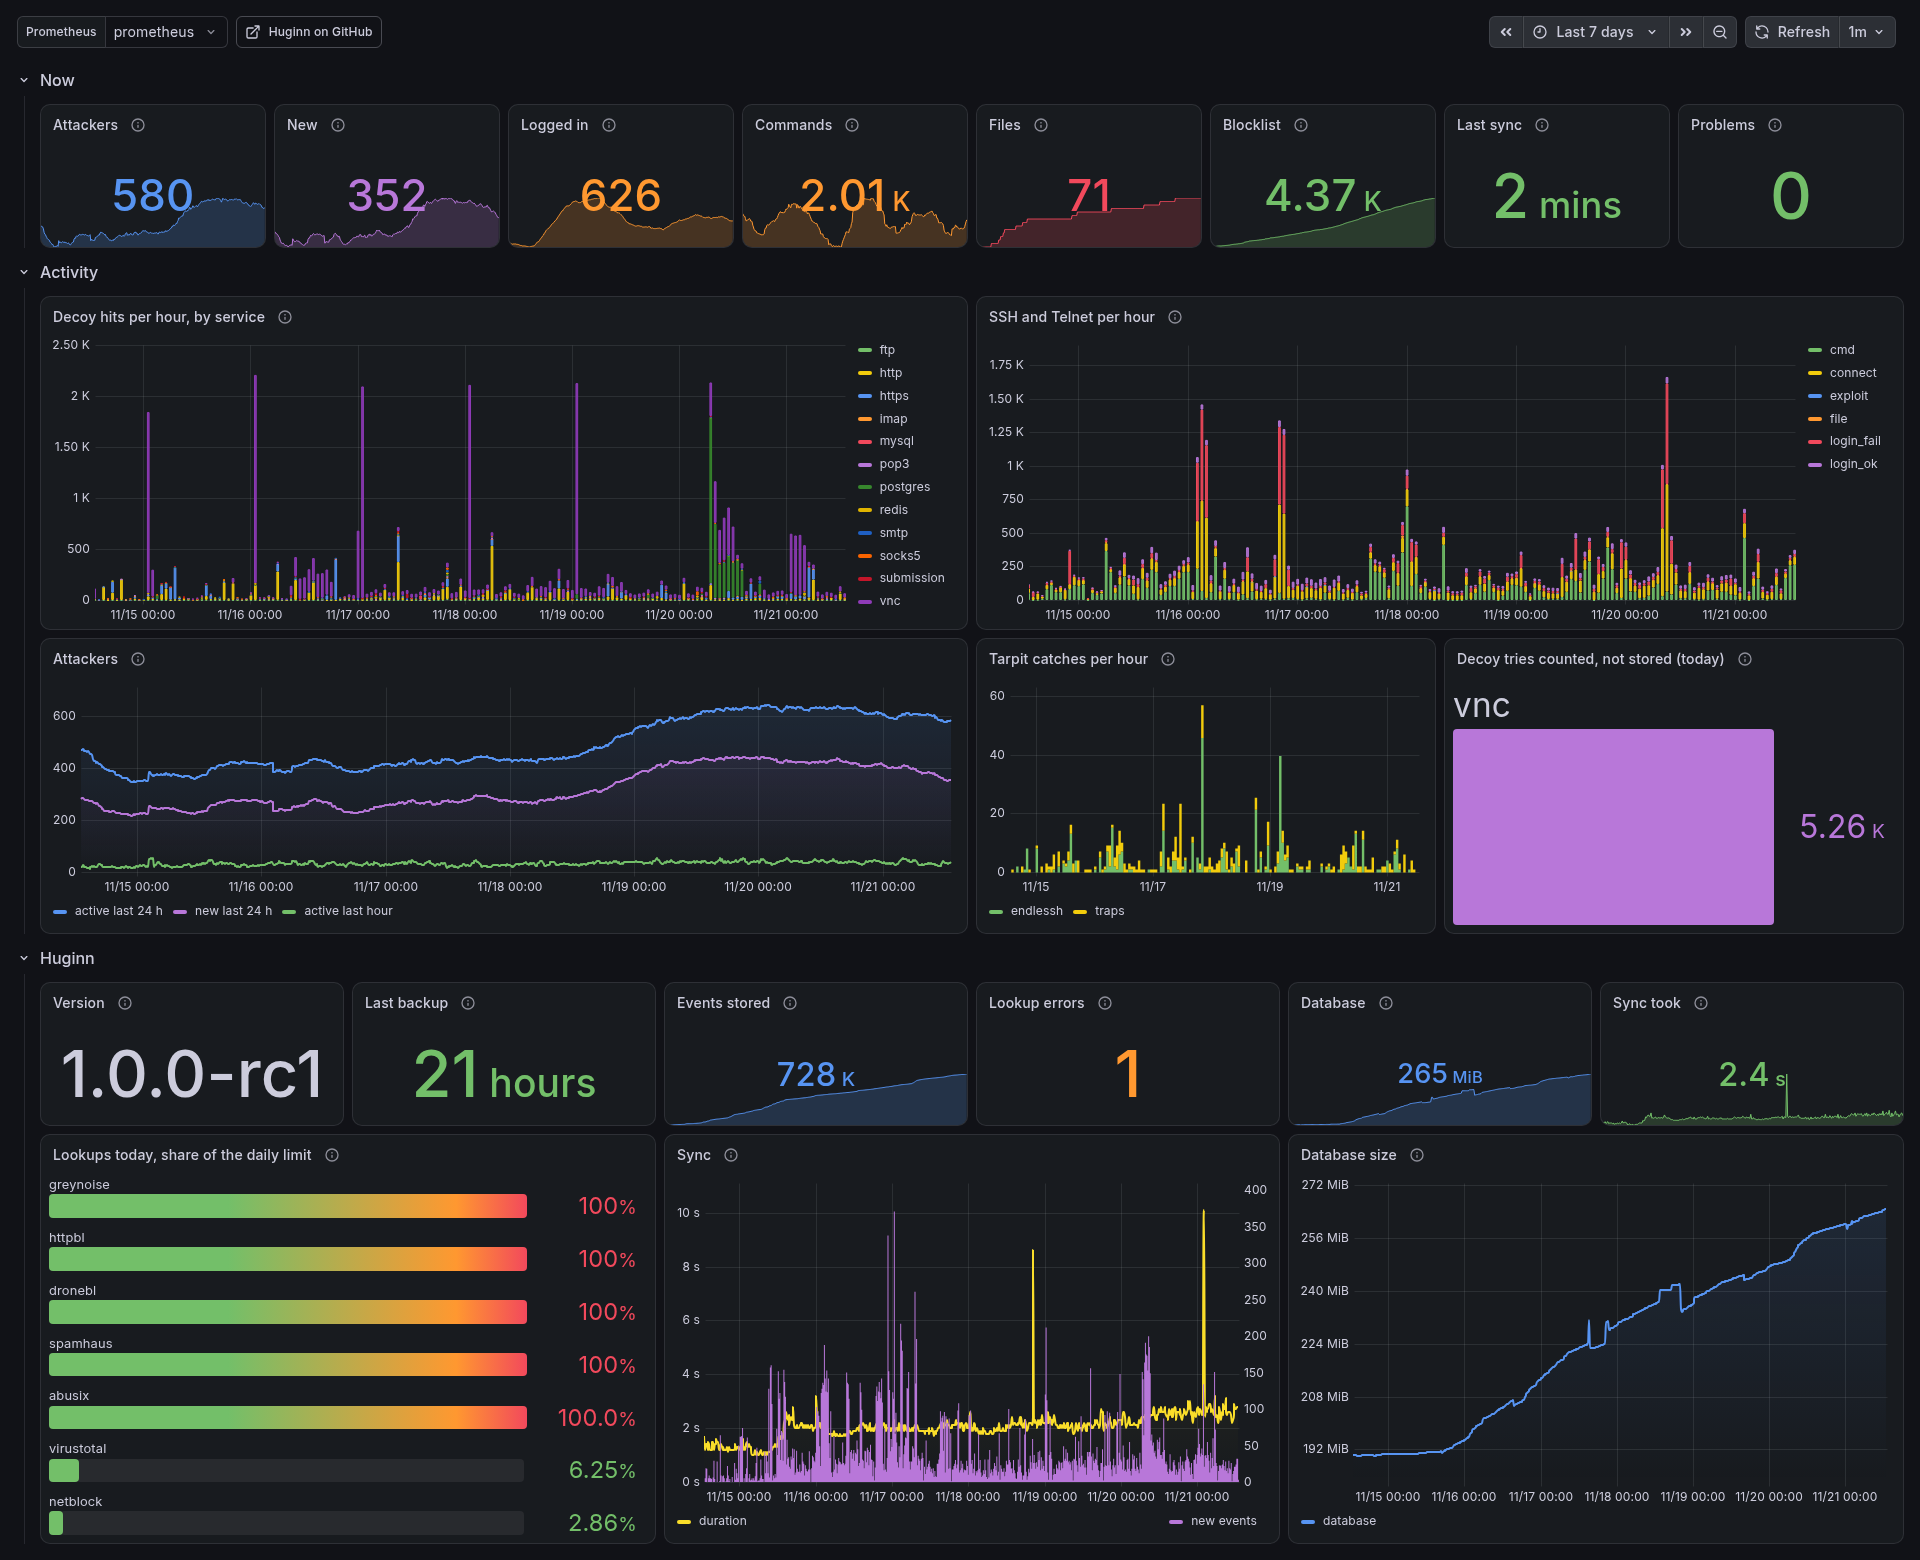
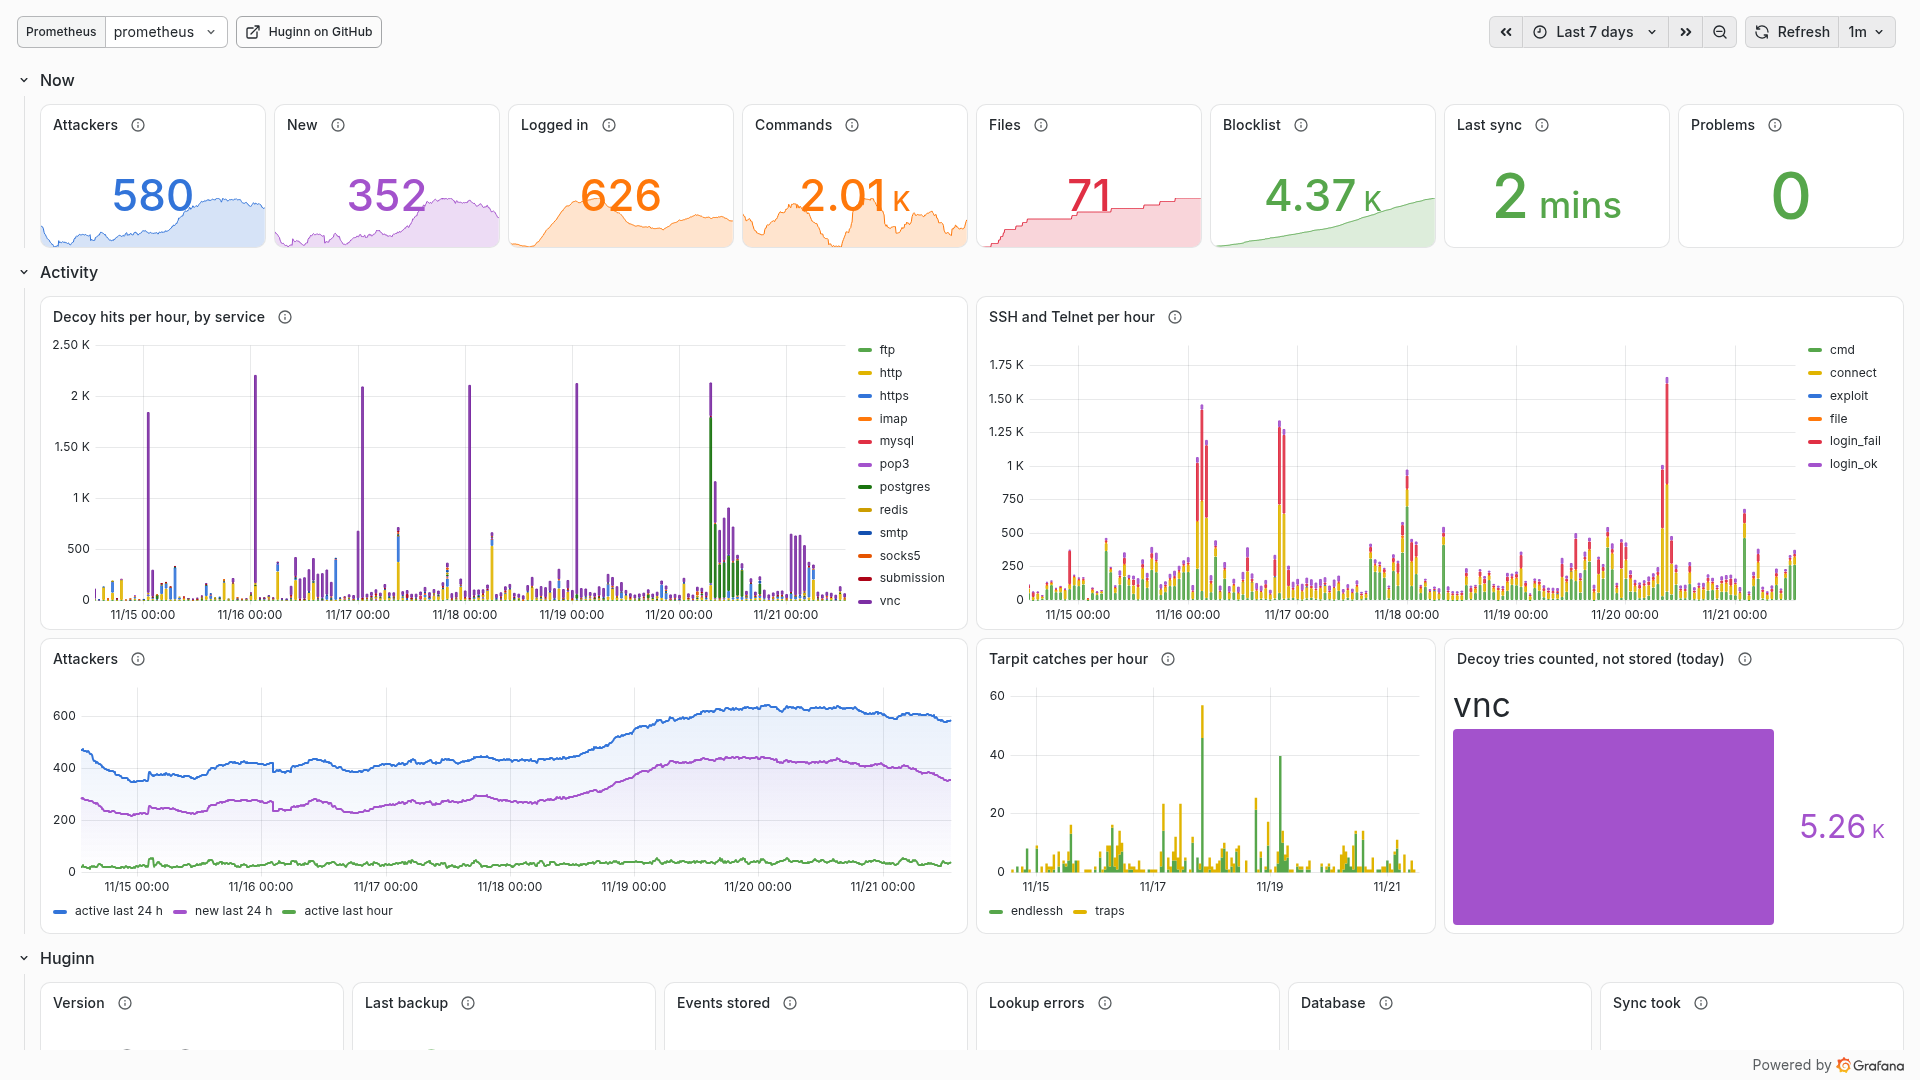
Huginn honeypot dashboard
Live view of a Huginn honeypot: who is attacking right now, what they do once they get in, and whether Huginn itself is healthy.
Huginn is a self-hosted, open source (AGPL-3.0) companion for a Cowrie and OpenCanary honeypot. It collects the honeypot logs and turns them into a page per attacker, campaigns, captured files and blocklist feeds for firewalls. This dashboard shows the counts from Huginn's built-in /metrics endpoint.
Counts only. The endpoint never exposes addresses, usernames, passwords or commands. The details stay in Huginn, and Prometheus does not get a new time series for every attacker.
How the data is collected
honeypot (Cowrie, OpenCanary, tarpits) ──ssh, read-only──▶ Huginn ──/metrics──▶ Prometheus ──▶ Grafana
- Huginn pulls the honeypot logs every 2 minutes over SSH, with a key that can only run one read-only export command.
- Huginn serves the counts at
/metricsin the Prometheus text format, protected by a bearer token. There is no exporter, collectd or agent to install. - Prometheus scrapes it (or Grafana Alloy / Grafana Agent with
prometheus.scrape). A 60-second interval is enough.
Setup
- Install Huginn and connect it to your honeypot. The repository has an installer for both sides, a Debian package and a Docker image: https://github.com/ancientswede/Huginn
- In Huginn open Settings › Metrics › Turn on. It creates a token and shows a ready scrape job with your own address and token. For automated setups set
HUGINN_METRICS_TOKEN(16+ characters) in.envinstead. - Add the job under
scrape_configsinprometheus.ymland reload Prometheus (example file):
- job_name: huginn
  scrape_interval: 60s
  metrics_path: /metrics
  authorization:
    credentials: PASTE-THE-TOKEN-FROM-SETTINGS
    # or: credentials_file: /etc/prometheus/huginn.token
  static_configs:
    - targets: ['huginn.lan:8095']
- Import this dashboard and pick your Prometheus data source.
Requirements: Huginn 0.52 or later, Prometheus 2.x or 3.x, Grafana 10 or later. The metric names are part of Huginn's stability promise from 1.0: they stay the same until 2.0.
What the dashboard shows
Now
| Panel | Meaning |
|---|---|
| Attackers | Addresses seen in the last 24 hours |
| New | Addresses seen for the first time in the last 24 hours |
| Logged in | SSH and Telnet sessions that got in, last 24 hours |
| Commands | Commands typed in the fake shells, last 24 hours |
| Files | Files captured so far (uploads and downloads) |
| Blocklist | Addresses on the default blocklist feed |
| Last sync | Time since Huginn last collected from the honeypot |
| Problems | Collection problems, such as a source that went quiet for longer than usual. 0 is good |
Activity
| Panel | Meaning |
|---|---|
| Decoy hits per hour, by service | Hits on the decoy services (FTP, HTTP/HTTPS, MySQL, Postgres, Redis, VNC, SMTP, POP3, IMAP, SOCKS5…) |
| SSH and Telnet per hour | Connections, failed and accepted logins, commands, files and exploits in Cowrie |
| Attackers | Active in the last 24 hours, new in the last 24 hours, active in the last hour |
| Tarpit catches per hour | Connections that ended after being held in a tarpit (endlessh) or a slow trap reply |
| Decoy tries counted, not stored (today) | Repeated tries above the daily cap per address and service: counted, not stored. Resets at midnight UTC and shows "No data" until something has been counted that day |
Huginn
| Panel | Meaning |
|---|---|
| Version | The running Huginn version |
| Last backup | Age of the newest automatic database copy |
| Events stored | Events in the database |
| Lookup errors | Outside lookups whose last try failed (refused key, DNS problem, used-up allowance) |
| Database / Database size | Size of the database file, now and over time |
| Sync took / Sync | How long each sync took and how many new events it brought |
| Lookups today, share of the daily limit | Used share of each lookup service's daily allowance (GreyNoise, VirusTotal, http:BL, DroneBL, Spamhaus, Abusix…) |
Metrics used
huginn_attackers, huginn_attackers_new, huginn_sessions_last_24h, huginn_events_last_24h, huginn_events_ingested_total, huginn_events_stored, huginn_files_captured, huginn_blocklist_entries, huginn_decoy_dropped_today, huginn_collection_problems, huginn_last_sync_timestamp_seconds, huginn_last_sync_duration_seconds, huginn_last_sync_new_events, huginn_sync_error, huginn_lookups_used_today, huginn_lookups_daily_limit, huginn_lookup_error, huginn_lookup_paused, huginn_lookup_key_set, huginn_database_bytes, huginn_backup_last_timestamp_seconds, huginn_info, huginn_metrics_duration_seconds.
Links
- Source and docs: https://github.com/ancientswede/Huginn
- Live demo with made-up data: https://ancientswede.se/huginn/
- The dashboard is generated by
tools/grafana-dashboard.pyin the repository. Issues and ideas are welcome on GitHub.
Data source config
Collector config:
Upload an updated version of an exported dashboard.json file from Grafana
| Revision | Description | Created | |
|---|---|---|---|
| Download |