
Red Hat OpenShift and OKD (MetricsHub)
Use Cases
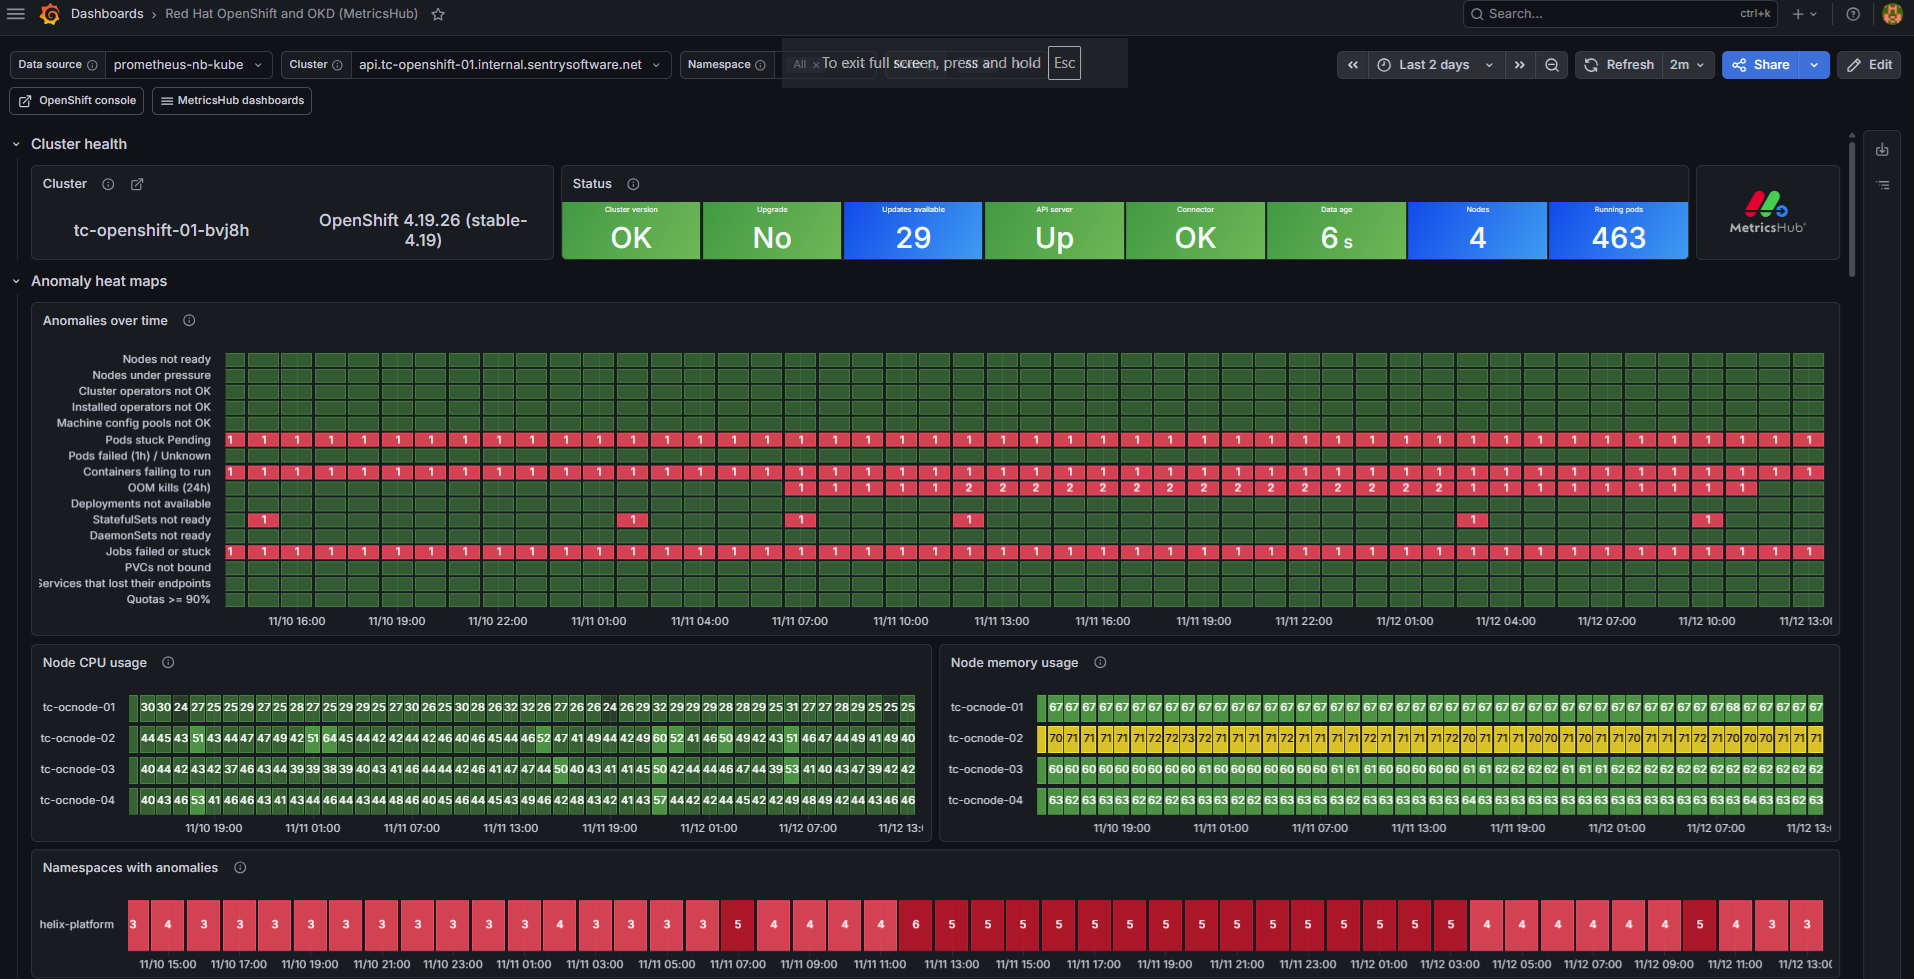
- Know at a glance whether your Red Hat OpenShift or OKD cluster is healthy: nodes, cluster operators, updates
- Detect failing workloads: pods not running, CrashLoopBackOff, OOM kills, image pull errors, unavailable replicas, failed or stuck jobs
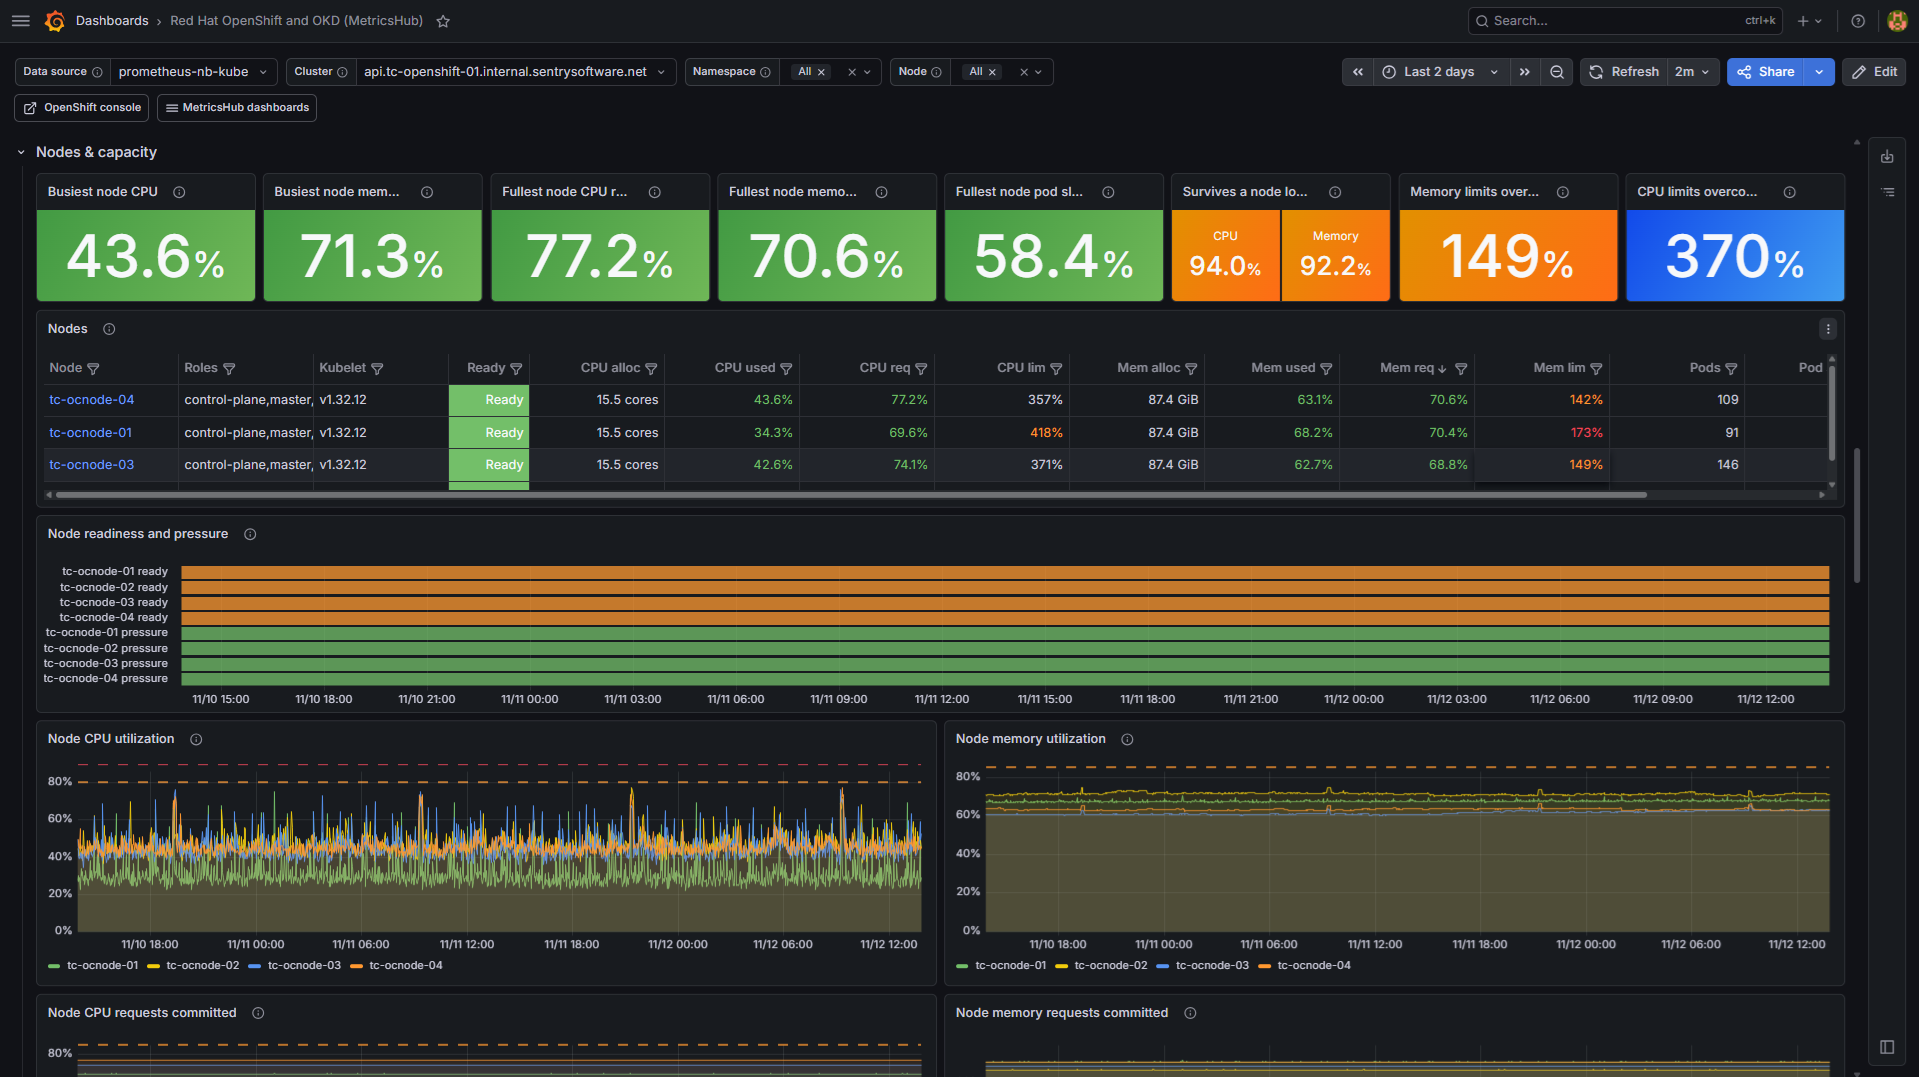
- Anticipate capacity issues: node pressure, CPU and memory requests versus allocatable capacity, quotas close to their limits, pending storage claims.
- Follow the platform lifecycle: cluster version, available updates, operators and machine config pools
- Monitor OpenShift alongside the rest of your infrastructure (servers, storage, network, databases) in the same observability platform
Prerequisites
- MetricsHub Enterprise installed and configured with the OpenShift connector
- A Prometheus server configured to expose the collected metrics
- Grafana 13.0.1 or later
- The Red Hat OpenShift and OKD (MetricsHub®) Grafana dashboard
MetricsHub Overview
MetricsHub is a universal metrics collection agent for OpenTelemetry deployed within your infrastructure. A single instance can remotely monitor Red Hat OpenShift and OKD 4.x clusters through their API server, with a read-only token (cluster-reader role): no agent, operator or exporter to deploy in the cluster.
MetricsHub collects the state and capacity of the cluster, following the OpenTelemetry semantic conventions for Kubernetes: cluster version and updates, cluster operators, operators installed by OLM, nodes, Deployments, StatefulSets, DaemonSets, HorizontalPodAutoscalers, Jobs, CronJobs, pods, containers, PersistentVolumeClaims, PersistentVolumes, Services, namespaces, machine config pools and resource quotas.
OpenShift monitoring is available exclusively with a MetricsHub Enterprise Edition license. You can try the Enterprise Edition for free for 30 days to explore its full capabilities.
Key Features
- Health banner and anomaly heat maps showing the nodes, namespaces and checks in trouble over time
- Node health and capacity: conditions (Ready, memory, disk and PID pressure), CPU and memory usage, requests versus allocatable capacity, pod slots, resilience to the loss of a node
- Workload health: desired versus available replicas, HorizontalPodAutoscalers at their limits, failed or stuck Jobs, blocked CronJobs
- Pod and container troubleshooting: phases, CrashLoopBackOff, image pull and configuration errors, restarts, OOM kills, usage versus requests and limits, containers without requests or limits
- Storage: PersistentVolumeClaim and PersistentVolume phases, pending claims, requested versus provisioned capacity
- Services without ready endpoints
- Project resource quotas and ClusterResourceQuotas close to their limits
- OpenShift platform: cluster version and updates, cluster operators, OLM operators and their updates, machine config pools
- Direct links to the OpenShift web console for every object
- MetricsHub collection health: connector status, data age and collect duration
Setup and Configuration
- Install and configure MetricsHub Enterprise, with the OpenShift connector and the token of a ServiceAccount bound to the
cluster-readerrole. - Send telemetry to Prometheus.
- Import the Red Hat OpenShift and OKD (MetricsHub®) dashboard into Grafana.
Other MetricsHub Grafana Dashboards
MetricsHub provides several Grafana dashboards to help you monitor your infrastructure at different levels, from a global view of all monitored environments to detailed metrics for individual systems.
Storage System (MetricsHub) Dashboard
Monitors the health, capacity and performance of storage systems across vendors, including IOPS, throughput, latency, capacity utilization and storage provisioning.
System Performance Metrics - Overview (MetricsHub)
Unified view of key performance indicators from Linux, Windows, HP-UX, and IBM AIX systems, including CPU utilization, memory consumption, file system capacity, network traffic, and protocol response times. All metrics are collected by MetricsHub® and presented in a clear, meaningful, and actionable dashboard.
System Performance Metrics (MetricsHub) Dashboard
Visualizes key system performance indicators, including CPU usage, memory consumption, filesystem capacity, network traffic, and protocol response time, for Linux, Windows, HP-UX, and IBM AIX systems.
Hardware Main (MetricsHub) Dashboard
Provides a centralized view of hardware health and performance metrics across all monitored environments. It aggregates telemetry collected by MetricsHub to help you quickly assess the status of your infrastructure.
Hardware Site (MetricsHub) Dashboard
Displays metrics associated with a specific site, such as a data center or server room, and the hosts monitored within that environment.
Hardware Host (MetricsHub) Dashboard
Focuses on a single monitored host and its internal components, providing detailed visibility into hardware health and performance metrics.
Data source config
Collector config:
Upload an updated version of an exported dashboard.json file from Grafana
| Revision | Description | Created | |
|---|---|---|---|
| Download |