
Typesense By Collection
Typesense traffic and latency per collection and action, and document counts per collection. Uses typesense-prometheus-exporter 1.x.
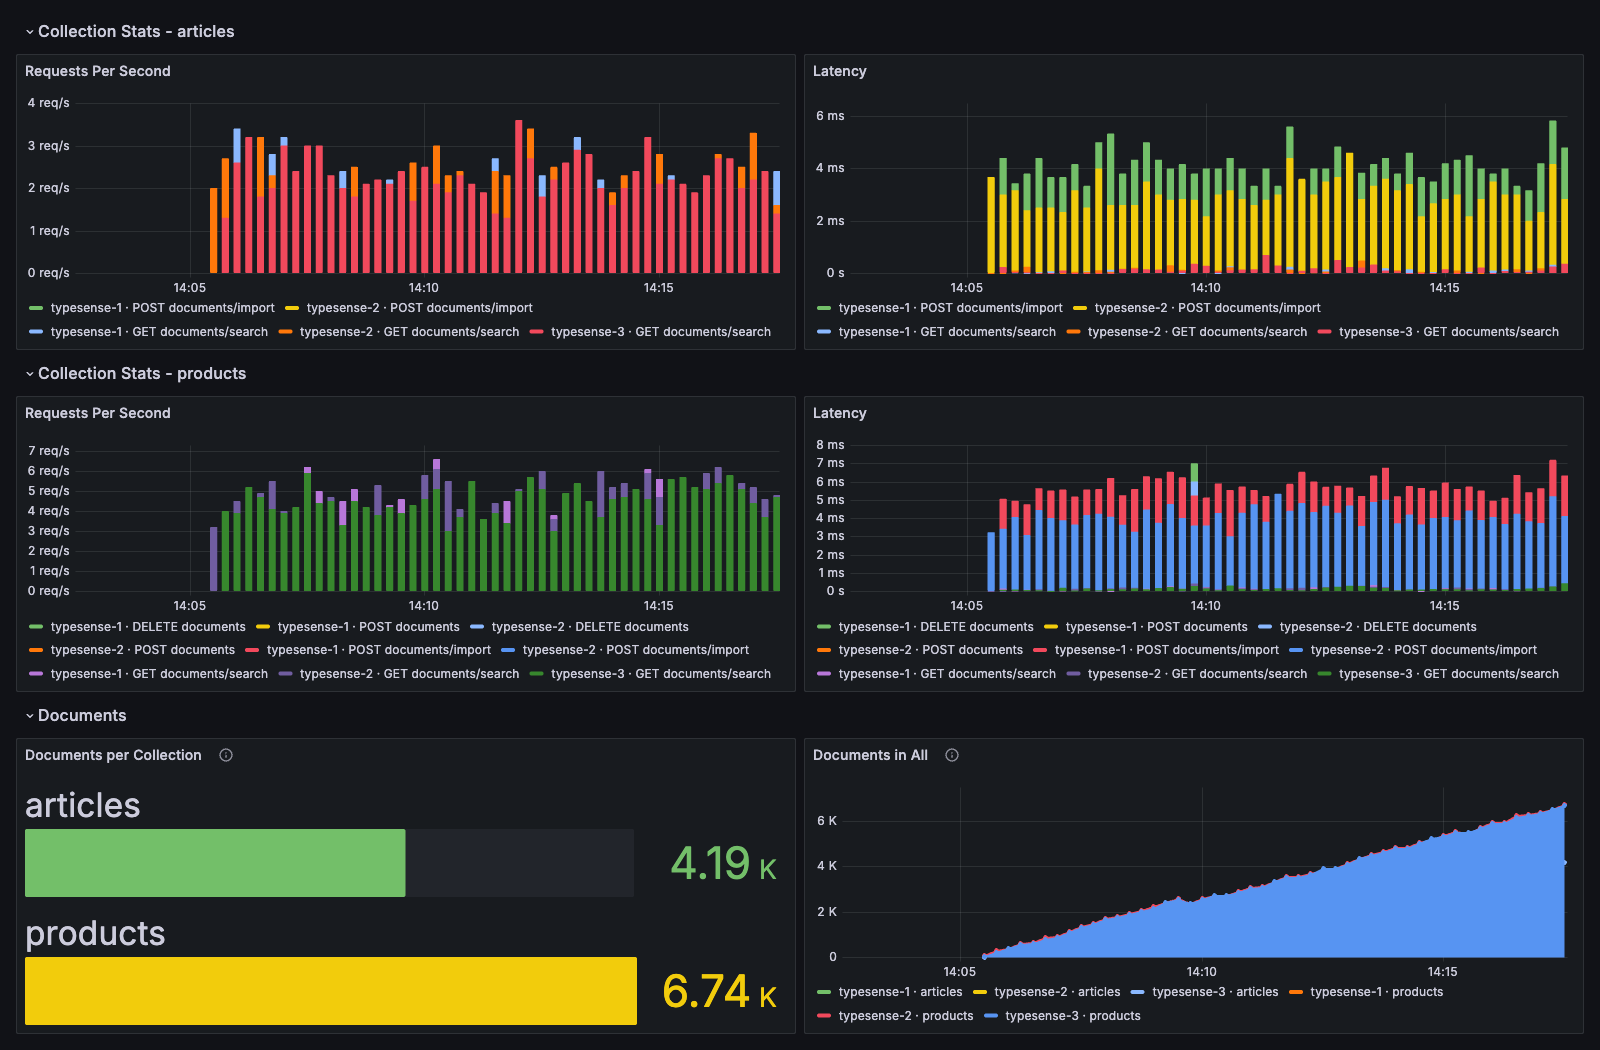
Typesense traffic broken down by collection: requests per second and latency for each method, collection and action (search, import, documents, ...), plus document counts per collection, so you can see which collections carry the load.
Part of a set of four Typesense dashboards for typesense-prometheus-exporter, an open-source Prometheus exporter for Typesense: Cluster Overview, Stats, Metrics and By Collection. The dashboards link to each other from the top bar.
Requirements
- Typesense, any recent version (tested with 30.1)
- typesense-prometheus-exporter 1.x, scraped by Prometheus
- Grafana 9 or later
Setup
Run the exporter next to each Typesense node, or one exporter for the whole cluster with
/probe?target=typesense-1.internal:8108:docker run -d -p 8888:8888 \ -e TYPESENSE_HOST=typesense-1.internal \ -e TYPESENSE_API_KEY_FILE=/run/secrets/typesense/api-key \ imatefx/typesense-prometheus-exporter:latestAdd it to Prometheus:
scrape_configs:
  - job_name: typesense-exporter
    scrape_timeout: 10s
    static_configs:
      - targets: [exporter-1.internal:8888]
Import this dashboard and pick your Prometheus data source. Use the host and collection variables to filter nodes and collections.
Documentation
- Getting started: Docker, binary, Prometheus and Kubernetes setups
- Metrics reference: every metric with its unit and labels
- Alert rules and dashboards
- Source, releases and issues on GitHub
Data source config
Collector config:
Upload an updated version of an exported dashboard.json file from Grafana
| Revision | Description | Created | |
|---|---|---|---|
| Download |