
Typesense Stats
Typesense request rates, search/import/write/delete latency (avg and p70/p95/p99/max), cache hit ratio and pending writes per node. Uses typesense-prometheus-exporter 1.x.
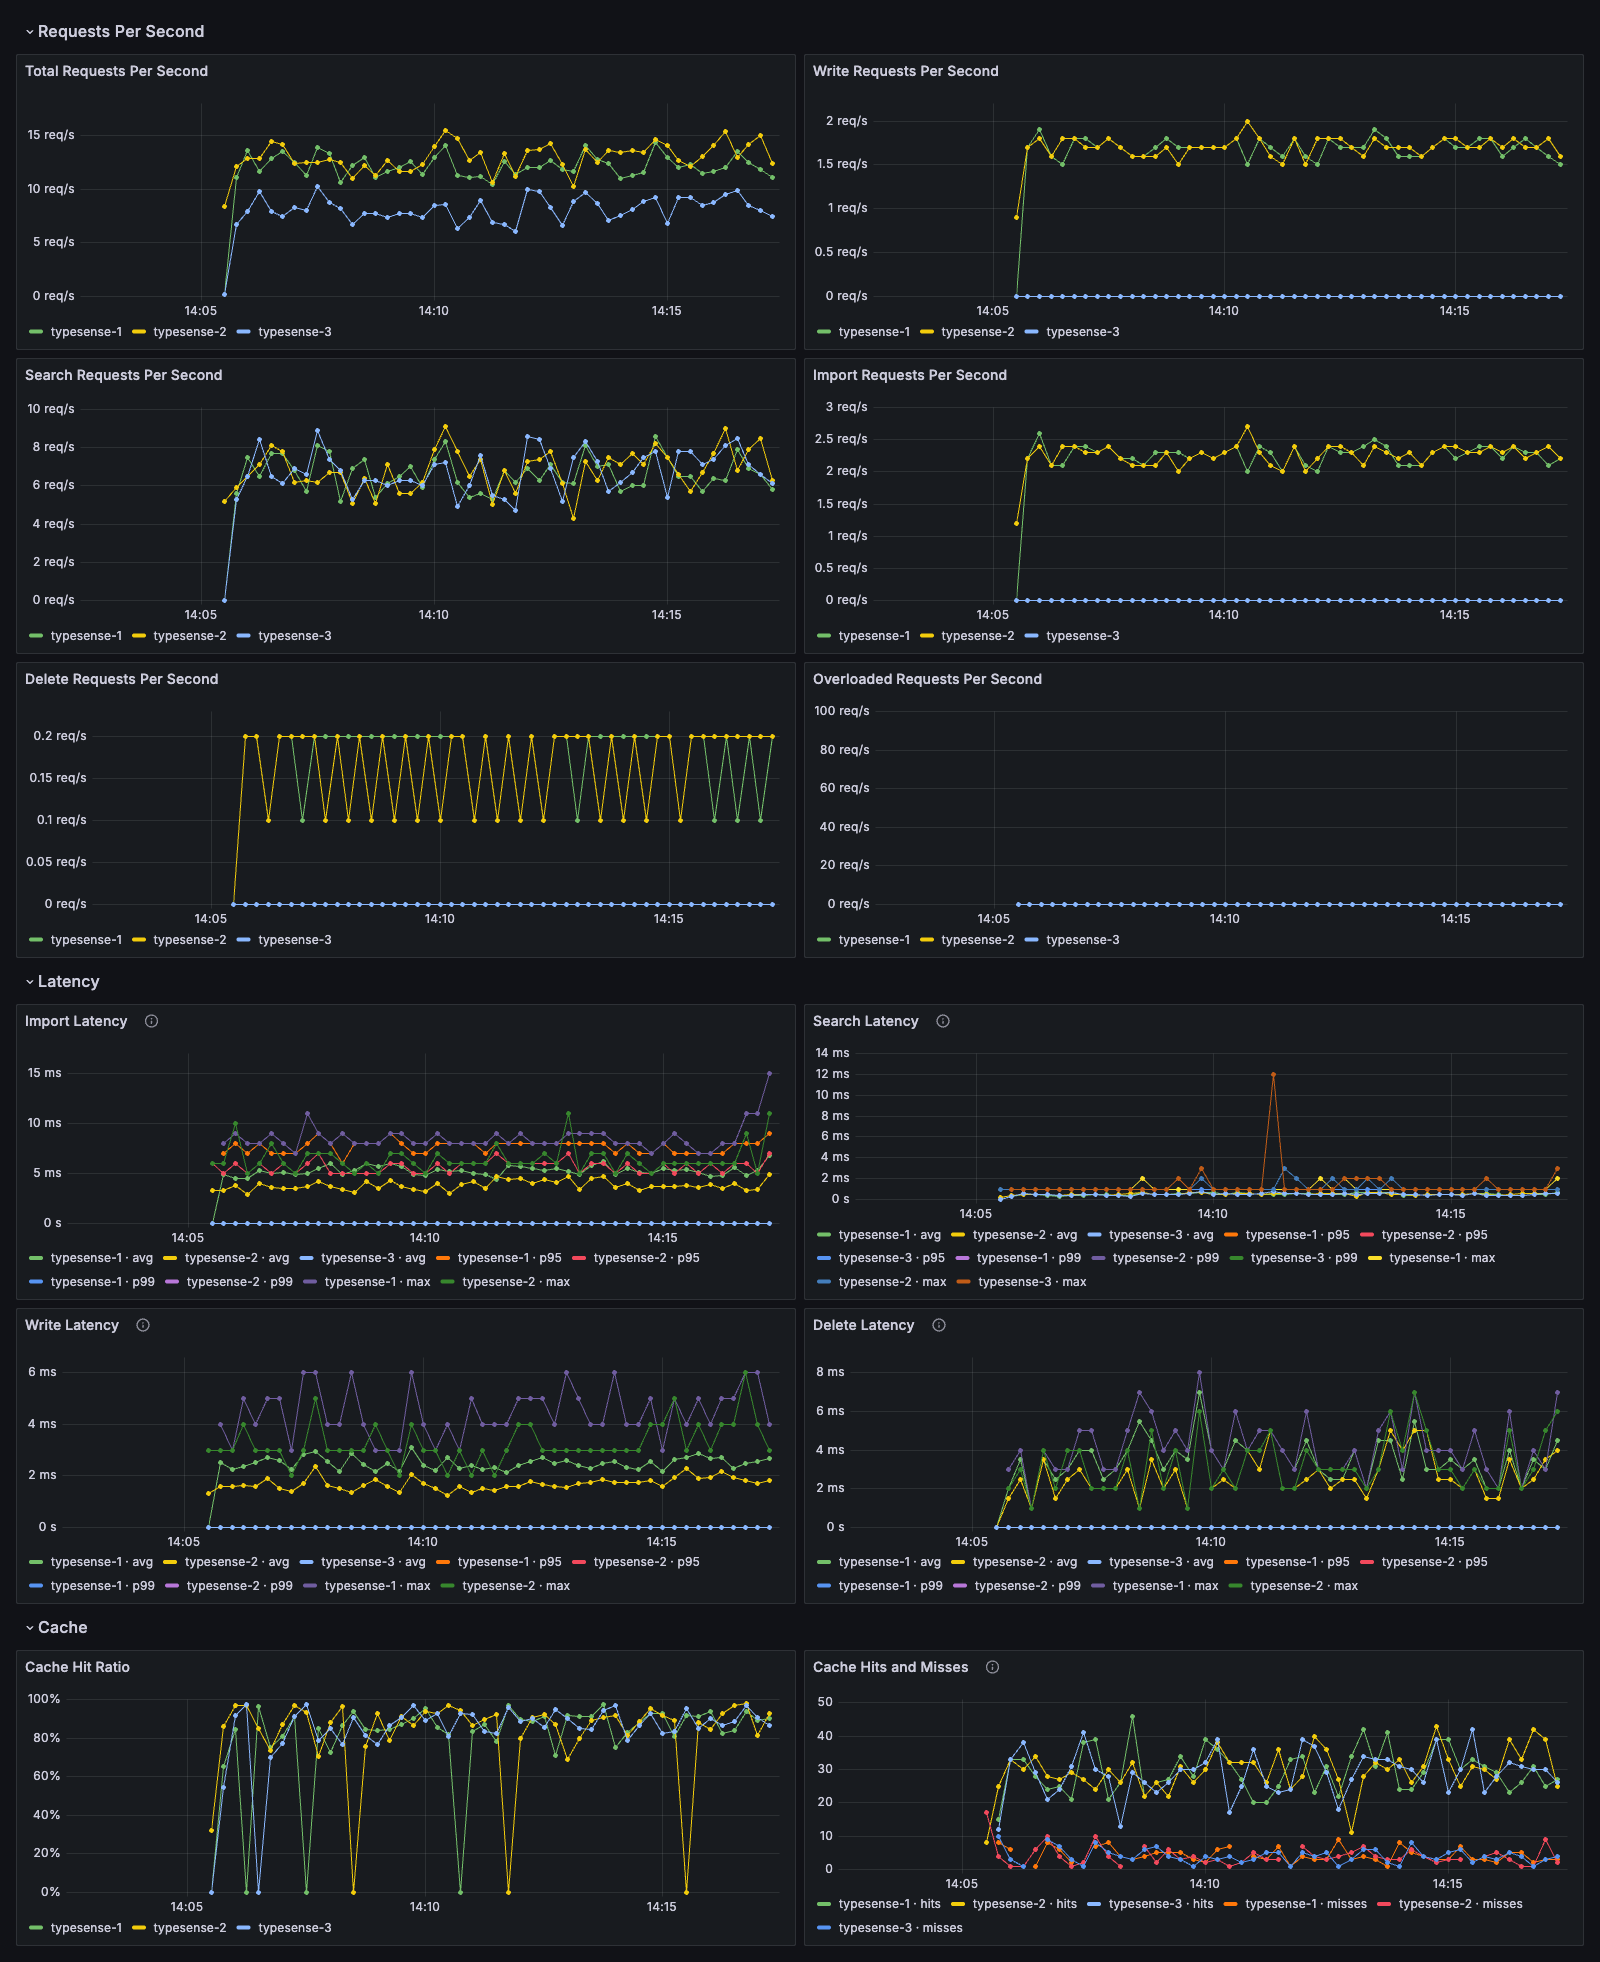
Typesense request traffic and latency per node: requests per second by operation (search, import, write, delete), all and overloaded requests, average and p70/p95/p99/max latency for each operation, cache hits, misses and hit ratio, and pending write batches.
Part of a set of four Typesense dashboards for typesense-prometheus-exporter, an open-source Prometheus exporter for Typesense: Cluster Overview, Stats, Metrics and By Collection. The dashboards link to each other from the top bar.
Requirements
- Typesense, any recent version (tested with 30.1)
- typesense-prometheus-exporter 1.x, scraped by Prometheus
- Grafana 9 or later
Setup
Run the exporter next to each Typesense node, or one exporter for the whole cluster with
/probe?target=typesense-1.internal:8108:docker run -d -p 8888:8888 \ -e TYPESENSE_HOST=typesense-1.internal \ -e TYPESENSE_API_KEY_FILE=/run/secrets/typesense/api-key \ imatefx/typesense-prometheus-exporter:latestAdd it to Prometheus:
scrape_configs:
  - job_name: typesense-exporter
    scrape_timeout: 10s
    static_configs:
      - targets: [exporter-1.internal:8888]
Import this dashboard and pick your Prometheus data source. Use the host variable to filter nodes.
Documentation
- Getting started: Docker, binary, Prometheus and Kubernetes setups
- Metrics reference: every metric with its unit and labels
- Alert rules and dashboards
- Source, releases and issues on GitHub
Data source config
Collector config:
Upload an updated version of an exported dashboard.json file from Grafana
| Revision | Description | Created | |
|---|---|---|---|
| Download |