
OpenTelemetry Collector: agent and gateway health
Throughput, refusals, export failures, queue use, memory and CPU for OpenTelemetry Collector agents and gateways. From the otel-collector-baseline Helm chart.
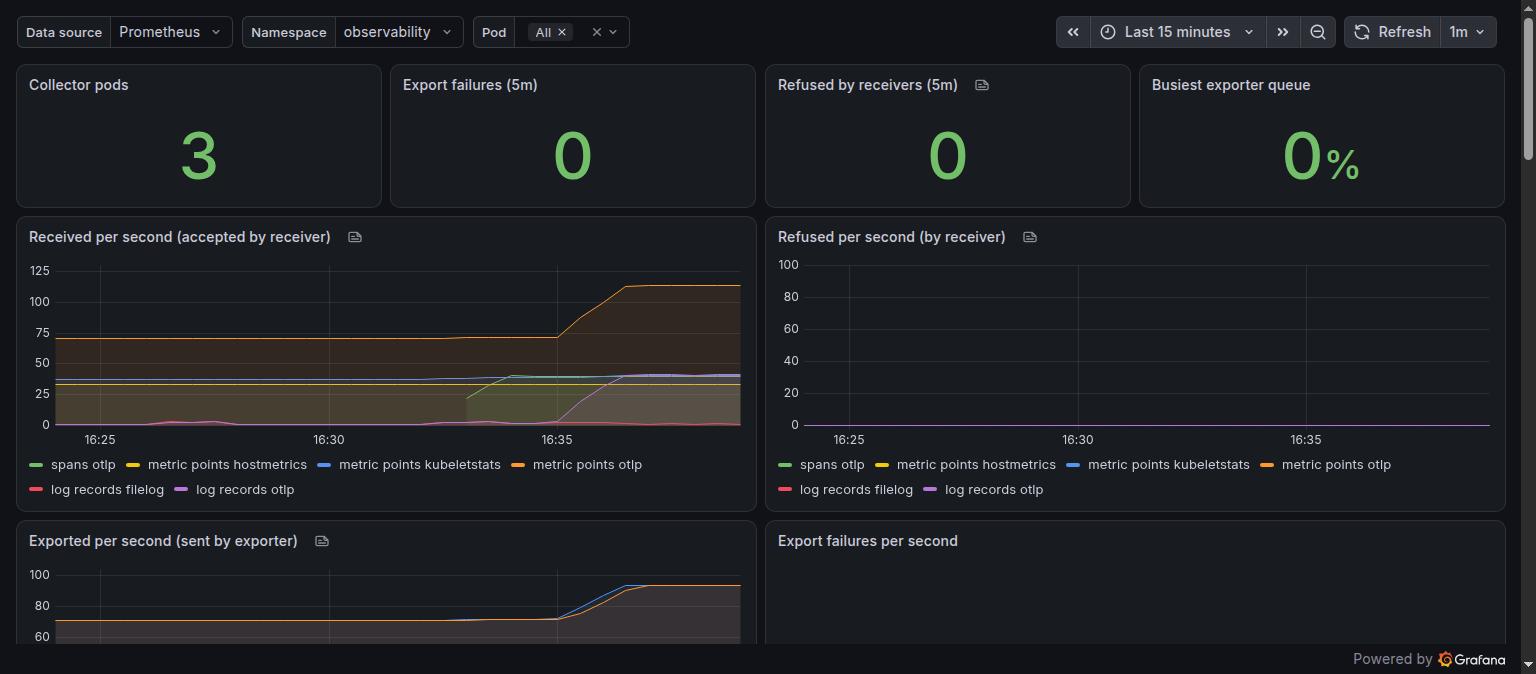
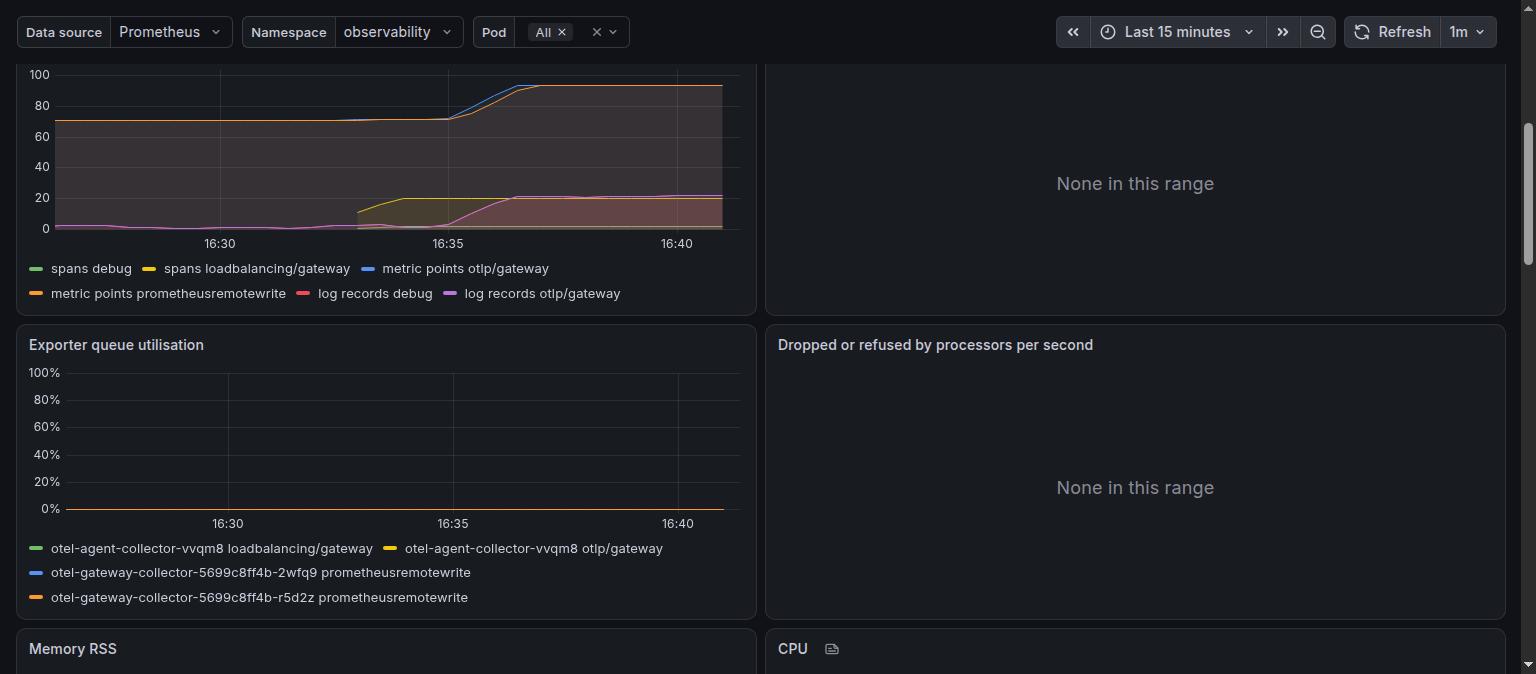
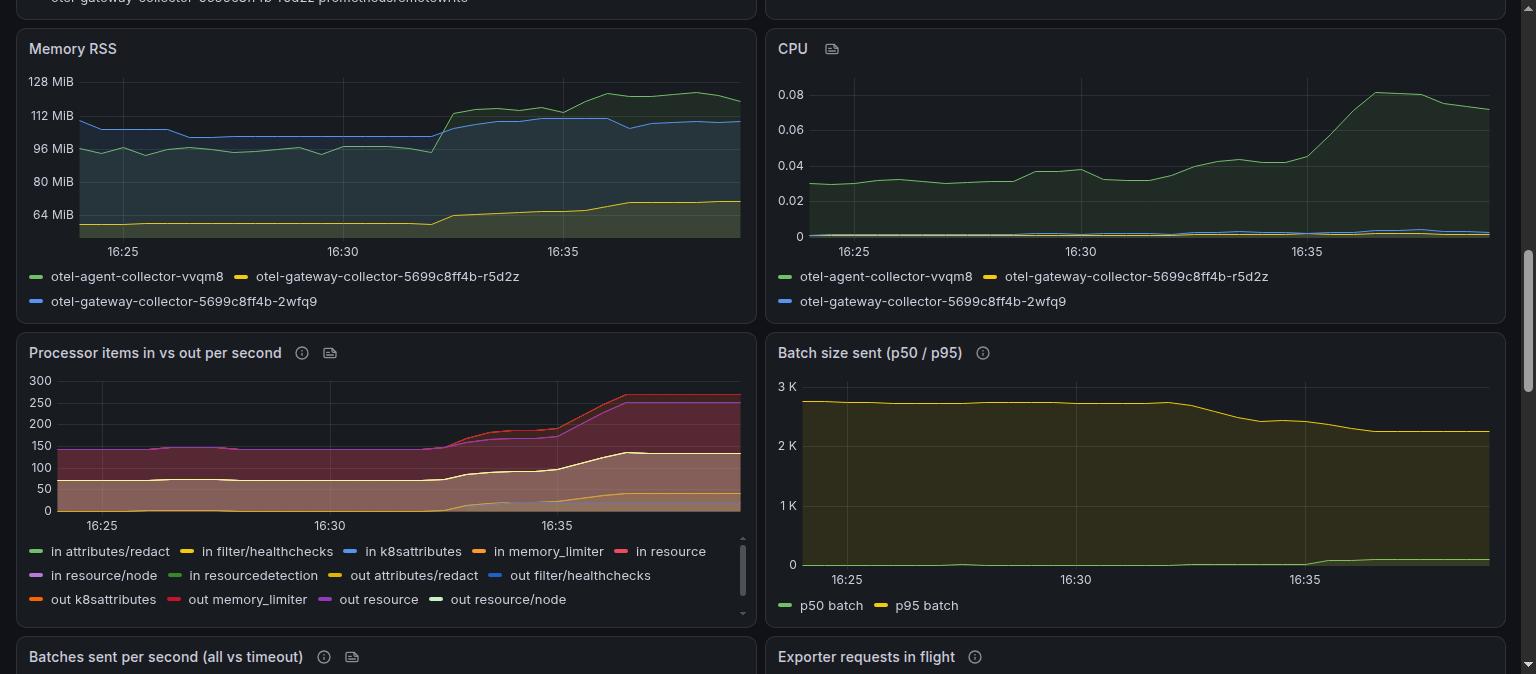
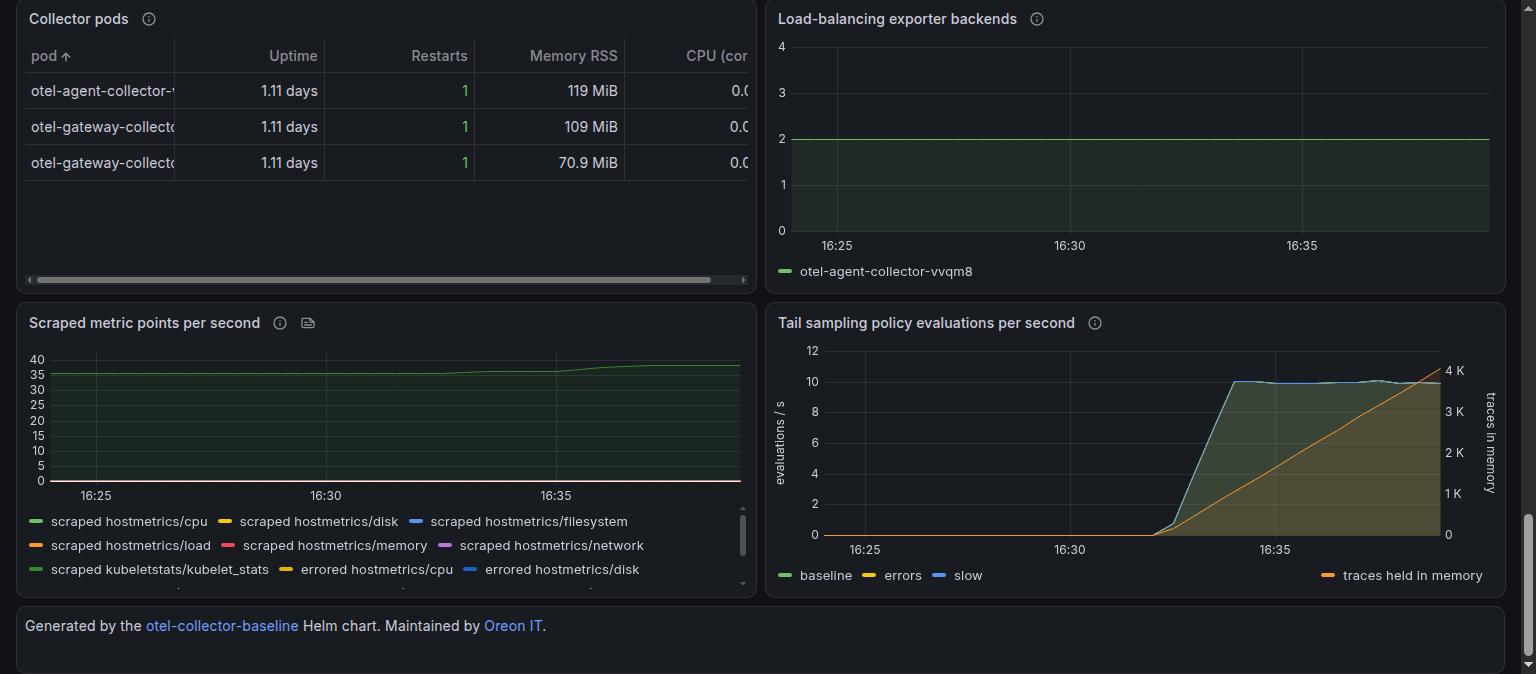
Health of OpenTelemetry Collectors from their own telemetry: spans, metric points and log records received, refused, exported and failed per second; exporter queue use against capacity and requests in flight; processor drops and memory limiter refusals; batch sizes; tail-sampling policy evaluations and load-balancing exporter backends; memory, Go heap and CPU per collector pod.
Works with any collector that exposes its internal metrics to Prometheus (otelcol_*, with or without the _total suffix). Built for the agent (DaemonSet) and gateway (Deployment) layout of the otel-collector-baseline Helm chart, which also ships the matching alerts.
Variables. Data source, namespace and collector pod.
Getting started
helm repo add oreonit https://oreondev.github.io/helm-charts
helm install otel oreonit/otel-collector-baseline -n observability --create-namespace -f otel.yaml
The collectors must expose their internal metrics to Prometheus. Values and examples: https://github.com/oreondev/helm-charts/tree/main/charts/otel-collector-baseline
Maintained by Oreon IT. Issues and pull requests: https://github.com/oreondev/helm-charts
Data source config
Collector config:
Upload an updated version of an exported dashboard.json file from Grafana
| Revision | Description | Created | |
|---|---|---|---|
| Download |

Grafana Agent

Easily monitor metrics and logs from a Grafana Agent instance with Grafana Cloud's out-of-the-box monitoring solution.
Learn more