
MySQL Multi-Region & Multi-Instance Overview
MySQL multi-region and multi-instance overview using Prometheus and mysqld_exporter. Regions are counted by distinct nonempty region labels. TPS represents explicit COMMIT+ROLLBACK statement rate. Replica IO/SQL columns select role names containing slave (case-insensitive). Missing metrics are unavailable. No alert rules or notification routes are installed. Target: MySQL 8.0.32 and 8.0.4x with matching exporter metrics. #Grafana version :Grafana v12.0.1 (80658a73c5) #operating system :Ubuntu 24.04.3 LTS
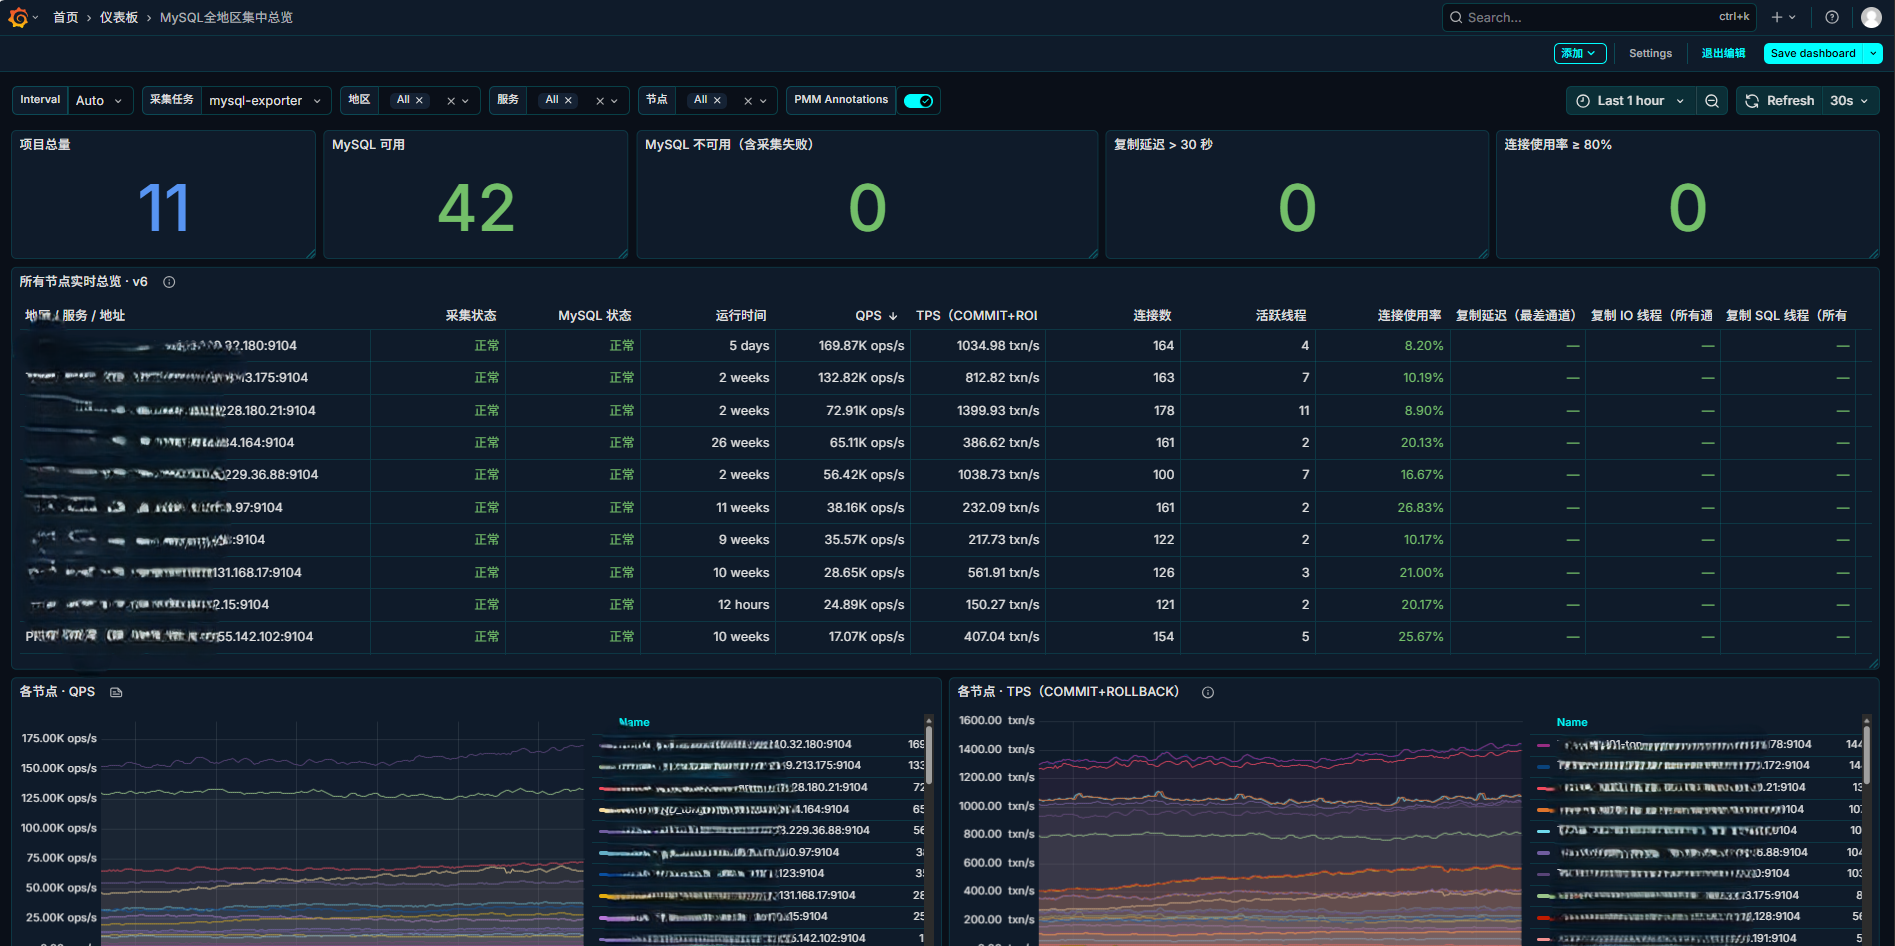
MySQL Multi-Region & Multi-Instance Overview
A Grafana dashboard for comparing MySQL instances across regions in a single view, using Prometheus and mysqld_exporter.
What it shows
The overview combines a distinct region count with instance-level MySQL availability and threshold summaries. The instance table shows exporter reachability, MySQL connectivity, uptime, QPS, explicit commit/rollback TPS, connections, running threads, connection utilization, replica delay, replica thread status for selected replicas, and buffer pool size.
Trend legends appear on the right and are sorted by the latest value in descending order. Filters support multiple regions, services, and instances. Additional MySQL diagnostic panels are grouped into expandable sections.
This is an operational overview, not a complete MGR health or failover assessment. The same region can contain standalone databases, replicas, and MGR members; the region label alone does not define a replication cluster.
Requirements
- Prometheus data source configured in Grafana.
- mysqld_exporter exposing the metrics listed below.
- Target MySQL versions: 8.0.32 and 8.0.4x. Match exporter metrics in the actual deployment; this is not a certification of every exporter or MySQL patch version.
- Grafana built-in Stat, Table, Time series, and Row panels. No third-party visualization plugin is required for the core overview.
- The table depends on label-to-field conversion, merging, and field organization. Verify these transformations after importing into another Grafana version.
The development JSON carried Grafana panel metadata for version 12.0.1. Confirm the actual running Grafana and exporter versions before declaring a tested compatibility matrix. Older Grafana versions have not been verified. The English-language community export uses a generic Prometheus import input; legacy Query Cache panels have been removed for MySQL 8.0.
Required labels
| Label | Meaning | Example |
|---|---|---|
job | Prometheus scrape job | mysql-exporter |
region | Logical monitoring region | region-a |
role | Human-readable instance/service name | region-a-mysql-Slave |
instance | Exporter endpoint or consistent instance identifier | 192.0.2.11:9104 |
Apply the same labels to the target's up series and the scraped MySQL metrics. The table's display identity combines region, role, and instance. If multiple jobs are available, select the intended MySQL job to avoid duplicate endpoint identities.
The role label is a display name, not a guaranteed MySQL primary/replica role. Only the replica IO/SQL status columns use the case-insensitive naming convention .*slave.*. Adapt that matcher if your environment uses names such as replica instead.
See examples/prometheus.yml for a minimal configuration with documentation-only addresses.
Exporter collectors
The overview uses collect.global_status and collect.global_variables. Replica information requires collect.slave_status and the appropriate database privileges. Additional diagnostic panels may require additional collectors, such as collect.engine_innodb_status.
Do not copy an exporter startup command over an existing service without checking its current version and supported flags. Collector names and output must match the installed exporter.
Metric definitions
| Display | Source / calculation | Interpretation |
|---|---|---|
| Region count | Count distinct nonempty region values from selected up targets | A region counts once even if it contains multiple instances; no fixed expected total |
| Exporter availability | up | Prometheus scrape success; does not by itself prove MySQL connectivity |
| MySQL connectivity | mysql_up, interpreted with up | Whether the exporter can connect to MySQL; scrape failures also make the instance unavailable in the overview |
| QPS | rate(mysql_global_status_queries[window]) | Server Queries statement rate, not application requests |
| TPS (COMMIT+ROLLBACK) | Sum of `rate(mysql_global_status_commands_total{command=~"commit | rollback"}[window])` per instance |
| Connection utilization | 100 * threads_connected / max_connections | Percentage of the configured connection limit |
| Replica delay | mysql_slave_status_seconds_behind_master | Maximum reported channel delay per instance in the overview |
| Replica IO / SQL | Minimum thread-running status across channels, only for names matching slave | 1 means all reported channels are running; 0 means at least one reported channel is stopped |
| Buffer pool | mysql_global_variables_innodb_buffer_pool_size | Configured InnoDB buffer pool capacity |
TPS does not fully cover autocommit, implicit commits, XA, or replica-applied transactions. It can include explicit commit/rollback statements that do no transaction work. It is not successful business-transaction throughput. Do not silently replace it with Handler counters and present the two definitions as equivalent.
A missing metric is unavailable, not zero. Replica delay alone does not establish replication health; unknown/NULL values, missing channels, and unavailable collectors need separate inspection. Non-replica hosts are not faulty merely because replica-only columns are empty.
Rate calculations use Grafana's $__rate_interval; align the data source scrape interval with the actual Prometheus configuration. A short time range or insufficient samples can produce gaps.
Import
- Configure the Prometheus data source and confirm the exporter targets are present.
- Import the released Classic dashboard JSON into Grafana.
- Map the Prometheus data source when prompted, or select the documented data source variable if the released export uses one.
- Select the MySQL scrape job and set region/service/instance filters to All for the full overview.
- Check that the region total matches distinct region labels rather than instance count.
- Confirm a known replica's IO and SQL values against the database, then save the dashboard.
The deployment default refresh interval is 30 seconds. Data freshness also depends on scrape intervals and query execution. The dashboard does not install Prometheus alerting rules, Alertmanager configuration, or notification destinations.
Troubleshooting
- No data: check the selected data source/job, labels, exporter collectors, scrape status, and Grafana query errors.
- TPS is missing: confirm
mysql_global_status_commands_totalhascommitandrollbackcommand series and that metric relabeling has not removed them. Avoid substituting a guessed metric name. - TPS is low with high QPS: inspect the explicit-commit definition and autocommit workload before assuming lost traffic.
- Replica columns are empty: check the
rolename matcher, collector availability, actual replication configuration, and exporter metric names. - Repeated rows or a dataset selector under the table: verify that the released query is an instant query and its results are merged before field organization.
- Unexpected region count: inspect spelling/case of
regionlabels and active filters. Region totals do not count unnamed targets. - Legacy panels show no data on MySQL 8: inspect their metric prerequisites; version-specific or removed features should be removed from the public export instead of advertised as supported.
References
- Grafana dashboard export and community publishing
- mysqld_exporter
- Exporter global status metric mapping
- MySQL 8.0 status variables
- Prometheus query basics
author: diagdba@gmail.com
Data source config
Collector config:
Upload an updated version of an exported dashboard.json file from Grafana
| Revision | Description | Created | |
|---|---|---|---|
| Download |

MySQL

Monitor MySQL with Grafana. Easily monitor your MySQL deployment with Grafana Cloud's out-of-the-box monitoring solution.
Learn more