
Fleet Hardware Inventory
Hardware inventory and health of a server fleet from node_exporter: platform, CPU, DIMMs, disks, network, thermals, power, firmware, a per-host passport and health signals that usually have no alerts.
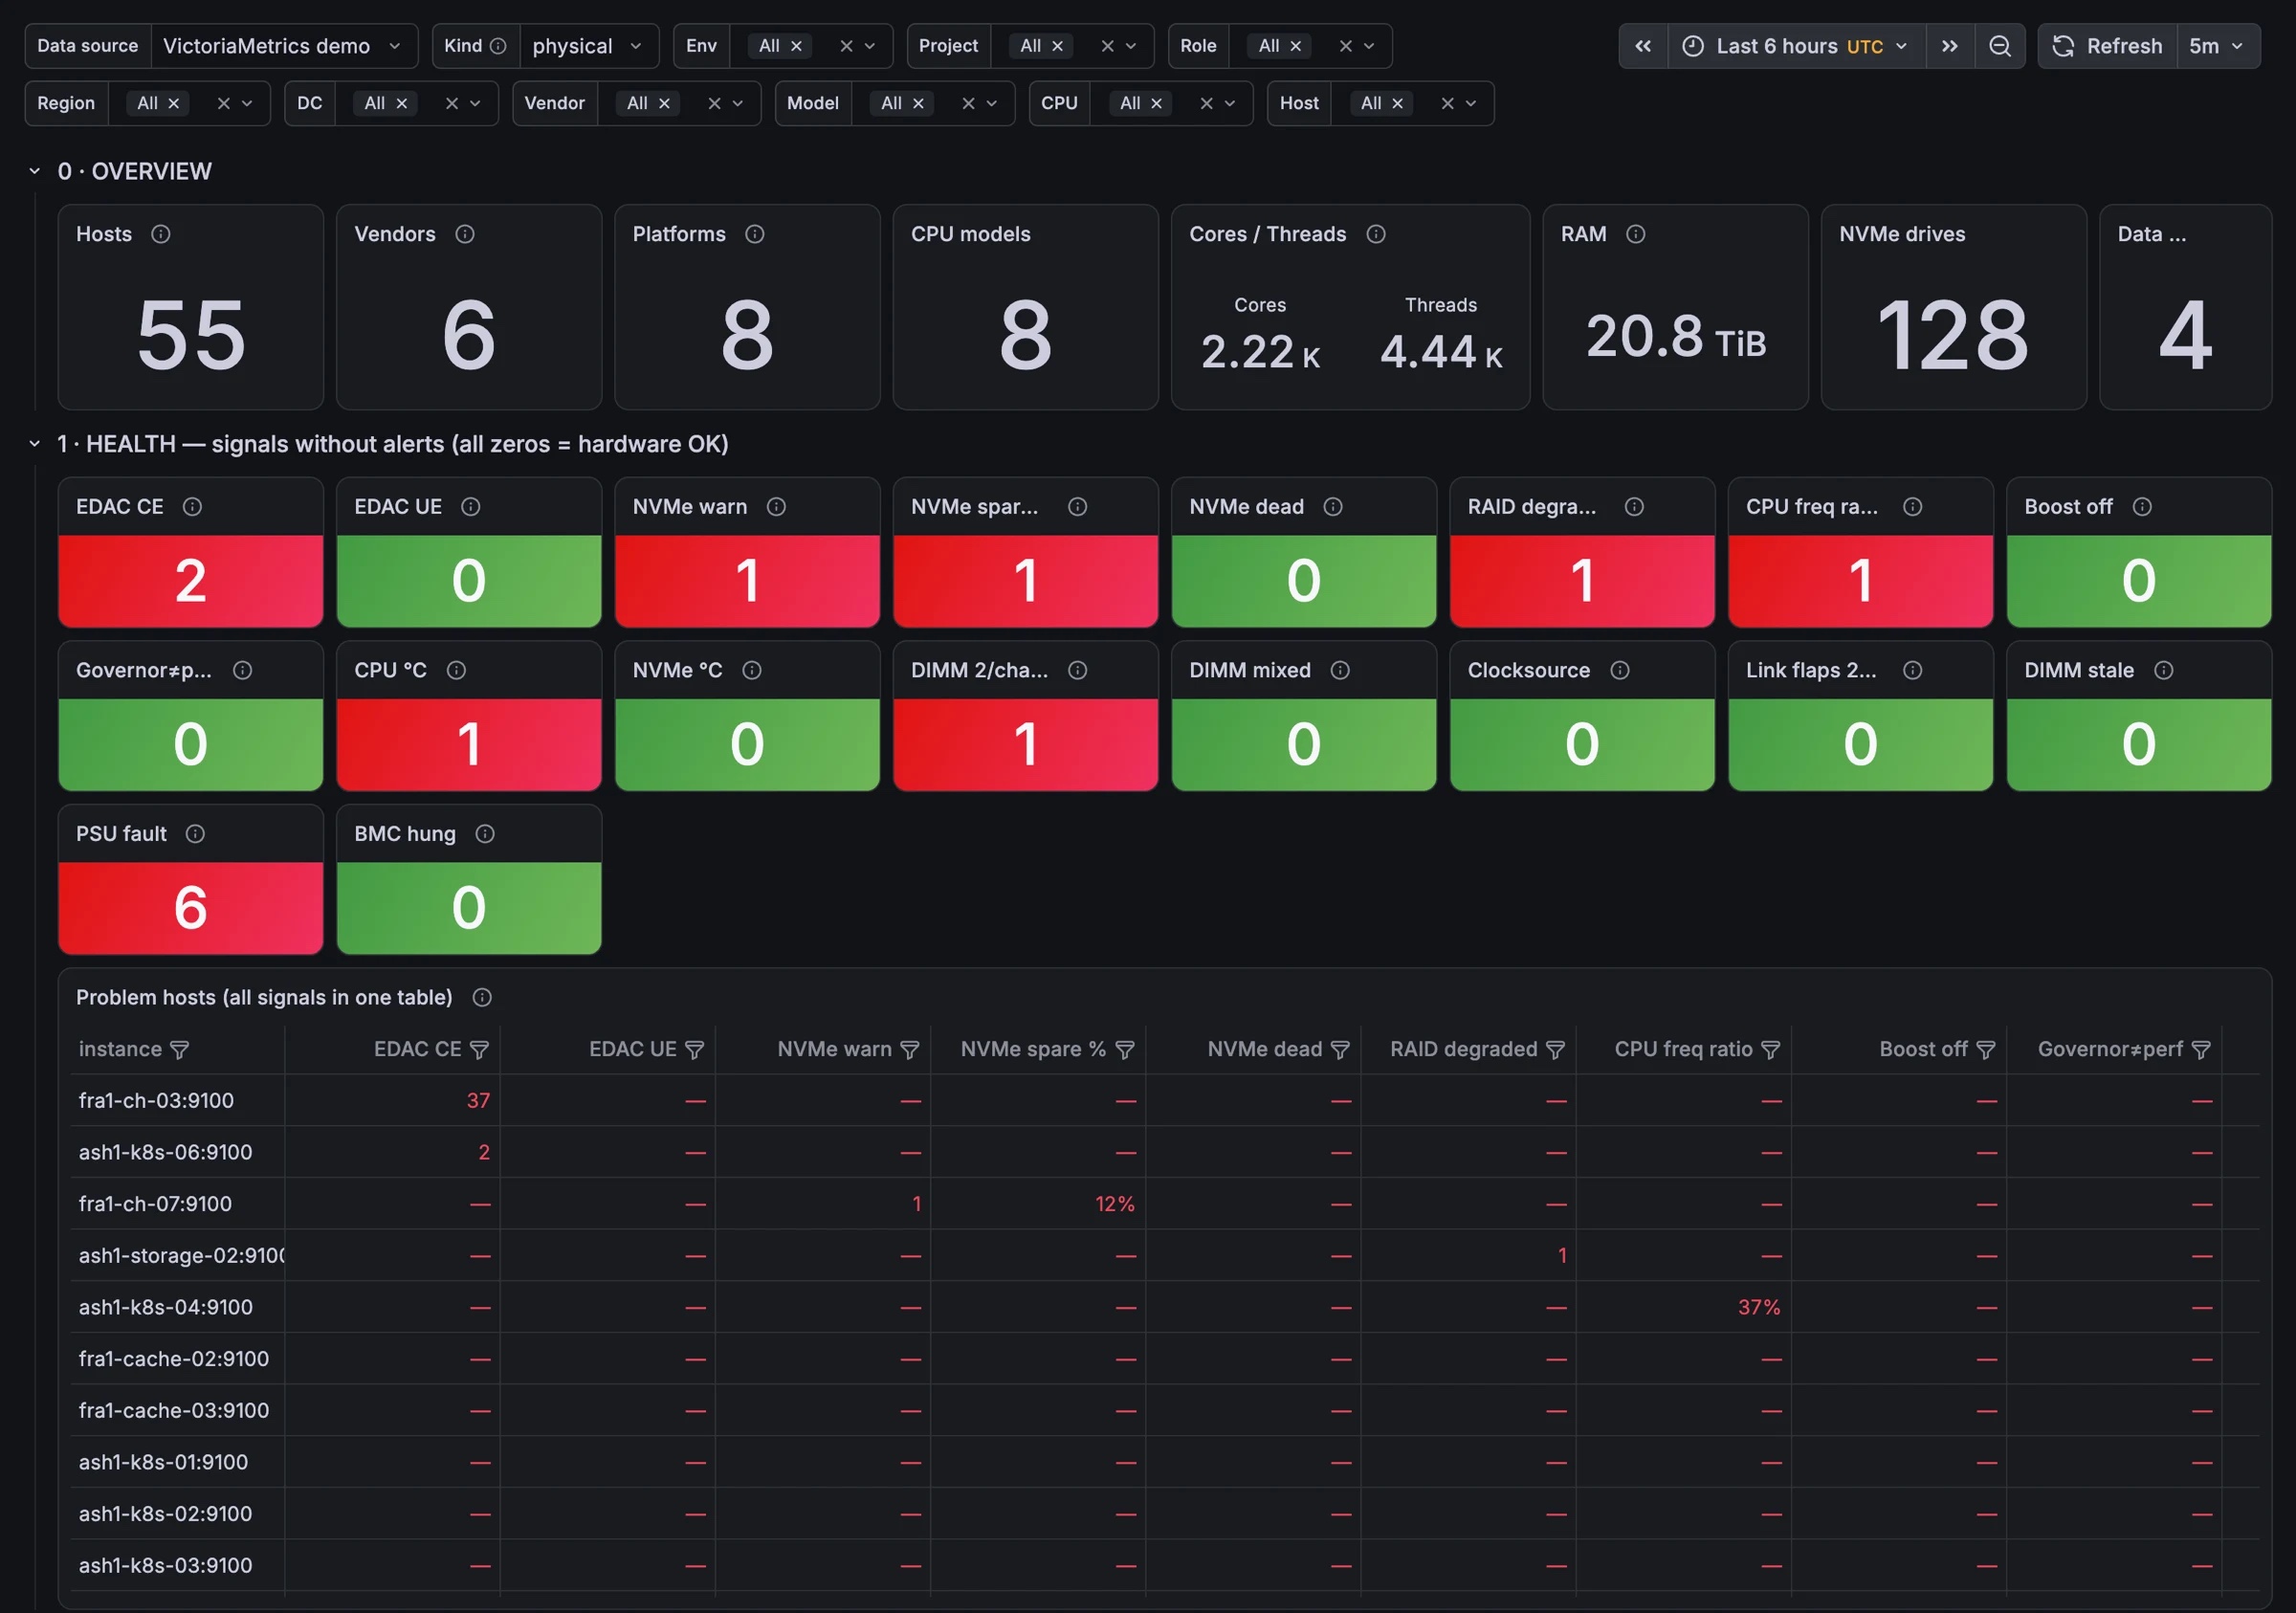
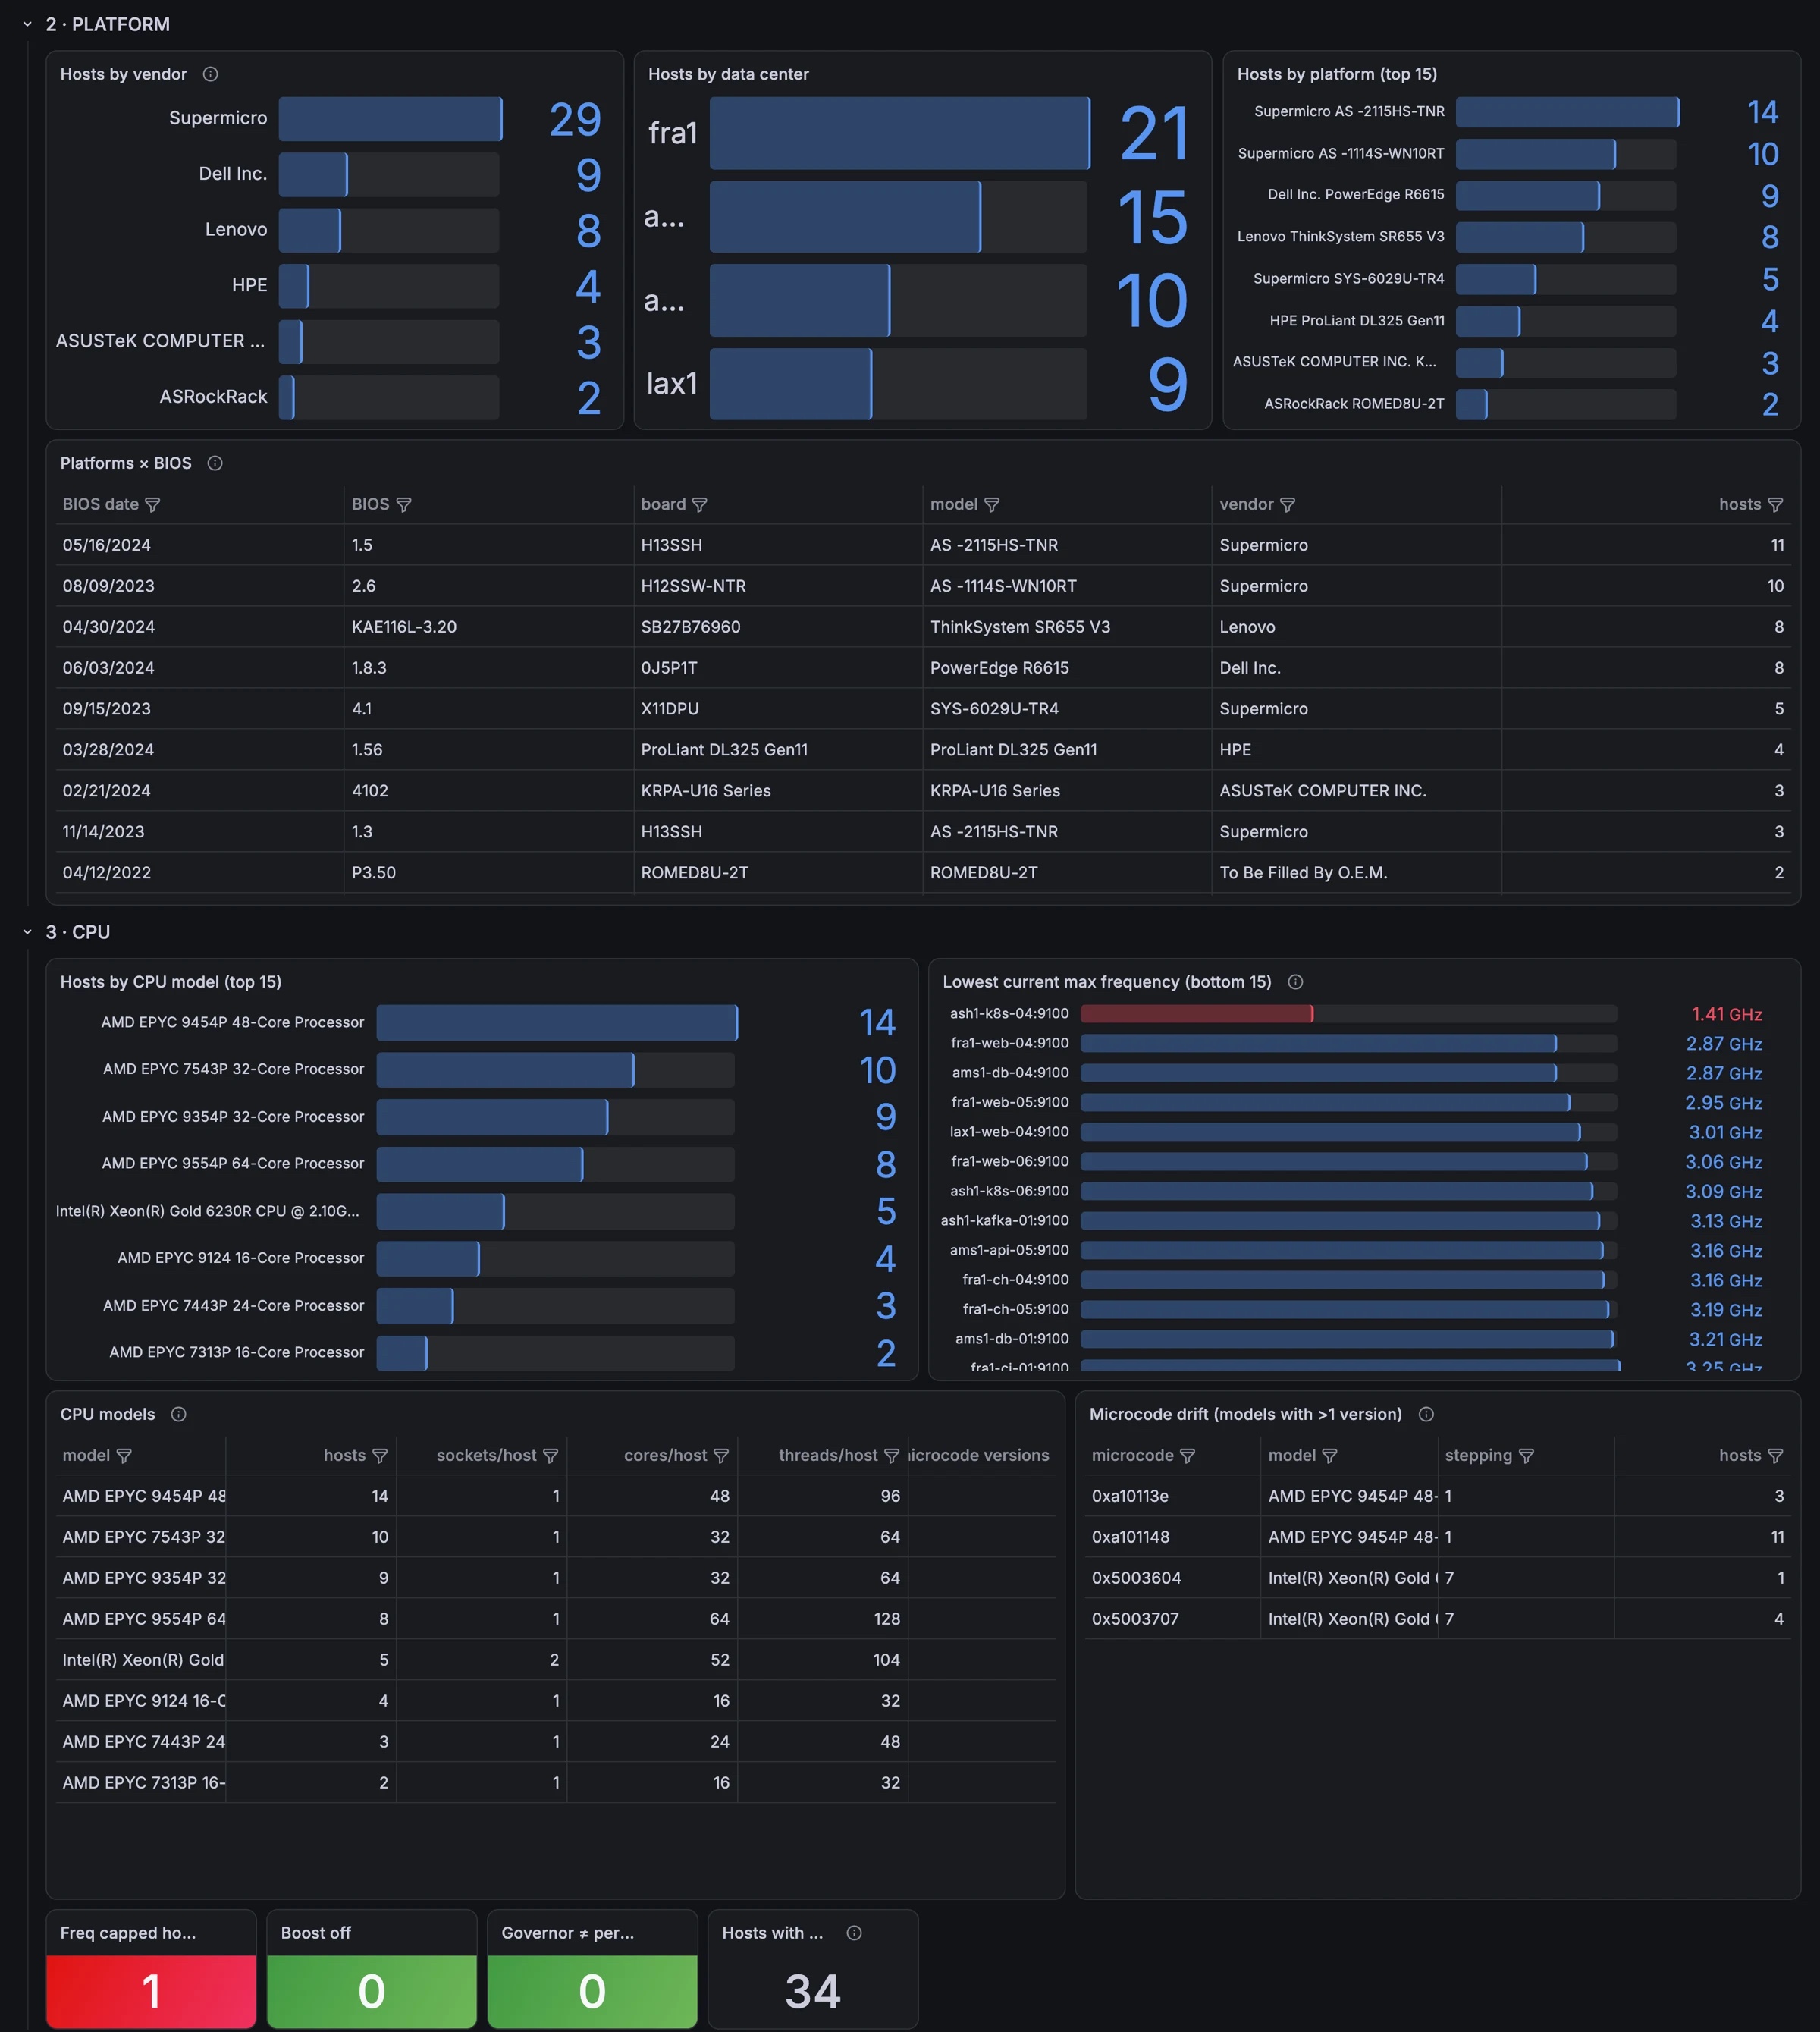
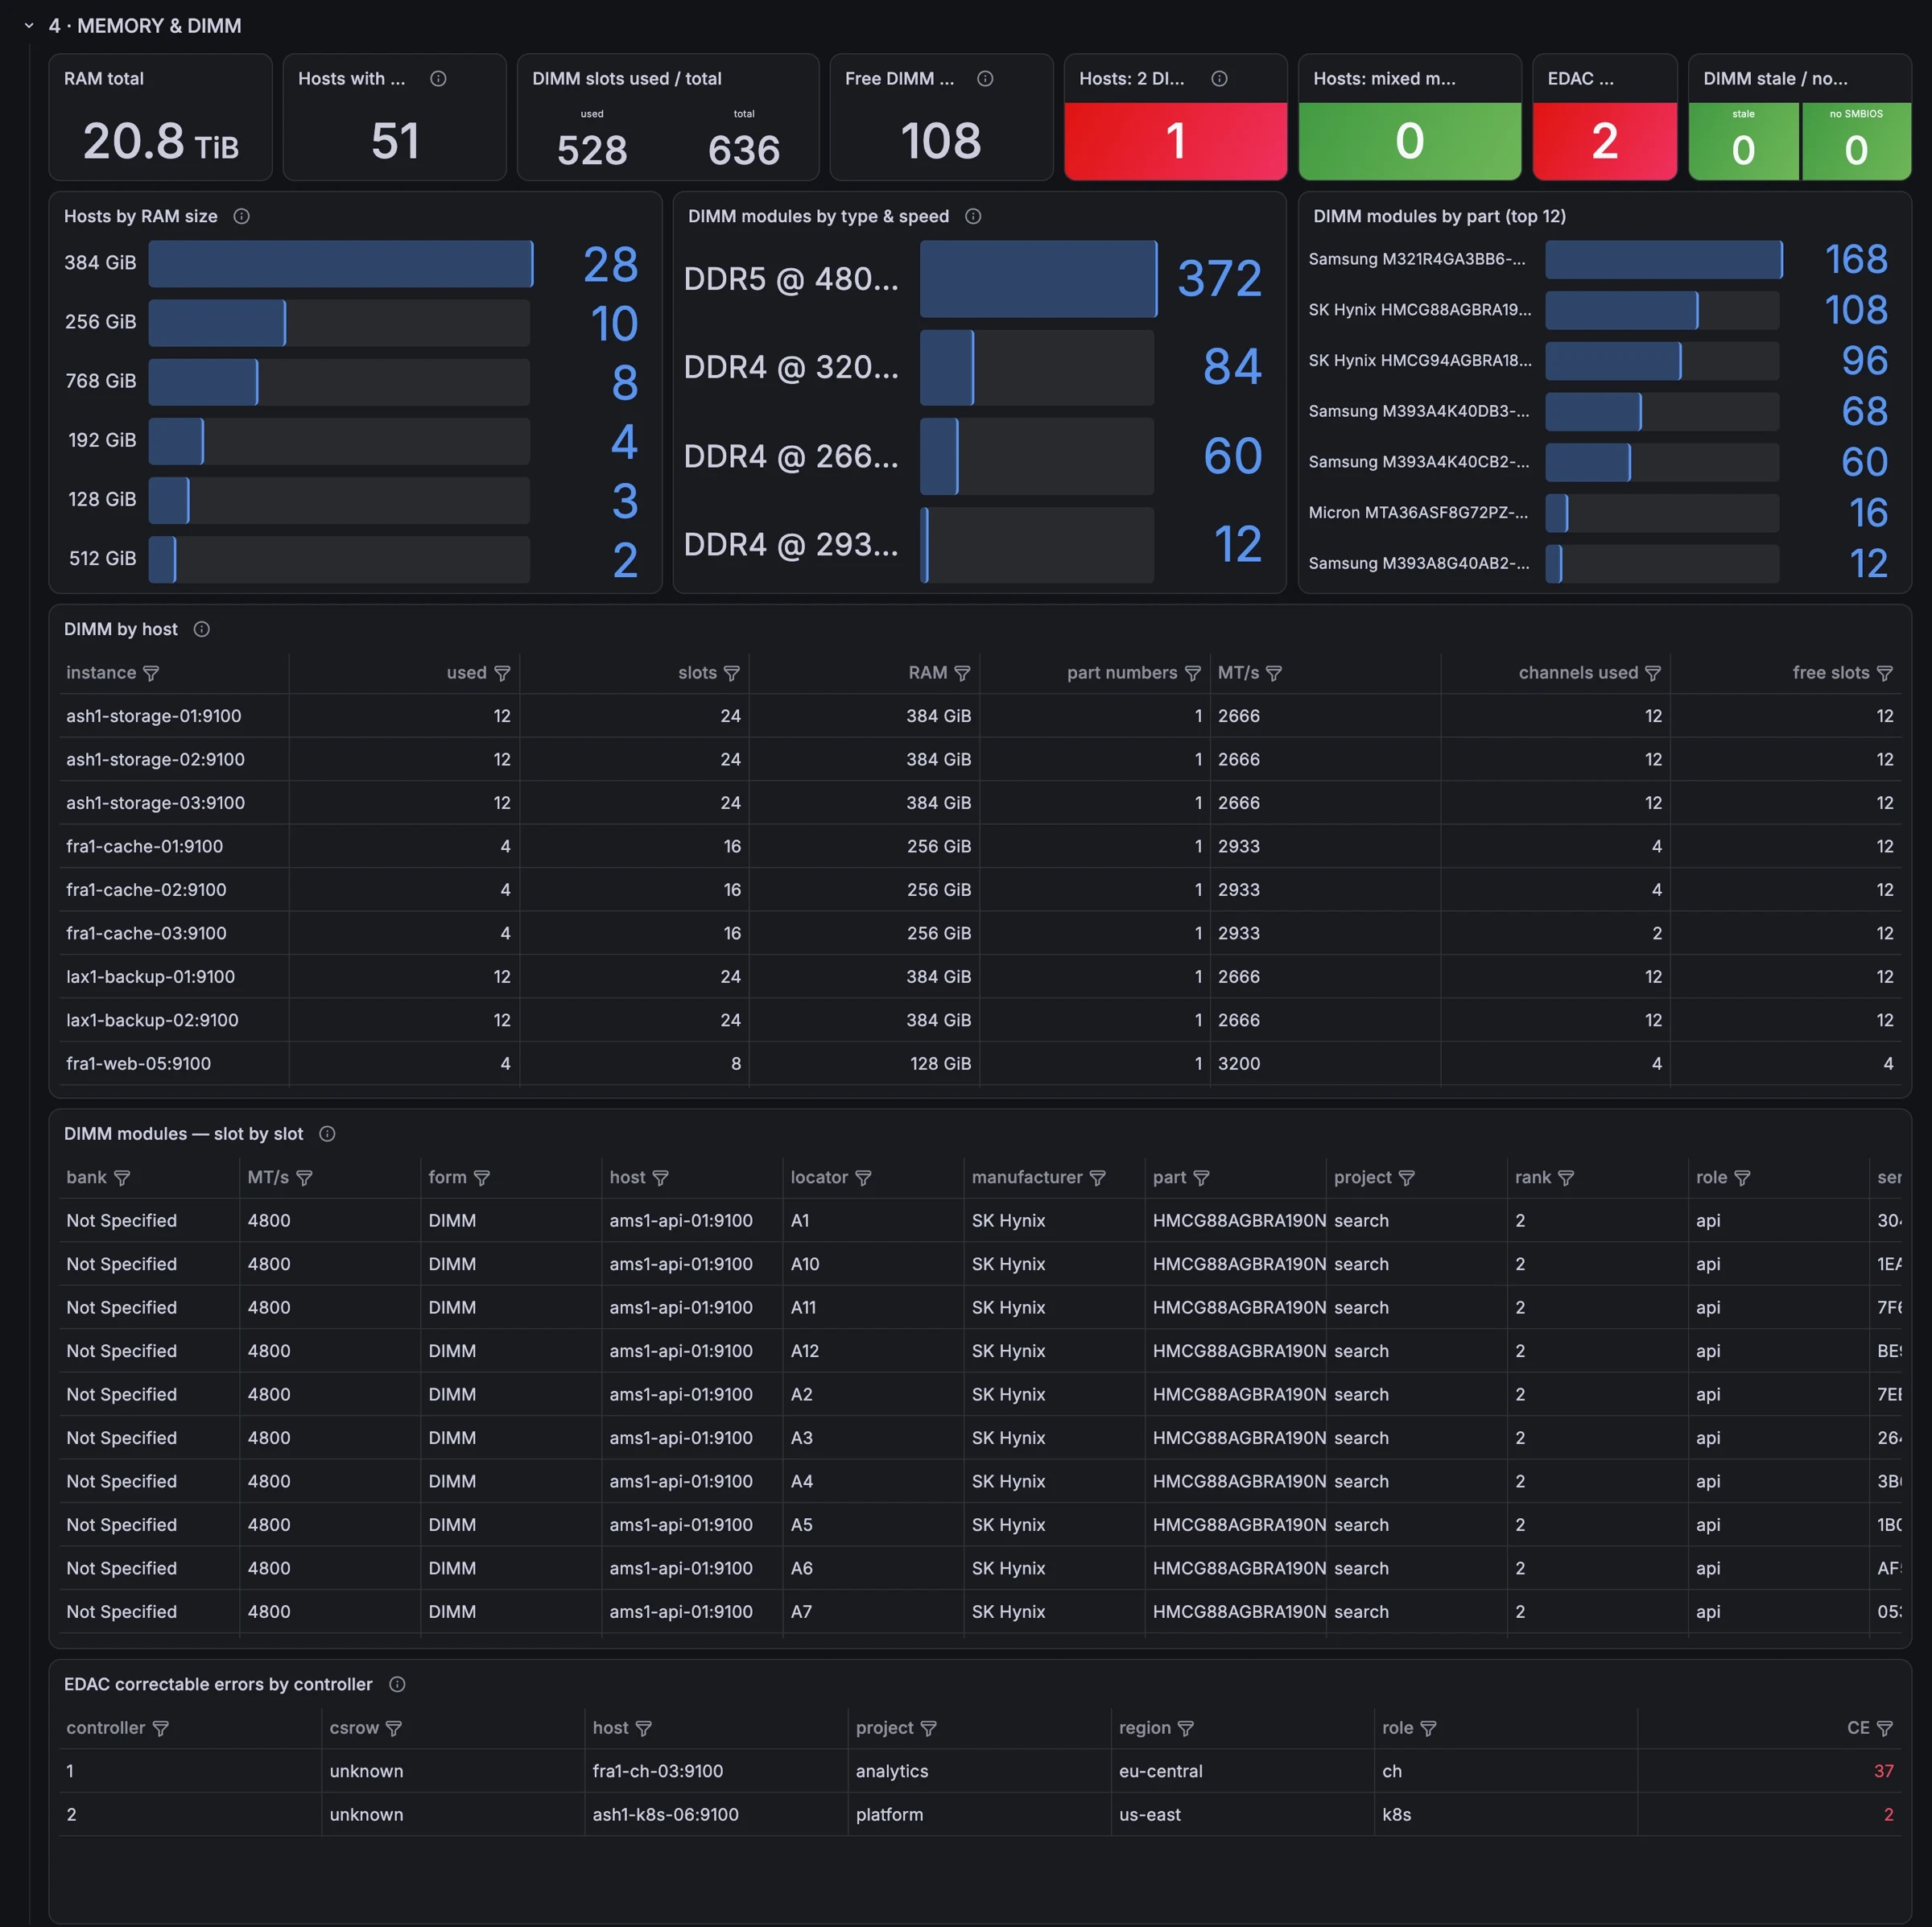
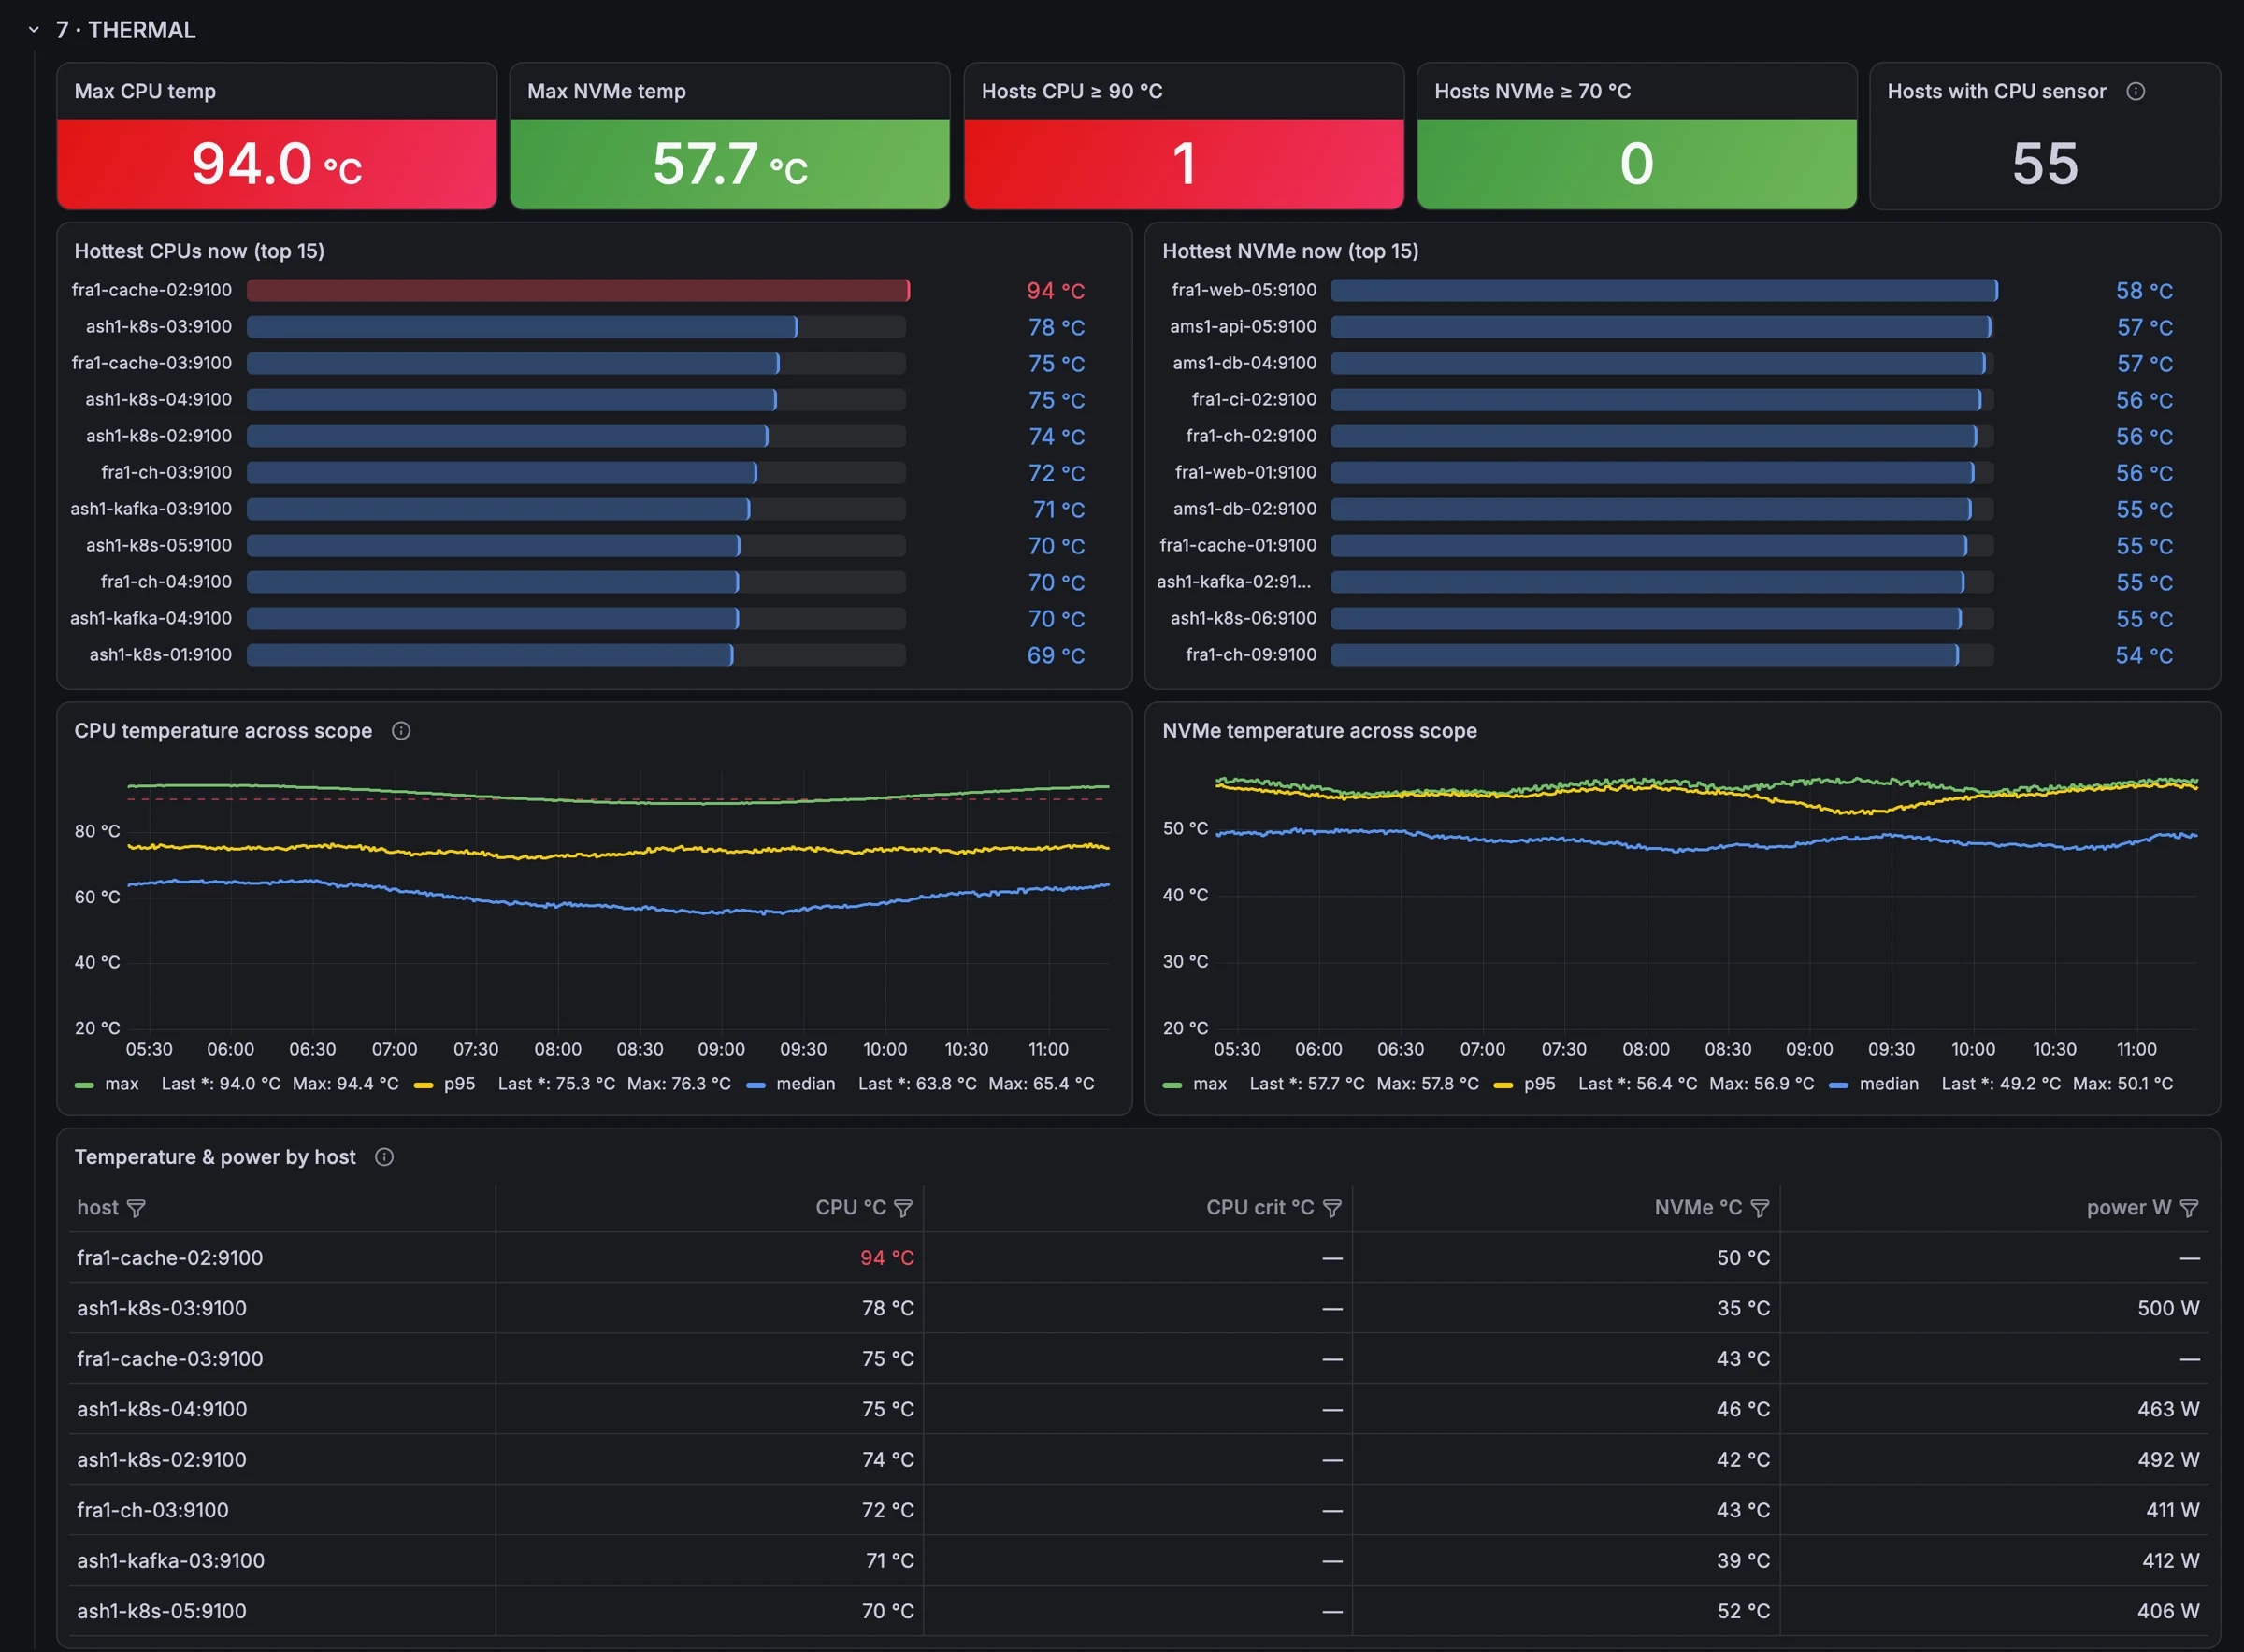
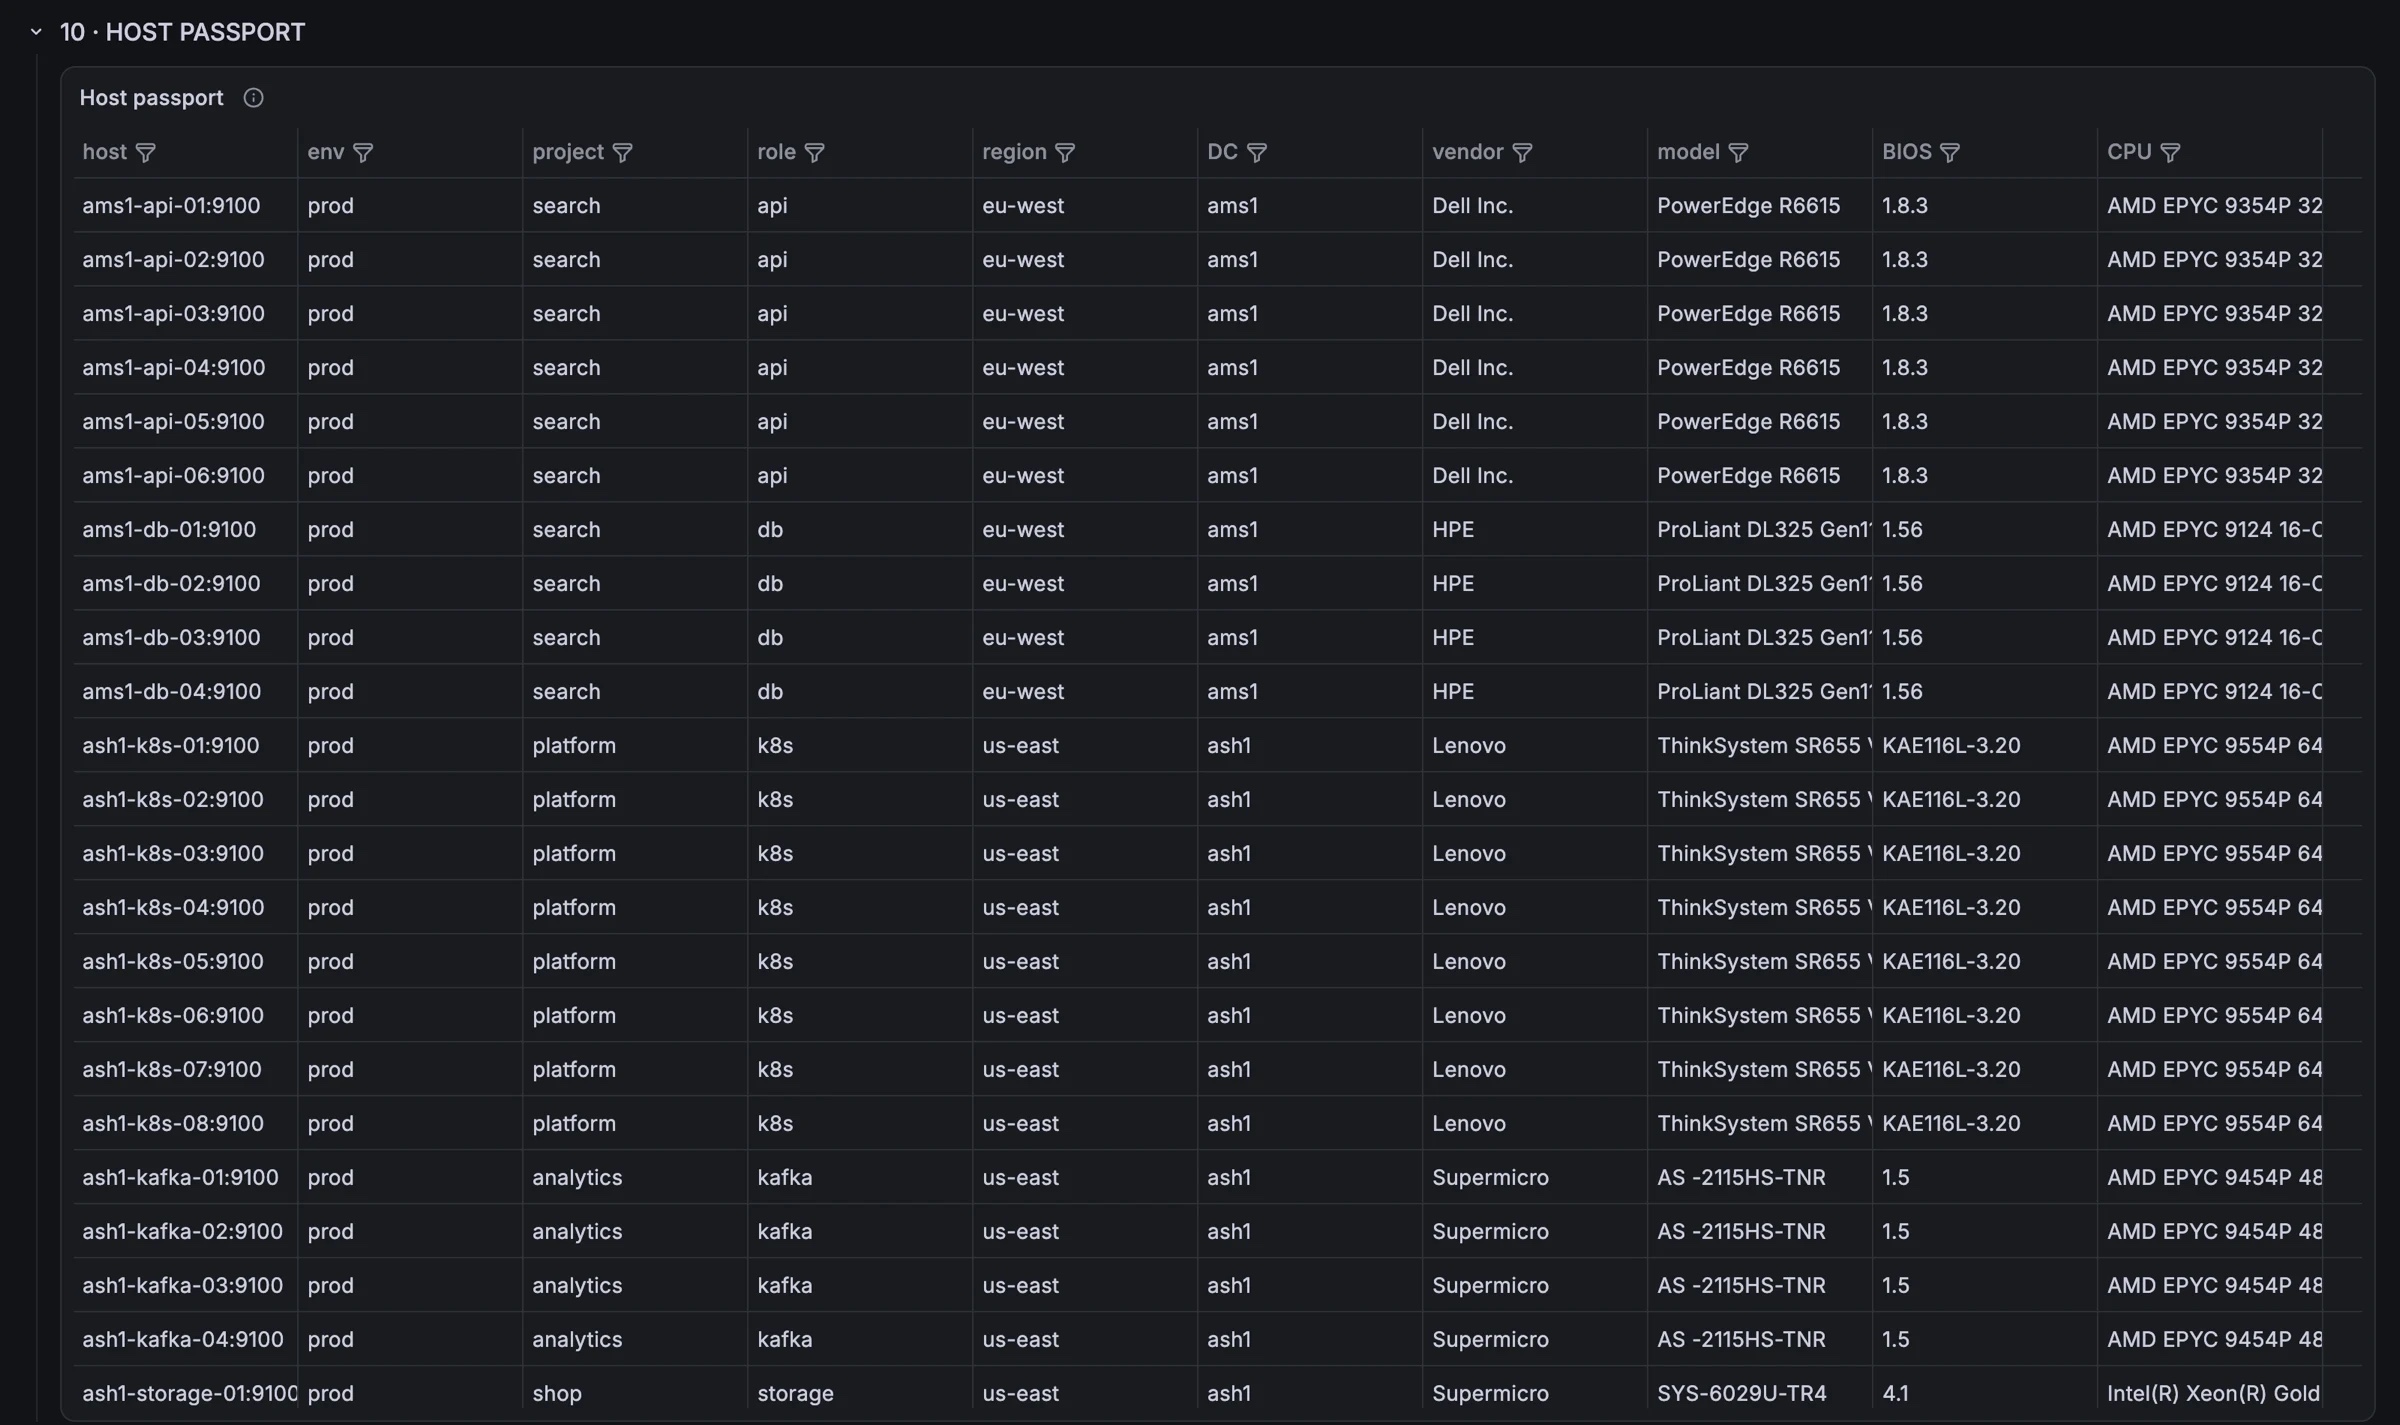
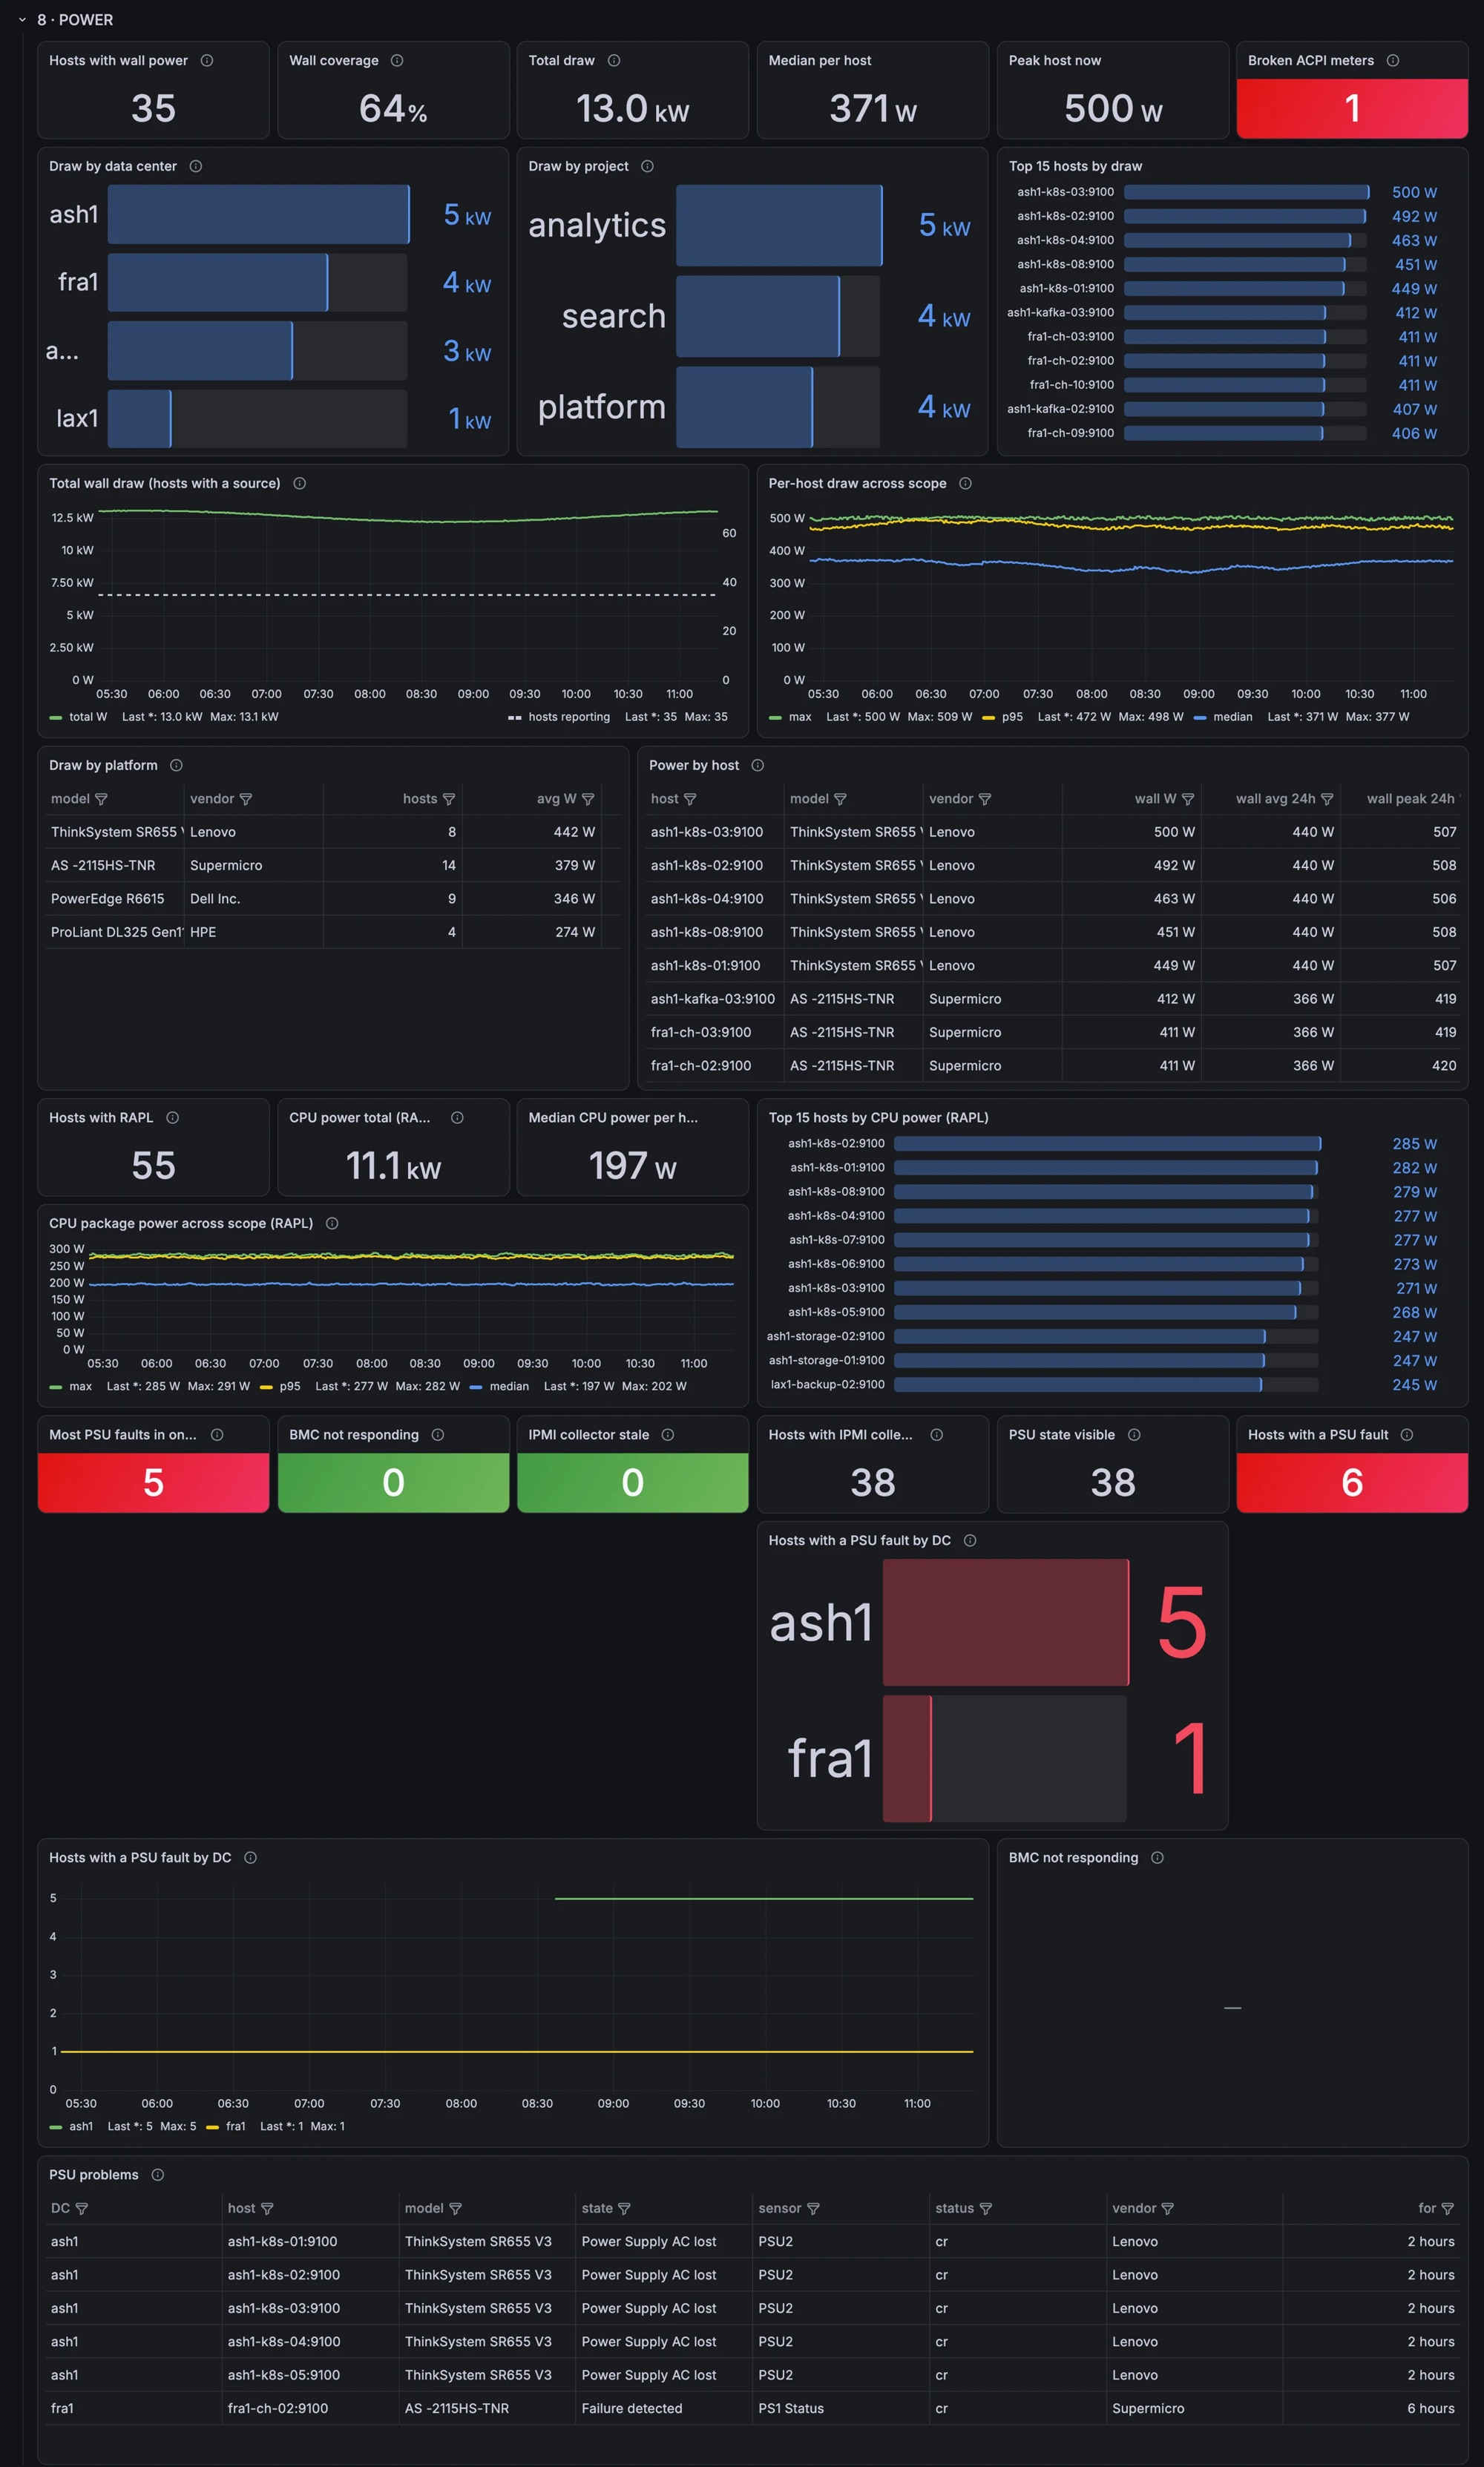
Hardware inventory and health for a fleet of servers, built from plain node_exporter metrics.
It answers questions like which hosts run old BIOS, where can I add RAM without replacing modules, which boxes are stuck at a low CPU clock, what does this server model draw from the wall and which hosts have a degraded array, a dying NVMe or a lost PSU.
What's inside
- Overview: hosts, vendors, platforms, CPU models, cores/threads, RAM, NVMe drives, data centers
- Health: signals that usually have no alerts (EDAC errors, NVMe spare/warnings, degraded RAID, capped CPU clocks, hot CPUs and NVMe, DIMMs stacked on few channels, non-tsc clocksource, link flaps, PSU faults, hung BMCs) plus one table with every problem host
- Platform, CPU, Memory & DIMM, Storage, Network, Thermal, Power, OS & firmware: one row per hardware domain
- Host passport: one row per host with everything merged
Physical hosts by default; switch Kind to see VMs (detected by bios_vendor).
Requirements
- Grafana 10.1+ (tested on 10.1.1 and 13.2.4)
- Prometheus or VictoriaMetrics; all queries are plain PromQL
- node_exporter 1.3+ with
--collector.cpu.info(for CPU models and microcode)
Optional target labels env, project, role, region, dc drive the filters and the per-DC / per-project breakdowns. Hosts without them still show up under All.
Some panels (DIMM inventory, IPMI power and PSU state, CPU boost/governor, NVMe SMART) read metrics from extra textfile collectors. Without them those panels stay empty and the rest works. The metric contract is in the GitHub README.
Screenshots show a synthetic 55-host fleet, not a real environment.
Source, docs and issues: https://github.com/exxmanster/grafana-fleet-hardware
Data source config
Collector config:
Upload an updated version of an exported dashboard.json file from Grafana
| Revision | Description | Created | |
|---|---|---|---|
| Download |