
AWS RDS CloudWatch
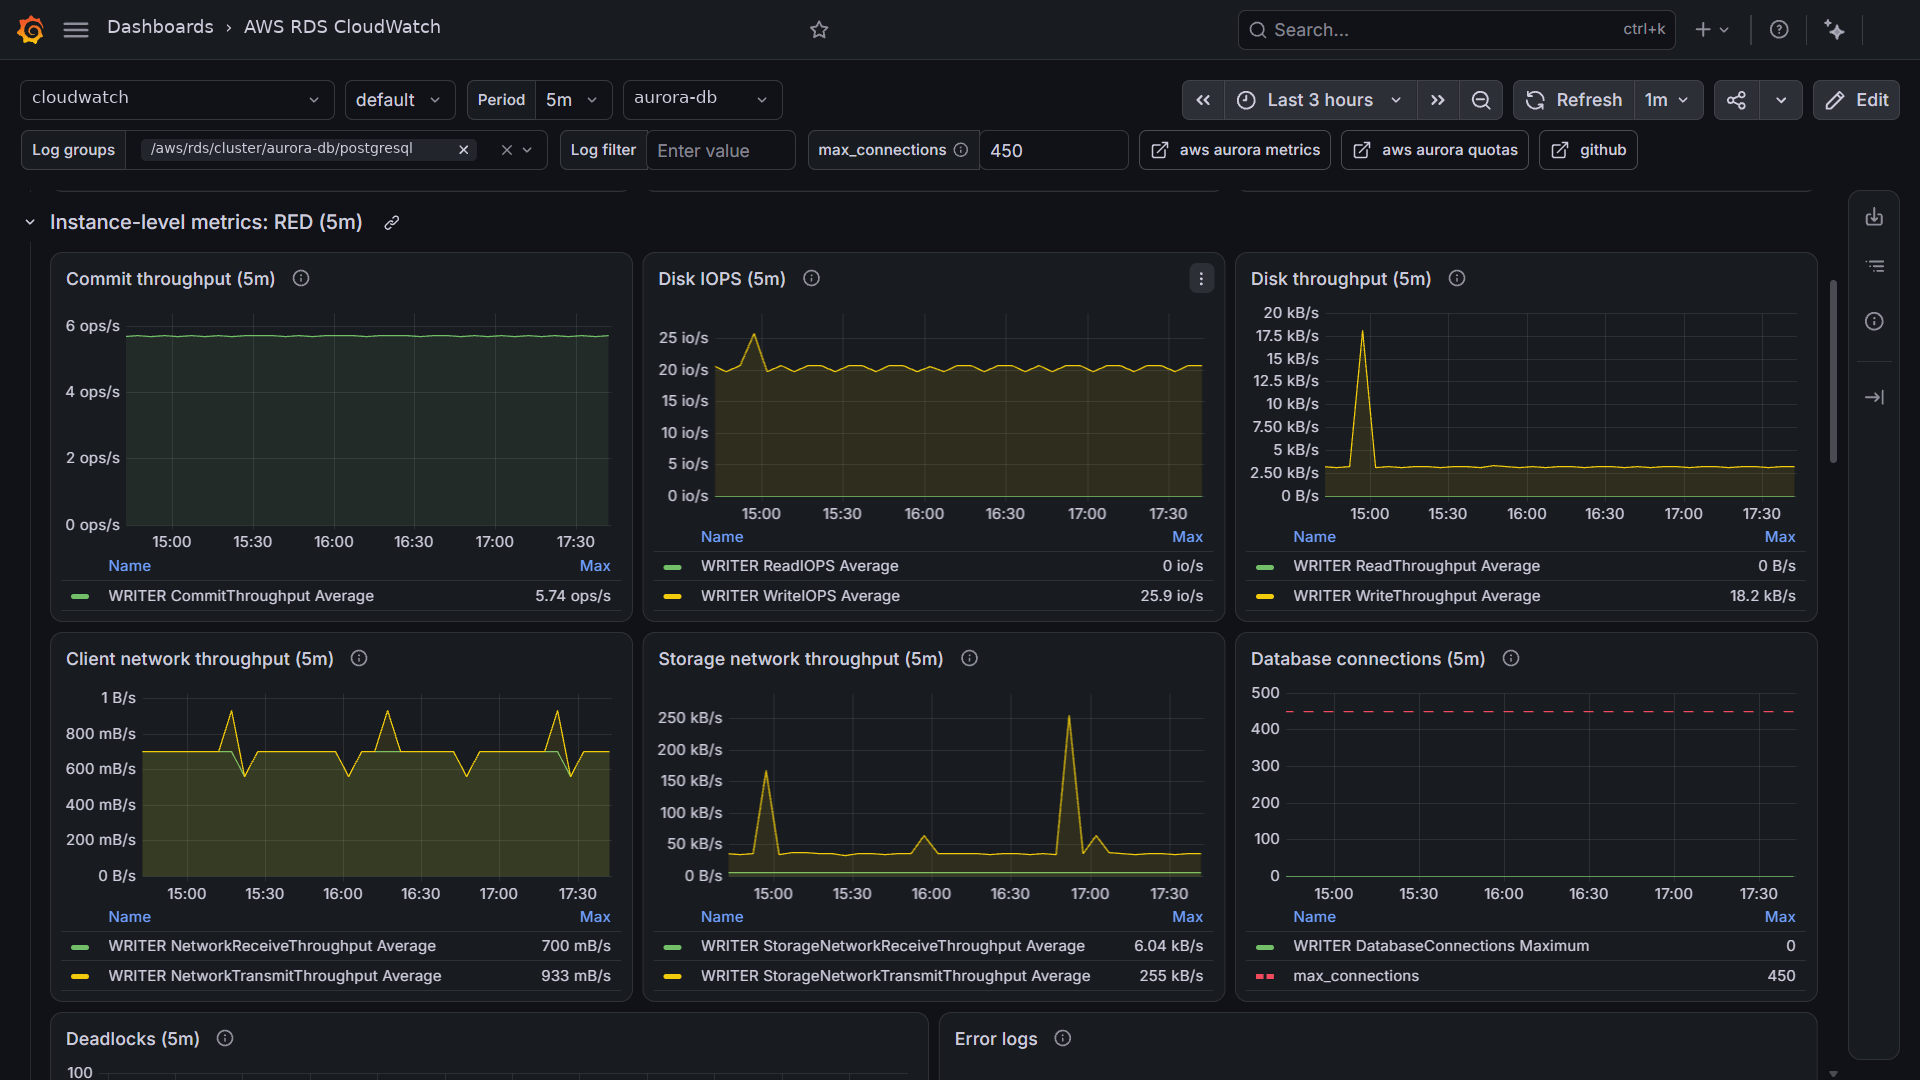
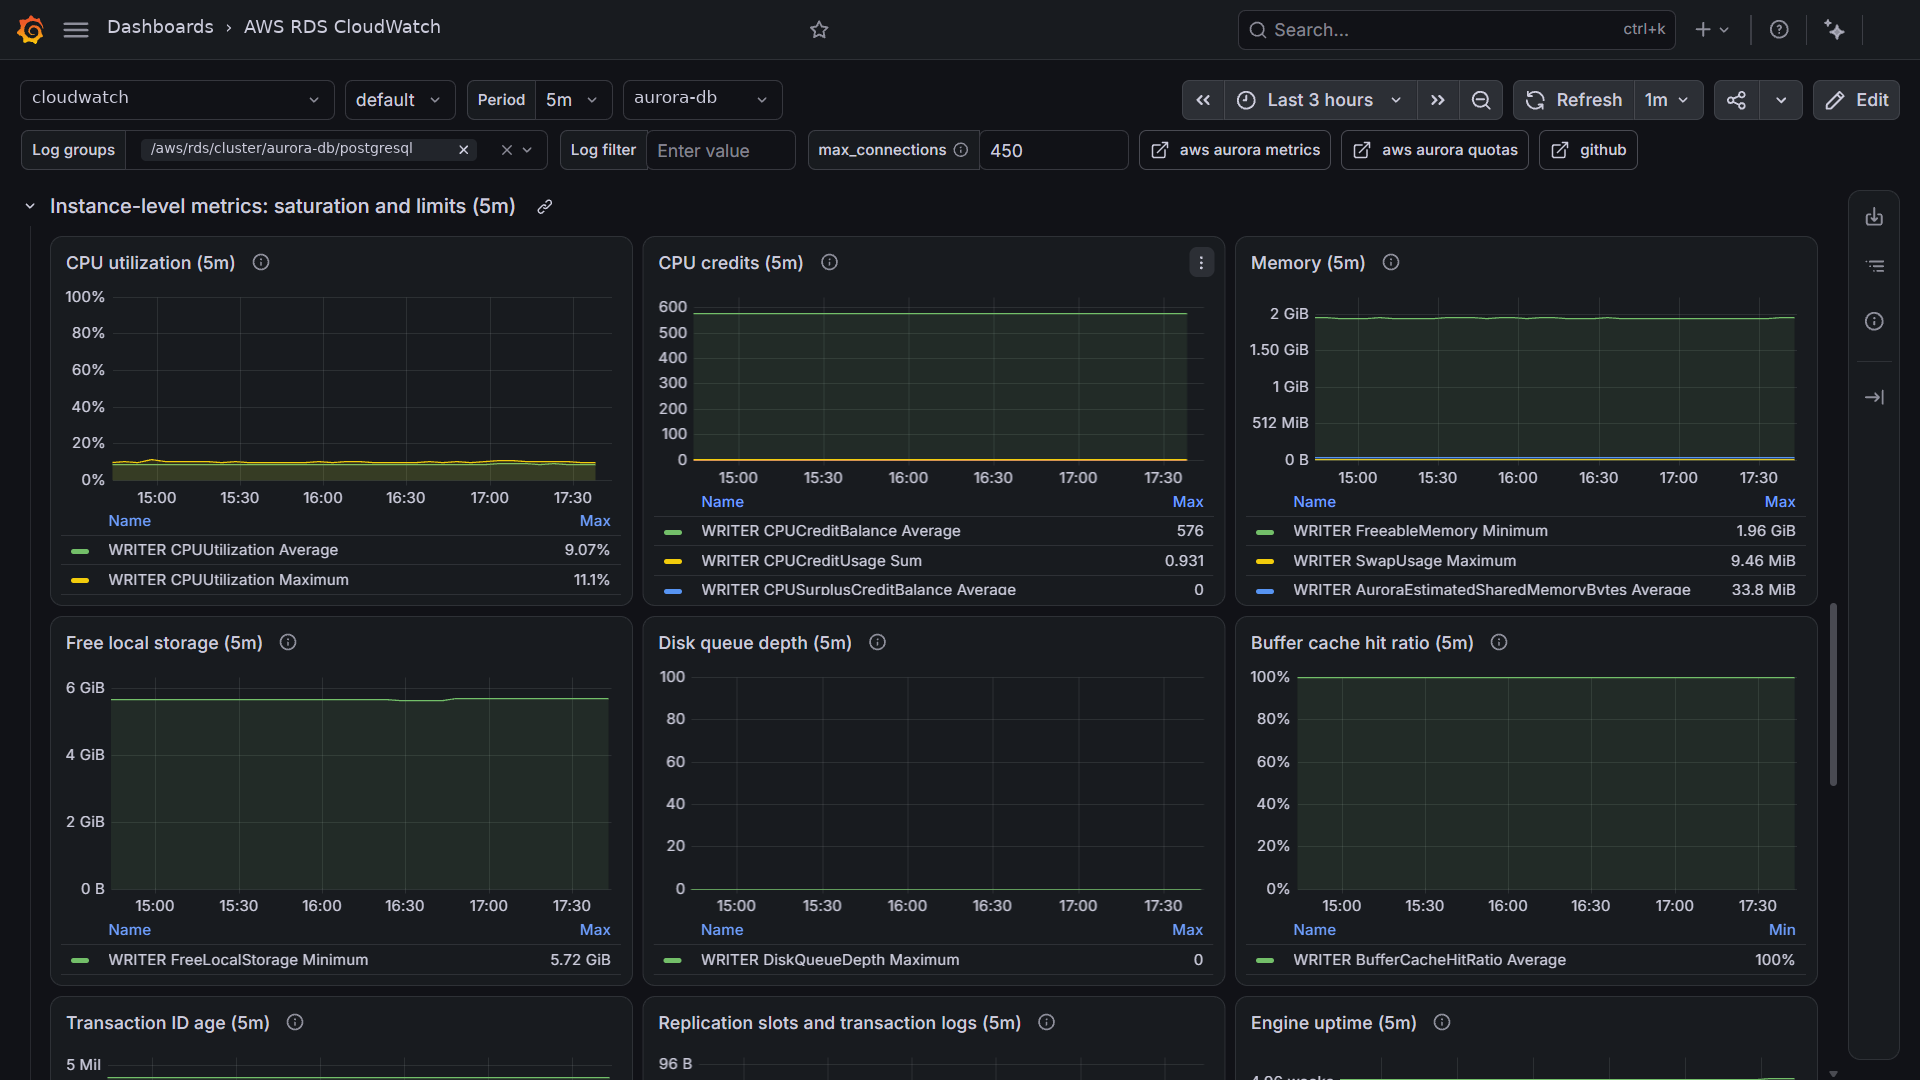
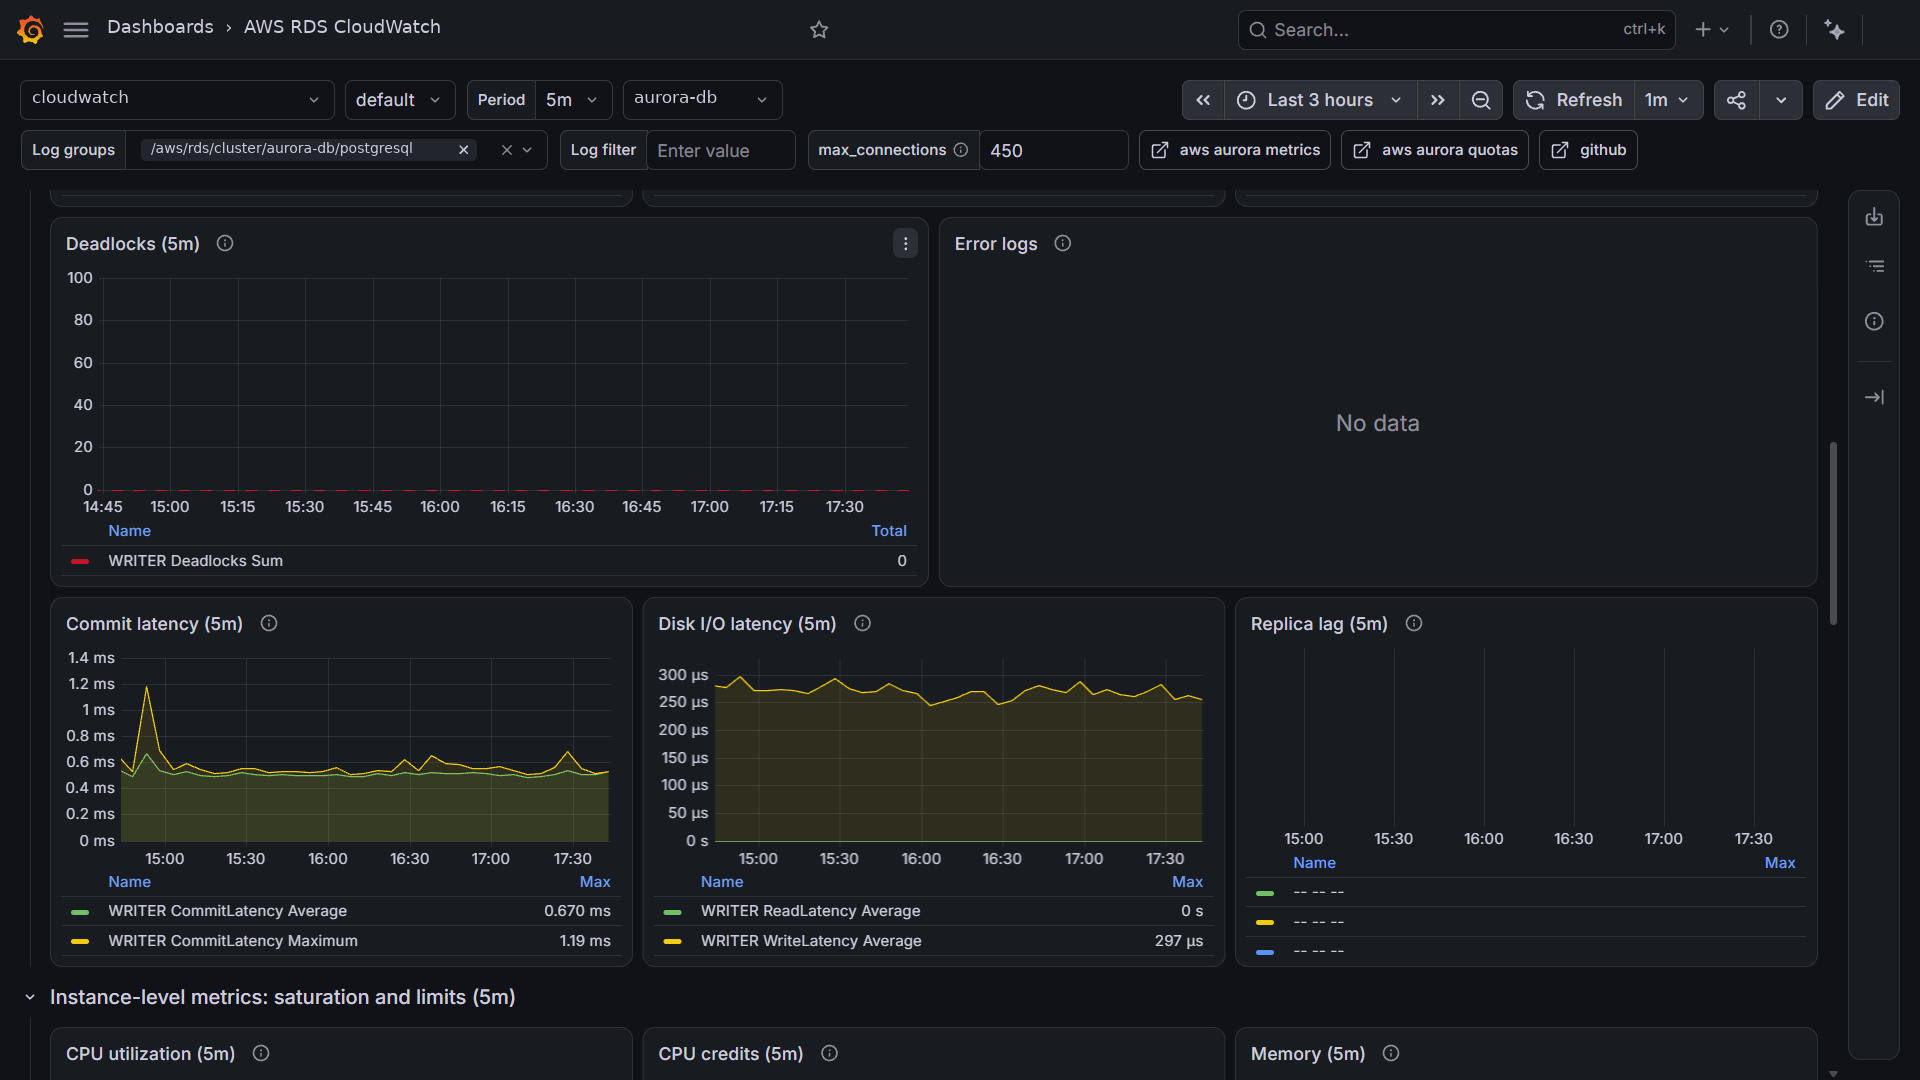
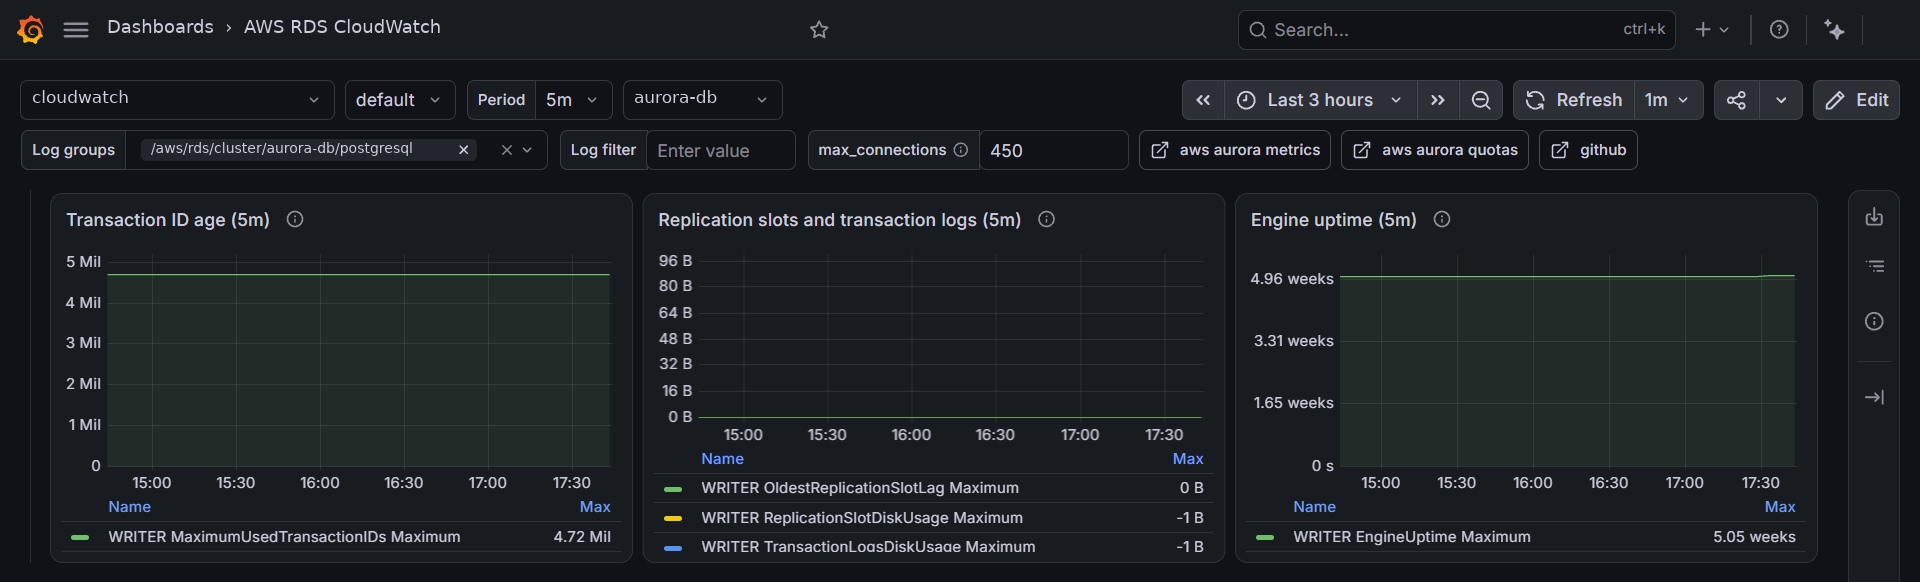
AWS RDS Aurora PostgreSQL telemetry from the AWS/RDS CloudWatch namespace (RED method, then saturation and limits), the postgresql log export, account usage against service quotas, and optional Performance Insights and Enhanced Monitoring rows.
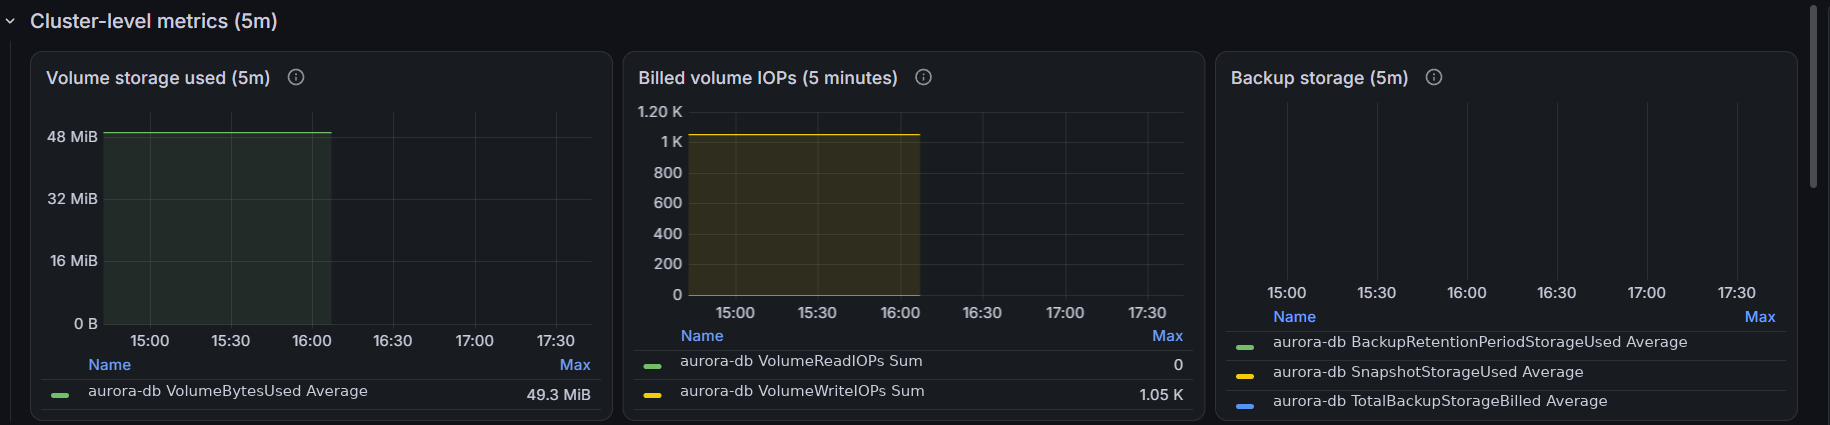
AWS RDS Aurora
Dashboard: https://grafana.com/grafana/dashboards/25949
Quotas: https://docs.aws.amazon.com/AmazonRDS/latest/AuroraUserGuide/CHAP_Limits.html
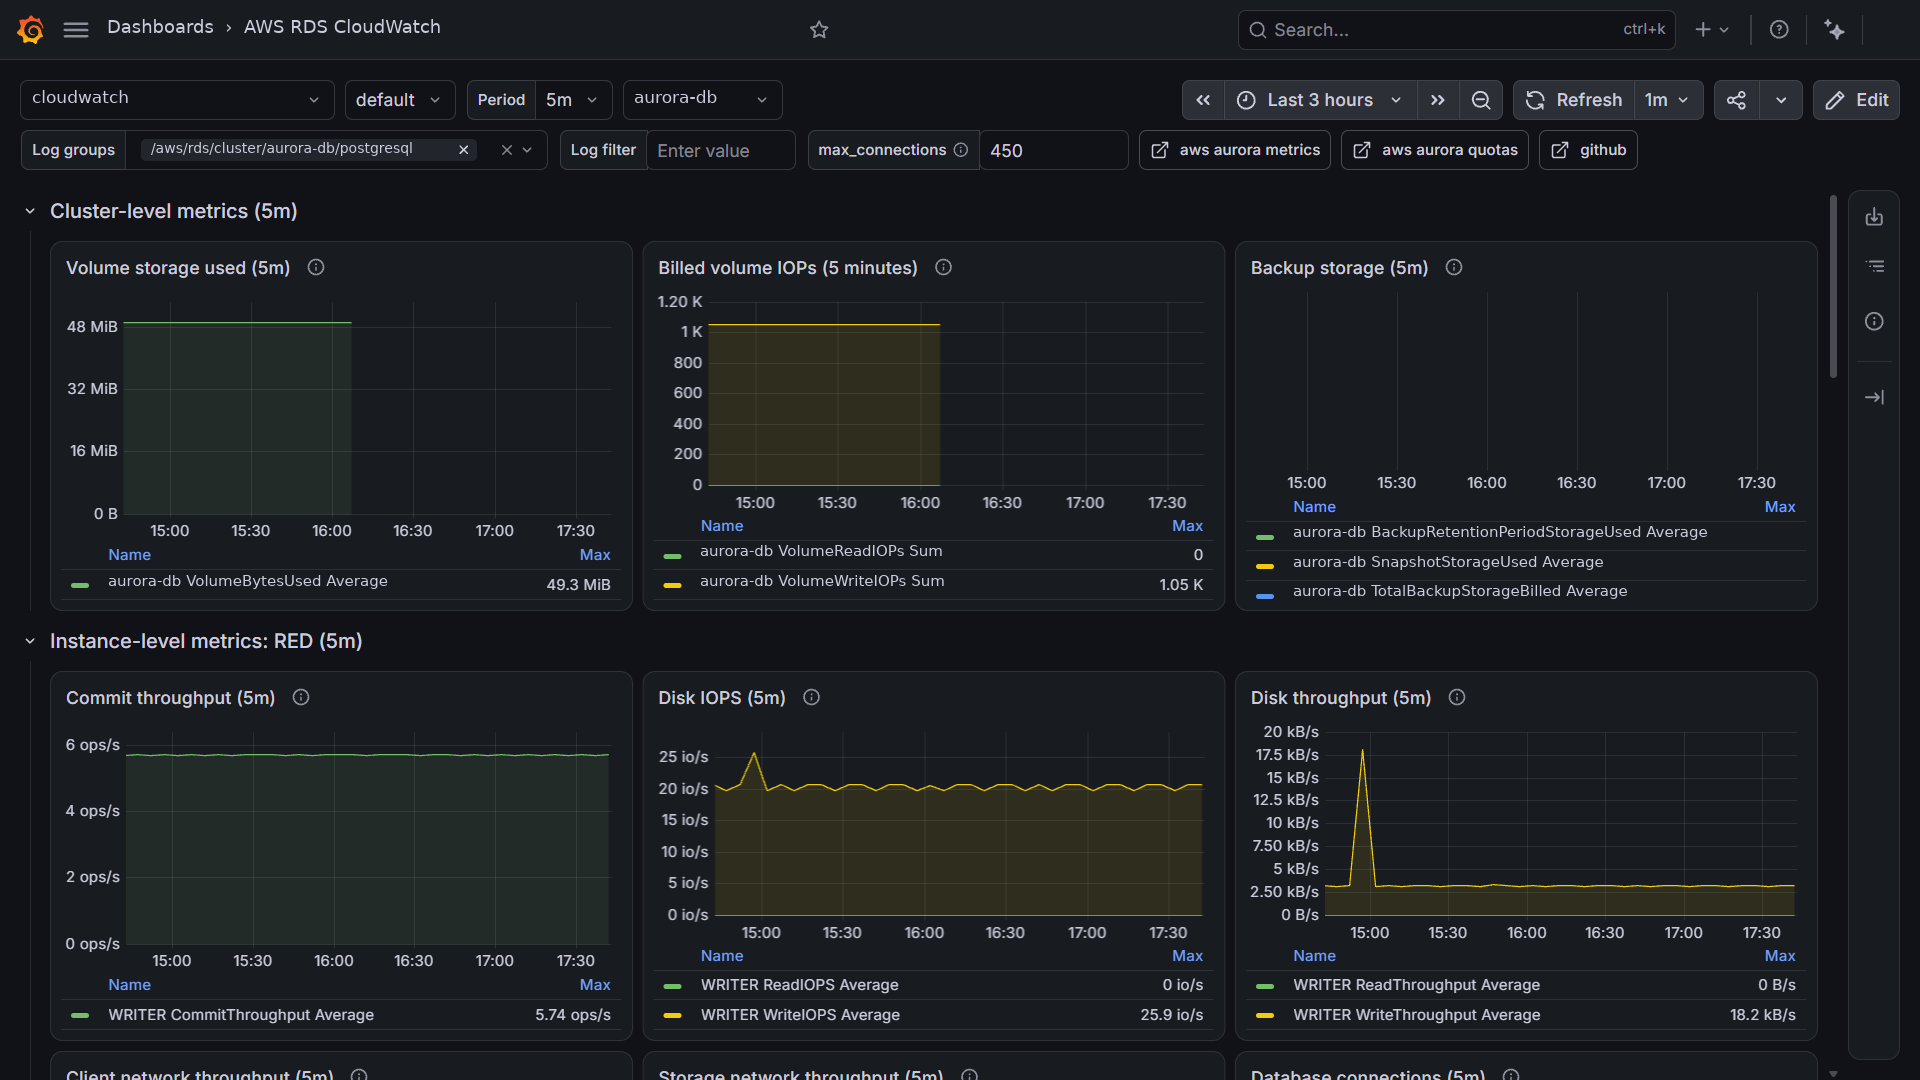
Cluster-level metrics
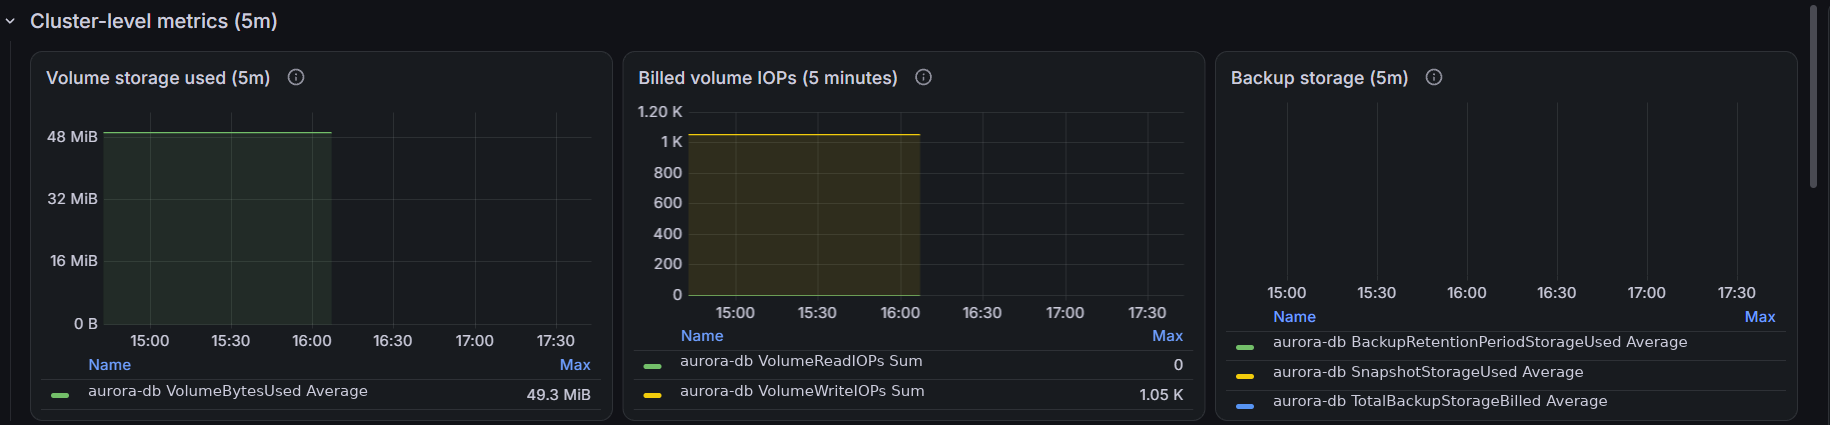
Instance-level metrics: RED
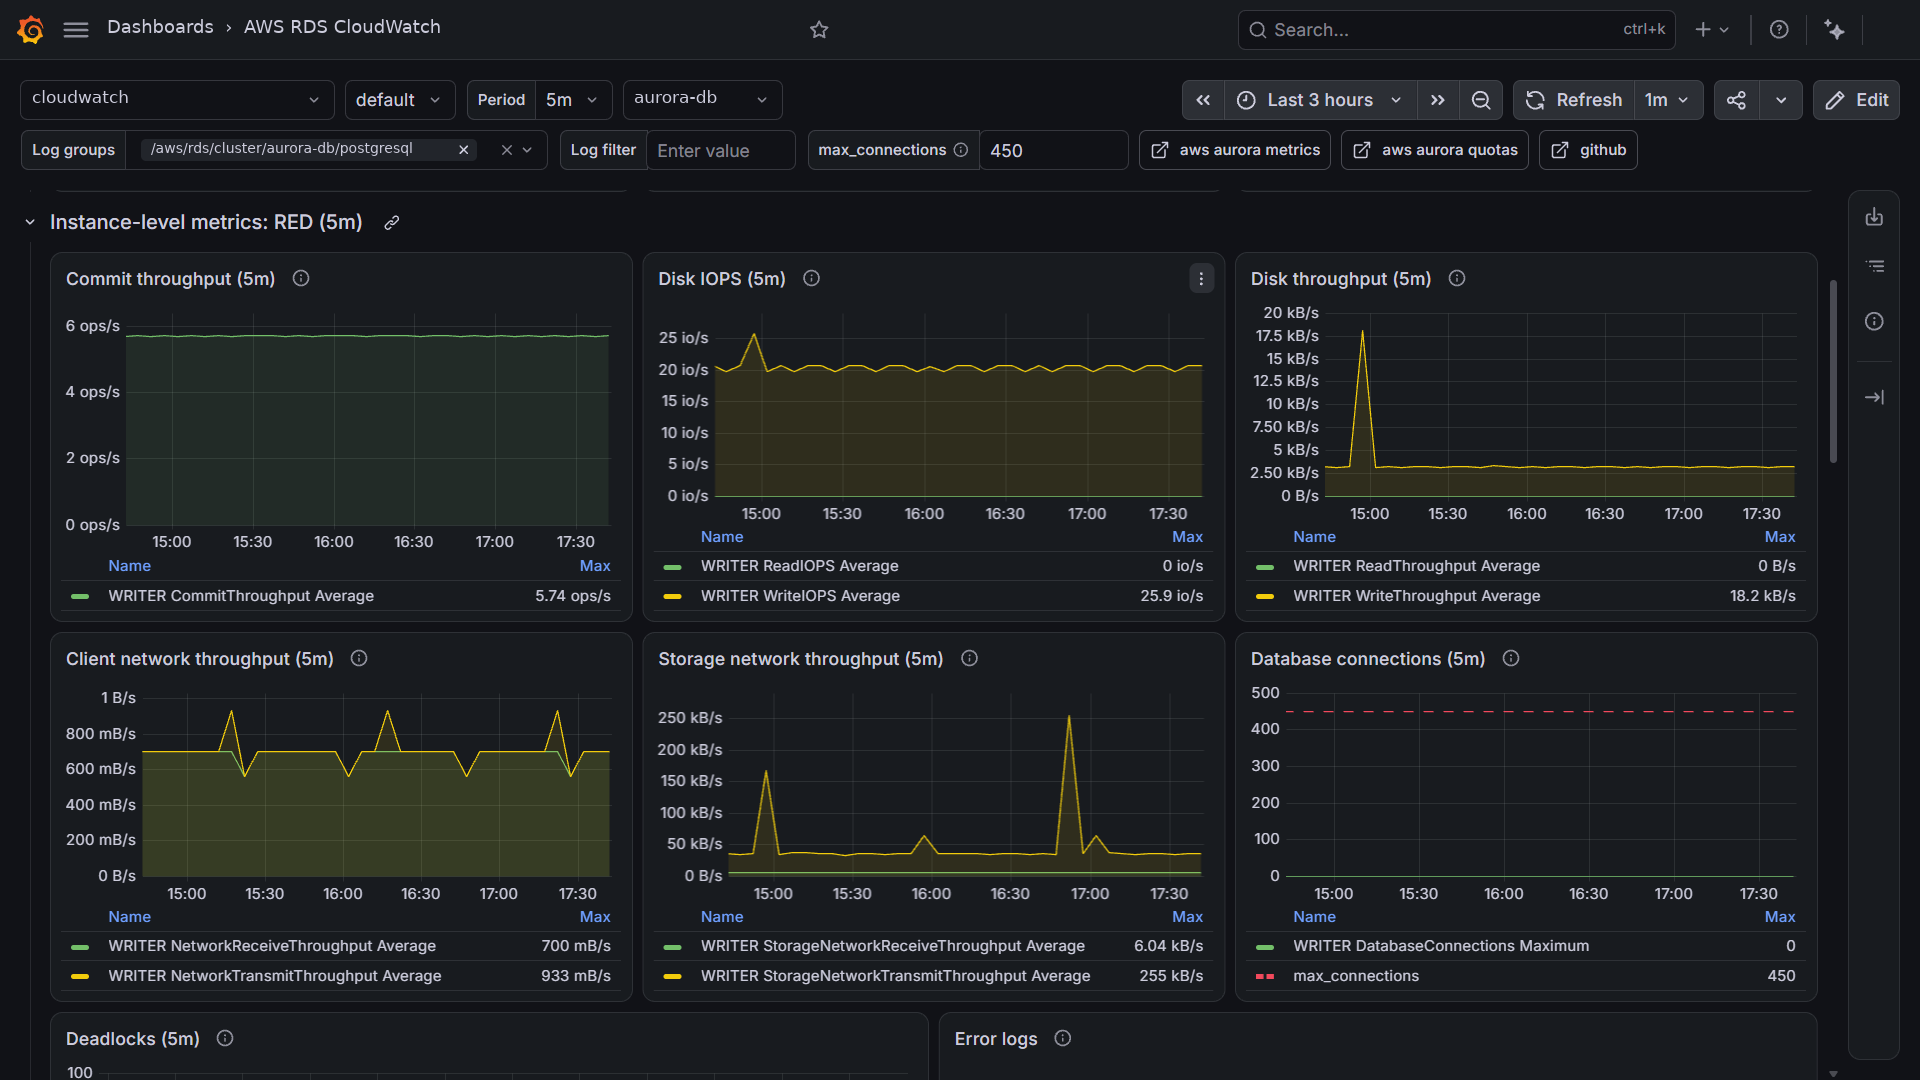
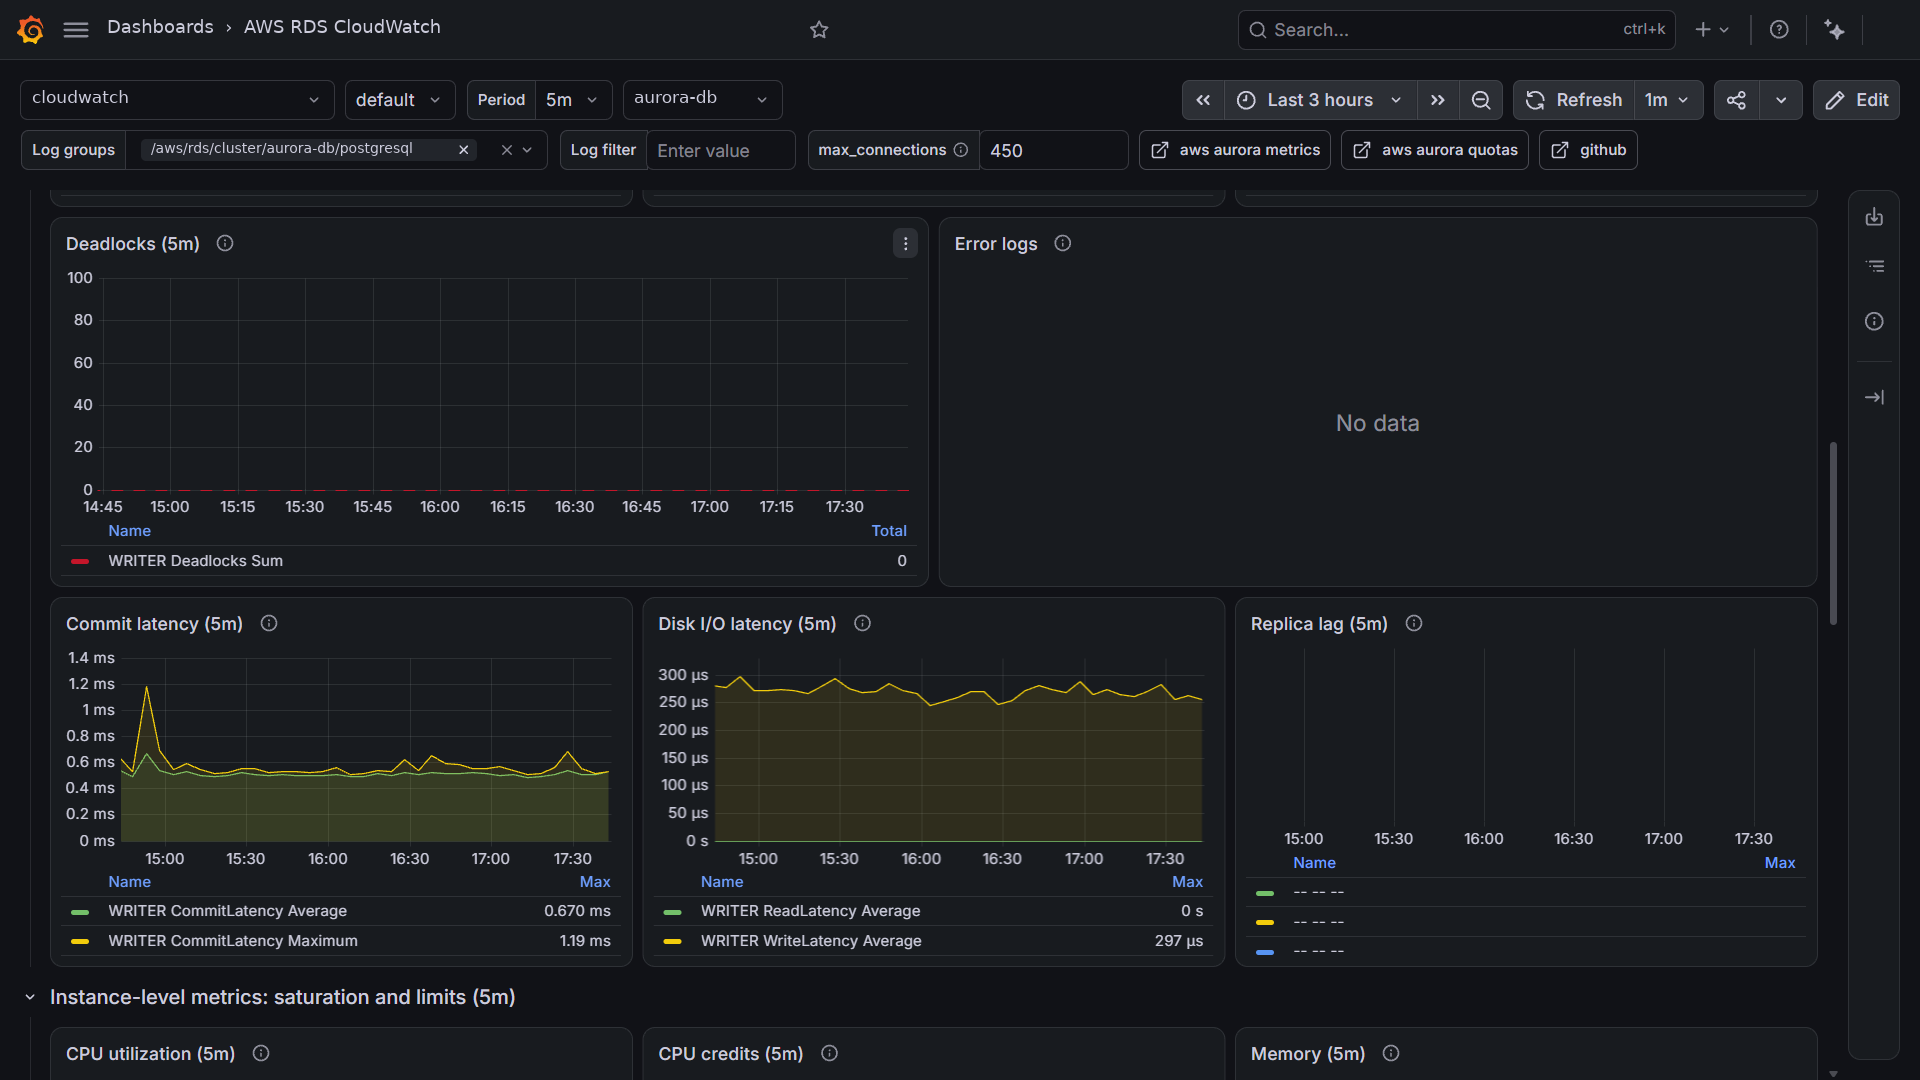
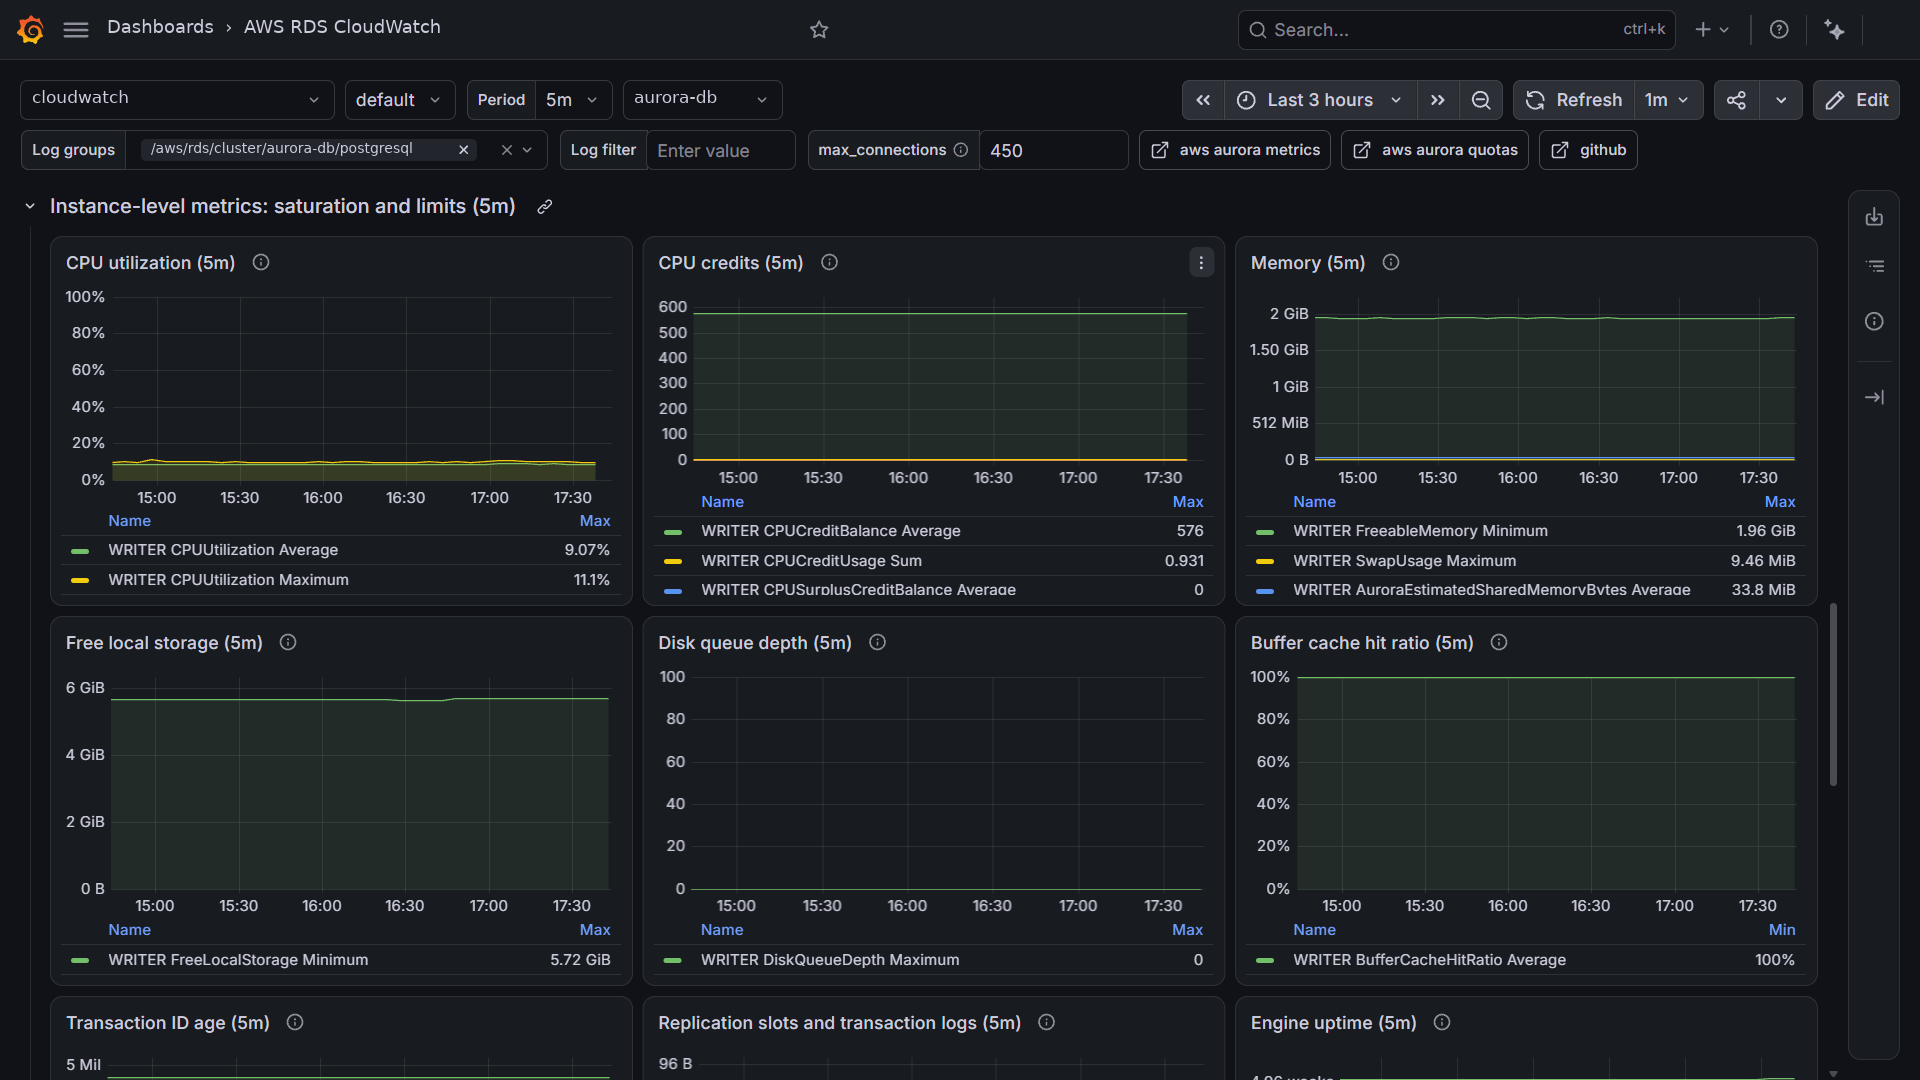
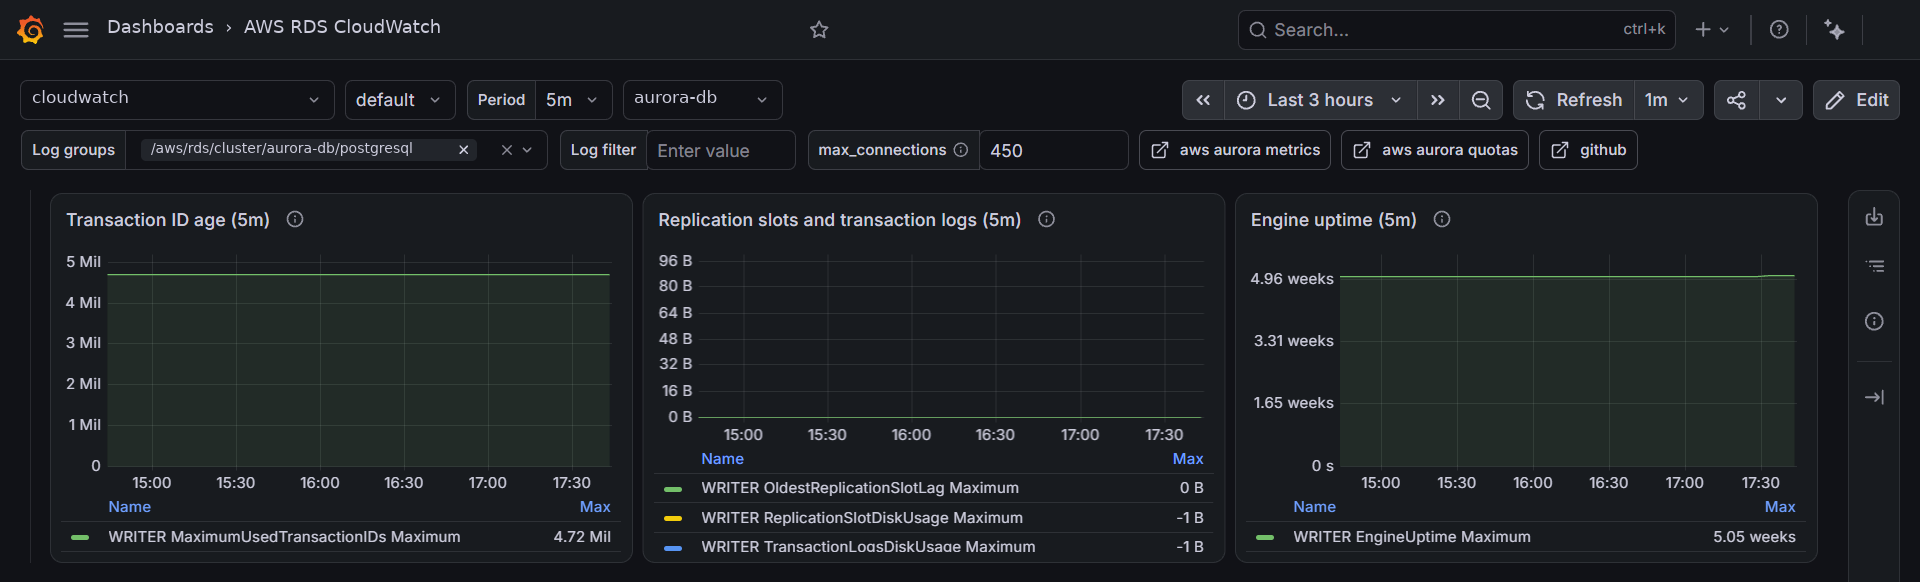
Instance-level metrics: saturation and limits
Data source config
Collector type:
Collector plugins:
Collector config:
Revisions
Upload an updated version of an exported dashboard.json file from Grafana
| Revision | Description | Created | |
|---|---|---|---|
| Download |

AWS

Easily visualize and alert on more than 60 Amazon Web Services (AWS) resources using the fully managed Grafana Cloud platform.
Learn more