
Minecraft server (minecraft-exporter)
A Minecraft server through WorldAPI and minecraft-exporter: performance, worlds, players, activity, chat, and events.
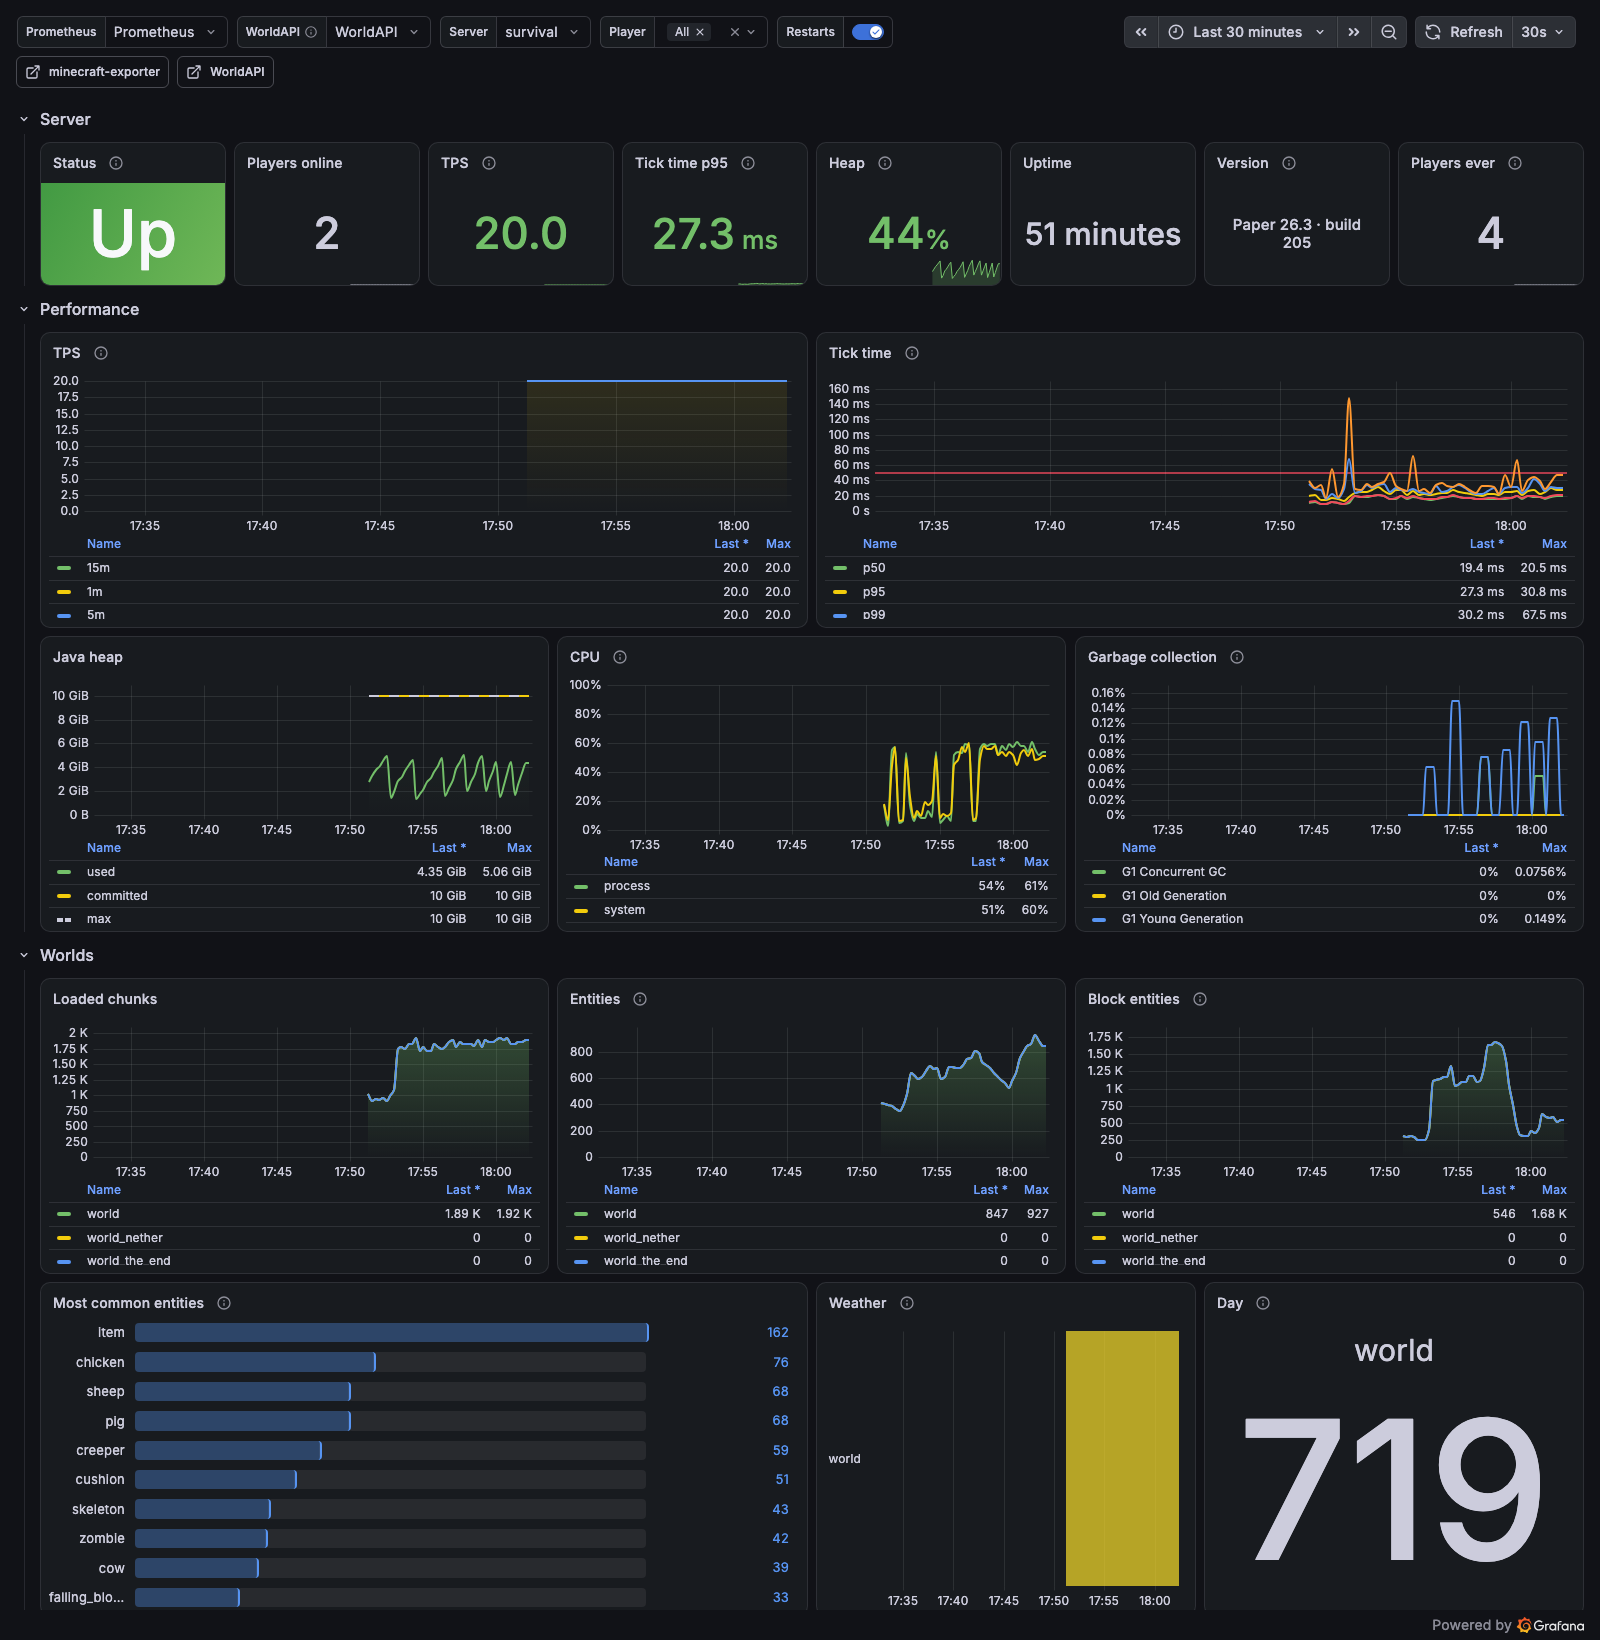
A dashboard for a Minecraft server: how fast it ticks, what fills its worlds, who plays and what they do, and the chat. It draws the metrics of minecraft-exporter, which reads a Paper server through WorldAPI.
What's on it
- Server at a glance: up or down, players online, TPS, tick time, heap, uptime, version.
- Performance: TPS, tick times by percentile against the 50 ms line, heap, CPU, garbage collection.
- Worlds: loaded chunks, entities, block entities, the most common entities, weather, the day count.
- Players: who's online with health, food, level, and ping, who played most in the time range, and every player's lifetime statistics.
- Activity: joins, deaths, and advancements over time, deaths by cause and killer, new players, and other plugins' events.
- Chat and events as tables, read straight from WorldAPI.
- With a WorldAPI token behind the exporter: the host's load, memory, and disk; what lags in each world, down to the busiest chunks and their hoppers; plugins, bans, and Mo’Bosses; console warnings and errors by source; where each player stands, and who chats how much.
Setup
- Install WorldAPI on your Paper server and run minecraft-exporter next to Prometheus.
- Import this dashboard and pick your Prometheus.
- Optional, for the chat, event, and console tables: install the Infinity data source, point it at your WorldAPI (
http://your-server:8110/api/v1) with a bearer token, and pick it in the “WorldAPI” variable.
Keep it private when a token feeds it. Any Grafana viewer can send any query to its data sources, so a viewer reads everything the WorldAPI token may: chat, the console, every player's position. Turn anonymous access off, keep Grafana behind a login, and give WorldAPI tokens read permissions only; minecraft-exporter's README shows one.
Source, issues, and the changelog: MairwunNx/minecraft-grafana.
Data source config
Collector config:
Upload an updated version of an exported dashboard.json file from Grafana
| Revision | Description | Created | |
|---|---|---|---|
| Download |