
Slurm Exporter - Cluster Overview
Global cluster snapshot: node states, CPU/GPU utilization gauges, job totals, per-partition table (CPU allocation, running/pending jobs), and job state history.
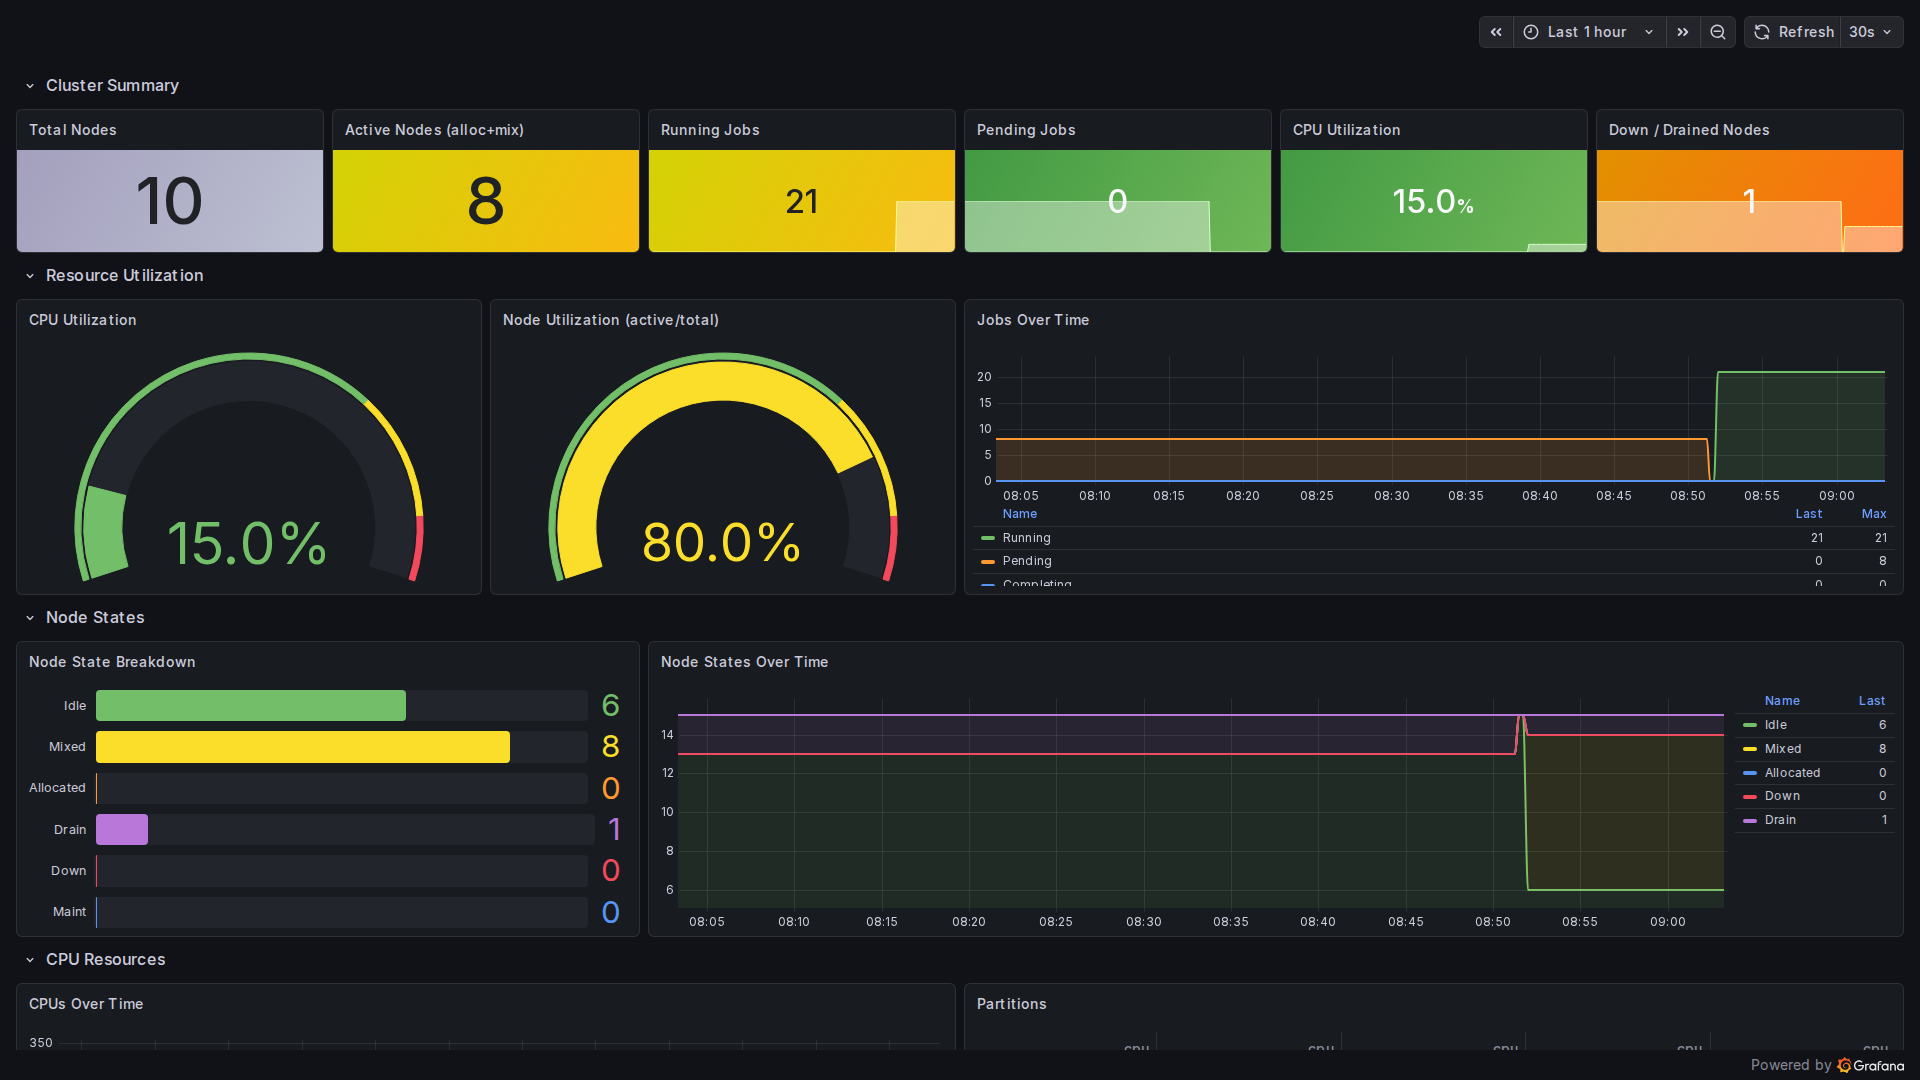
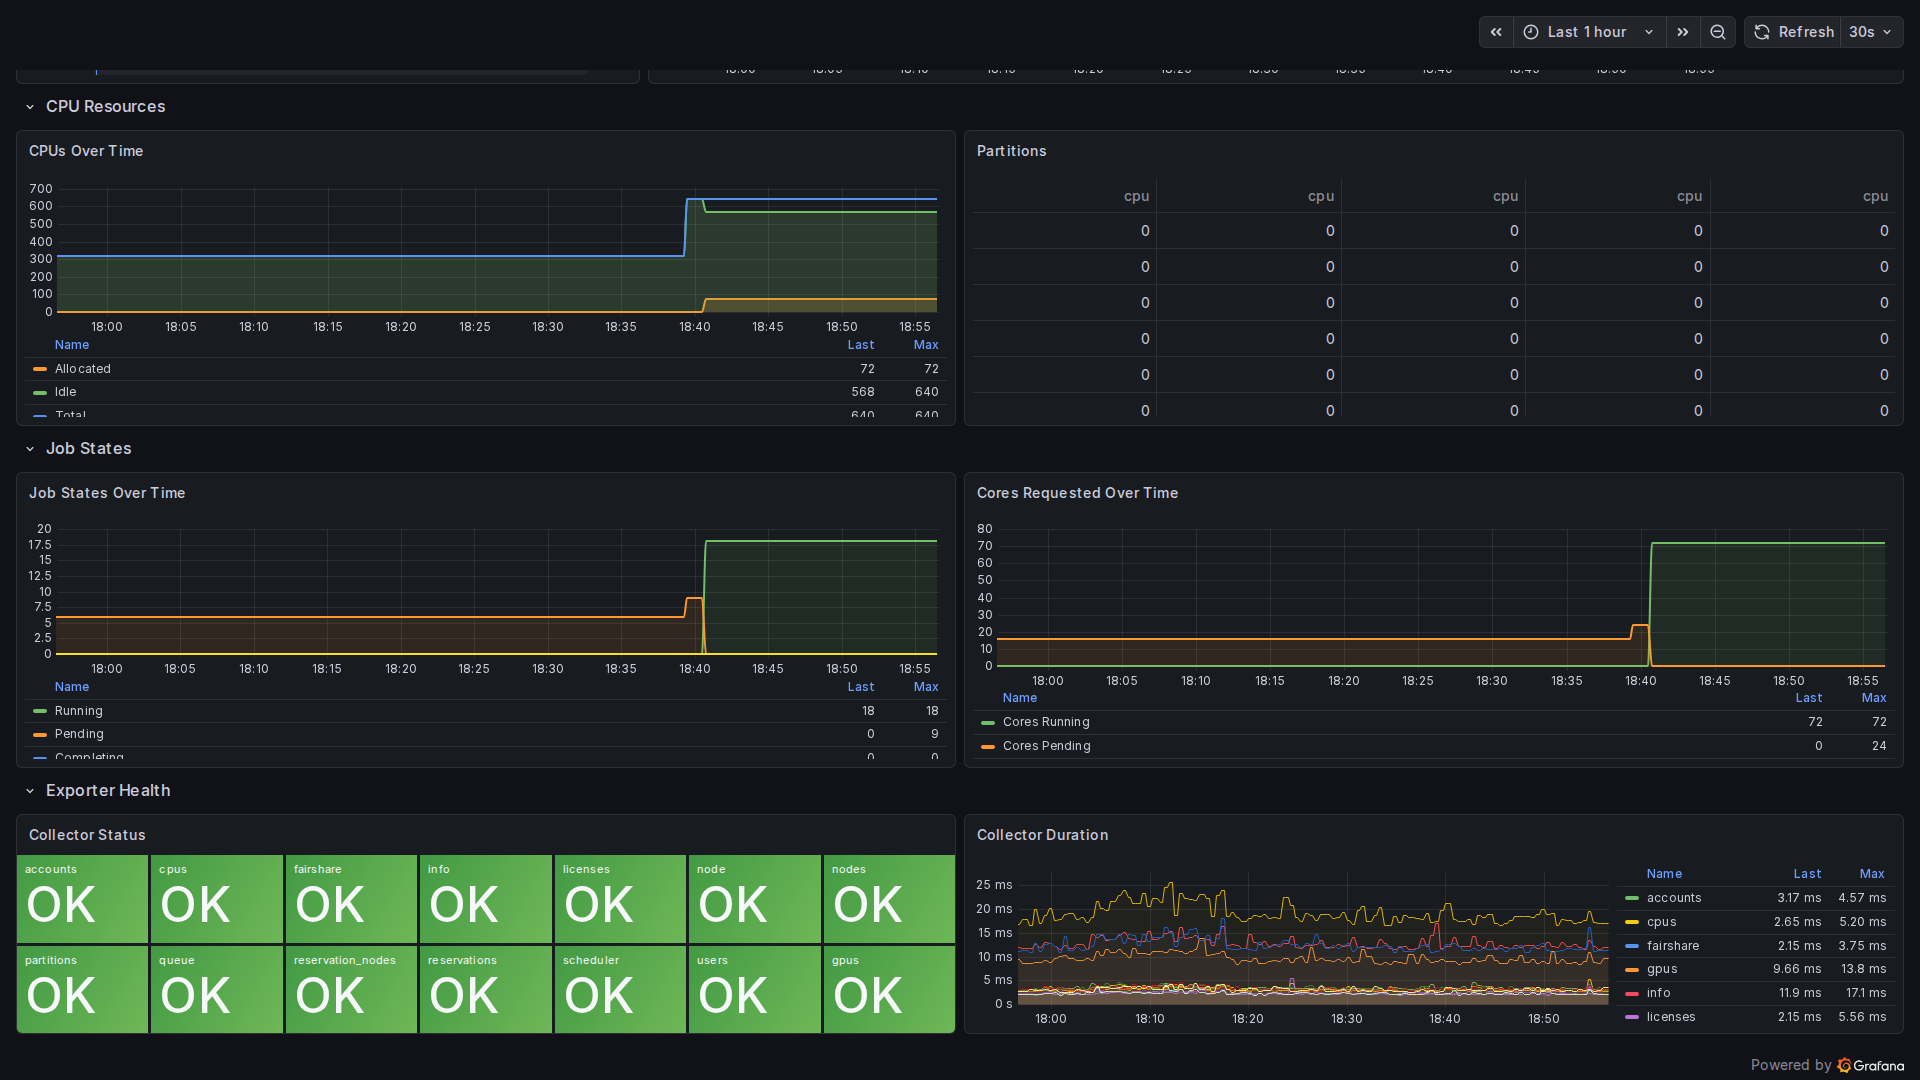
Global cluster snapshot: node states, CPU/GPU utilization gauges, job totals, per-partition table (CPU allocation, running/pending jobs), and job state history.
| Panel | Type | Description |
|---|---|---|
| Total Nodes / Active / Running / Pending / CPU % / Down+Drain | stat | Quick health indicators |
| CPU Utilization | gauge | slurm_cpus_alloc / slurm_cpus_total * 100 |
| Node Utilization | gauge | (alloc + mix) / total * 100 |
| Jobs Over Time | timeseries | Running / Pending / Completing trend |
| Node State Breakdown | bargauge | Idle / Mixed / Alloc / Drain / Down / Maint |
| Node States Over Time | timeseries | Stacked node state history |
| CPUs Over Time | timeseries | Allocated / Idle / Total |
| Partitions | table | CPU Alloc / Total / % / Running Jobs / Pending Jobs per partition |
| Job States Over Time | timeseries | Running / Pending / Completing / Failed / Suspended |
| Cores Requested Over Time | timeseries | Cores running vs pending |
| Collector Status | stat | OK/FAIL per collector |
| Collector Duration | timeseries | Scrape duration history |
Requirements
- Prometheus Slurm Exporter, scraped by Prometheus
- Grafana 12+ with a Prometheus datasource
- The dashboard uses a
$datasourcetemplate variable, so it works with any Prometheus datasource name
Getting started
- Run the exporter on a host with a working Slurm client + munge setup (slurmctld host, login node or monitoring VM):
docker run -d --name slurm_exporter \
  -p 9341:9341 \
  -v /etc/slurm:/etc/slurm:ro \
  -v /var/run/munge:/var/run/munge:ro \
  -v /etc/munge/munge.key:/etc/munge/munge.key:ro \
  sckyzo/slurm-exporter:latest
Pre-compiled binaries, systemd unit and Kubernetes options are described in the project README.
- Add a scrape job to Prometheus:
scrape_configs:
  - job_name: slurm
    static_configs:
      - targets: ['slurm-exporter-host:9341']
- Import this dashboard and select your Prometheus datasource.
The full dashboard suite
This dashboard is part of a set of 10 dashboards maintained with the exporter:
| # | Dashboard | Focus |
|---|---|---|
| 01 | Cluster Overview (this one) | Slurm HPC cluster overview: nodes, jobs, CPU/GPU utilization, partition breakdown. |
| 02 | Jobs & Queue | Job states, queue status, top users and accounts by CPU/job usage. |
| 03 | Node Detail | Per-node CPU and memory utilization by partition. Designed to scale from small clusters to 100k+ nodes. |
| 04 | Cluster Usage Statistics | Cluster utilization (CPU/Memory/GPU/Node), fairshare, jobs, users, accounts, scheduler. Based on gnetId 4323. |
| 05 | Scheduler | slurmctld scheduler cycle times, backfill stats, RPC operation breakdown. |
| 06 | Reservations & Licenses | Reservation status, timeline, node health per reservation, and software license usage. |
| 07 | Accounting | HPC accounting: user and account resource consumption, FairShare analysis, top consumers, and priority diagnostics. |
| 08 | Exporter Health | Collector success/failure status, scrape duration, and Slurm binary version info. |
| 09 | Exporter Performance | Internal performance dashboard for slurm_exporter: command durations, cache freshness, error rates, and scrape health. Use this to validate optimisations and detect slowdowns before they cause scrape failures. |
| 10 | All Metrics Reference | All metrics exposed by slurm_exporter — reference dashboard for admins/users to copy panels into their own dashboards. GPU panels included (show 0 if no GPUs). |
All JSON files, screenshots and Prometheus alert/recording rules are in monitoring/ on GitHub. Issues and contributions welcome.
Source file: 01-slurm-overview.json | UID: slurm-overview
Data source config
Collector config:
Upload an updated version of an exported dashboard.json file from Grafana
| Revision | Description | Created | |
|---|---|---|---|
| Download |