
MSSQL windows_exporter
SQL Server performance and Windows host metrics for windows_exporter v0.31.8. Updated from Grafana dashboard 15024; requires mssql, cpu, net, memory, logical_disk and optional process collectors. Panels require corresponding SQL Server performance counters.
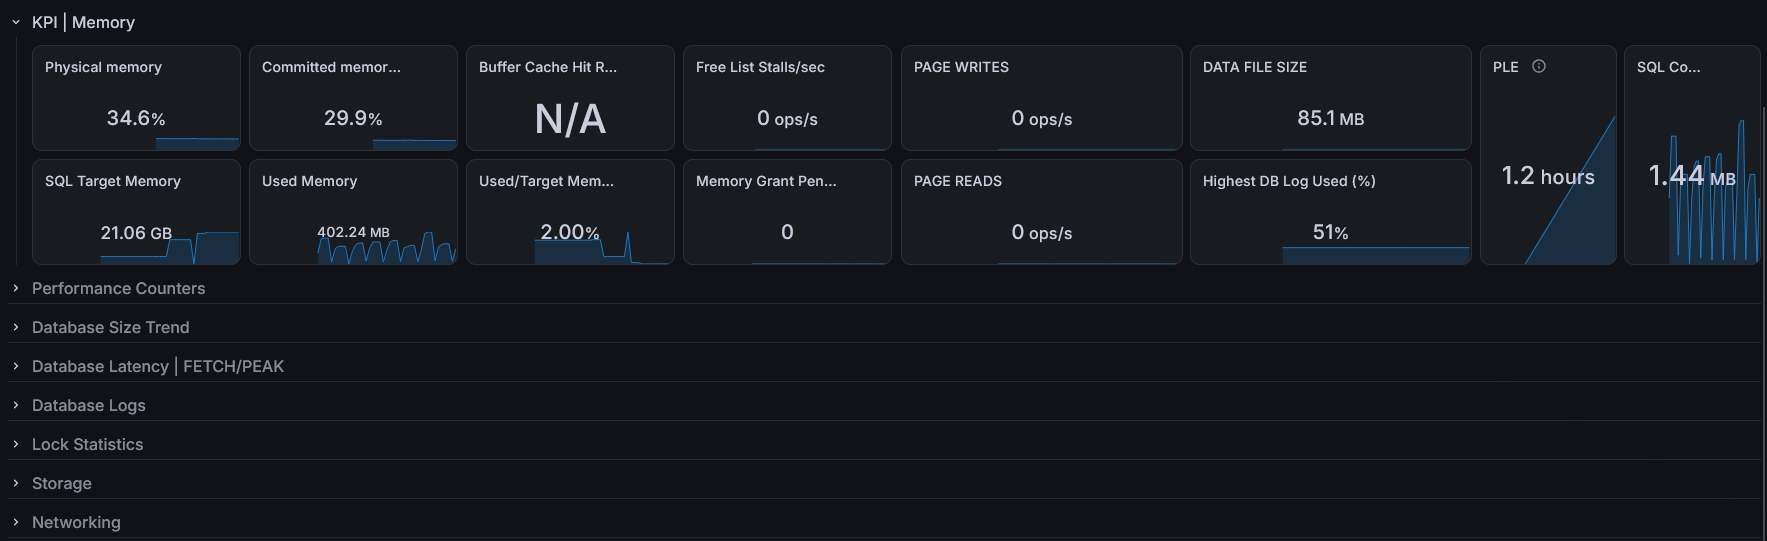
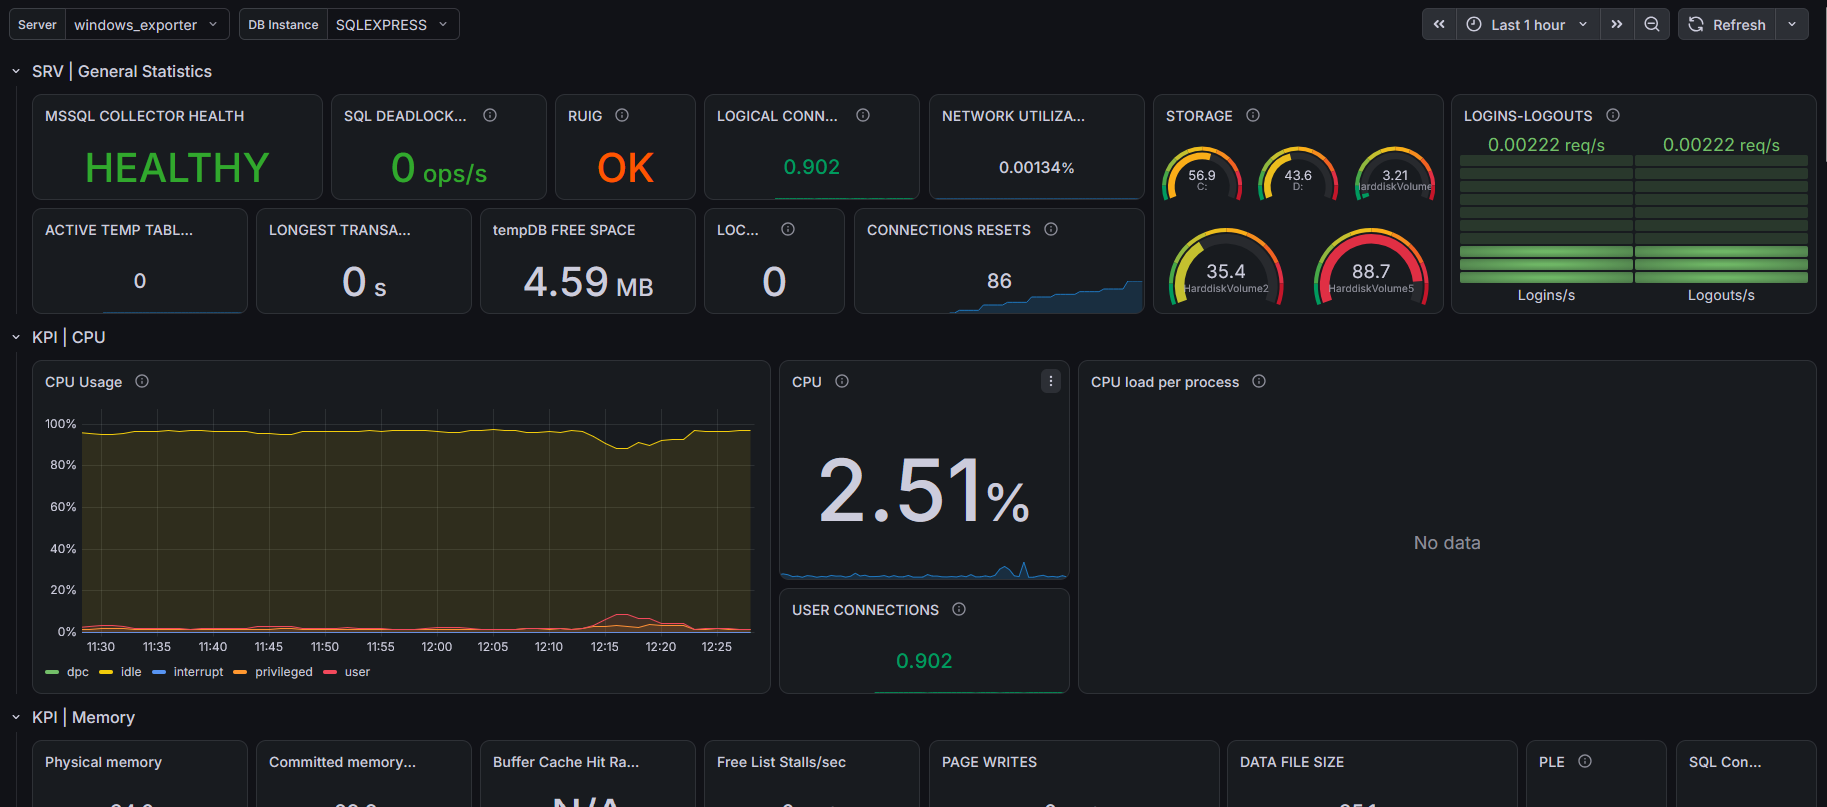
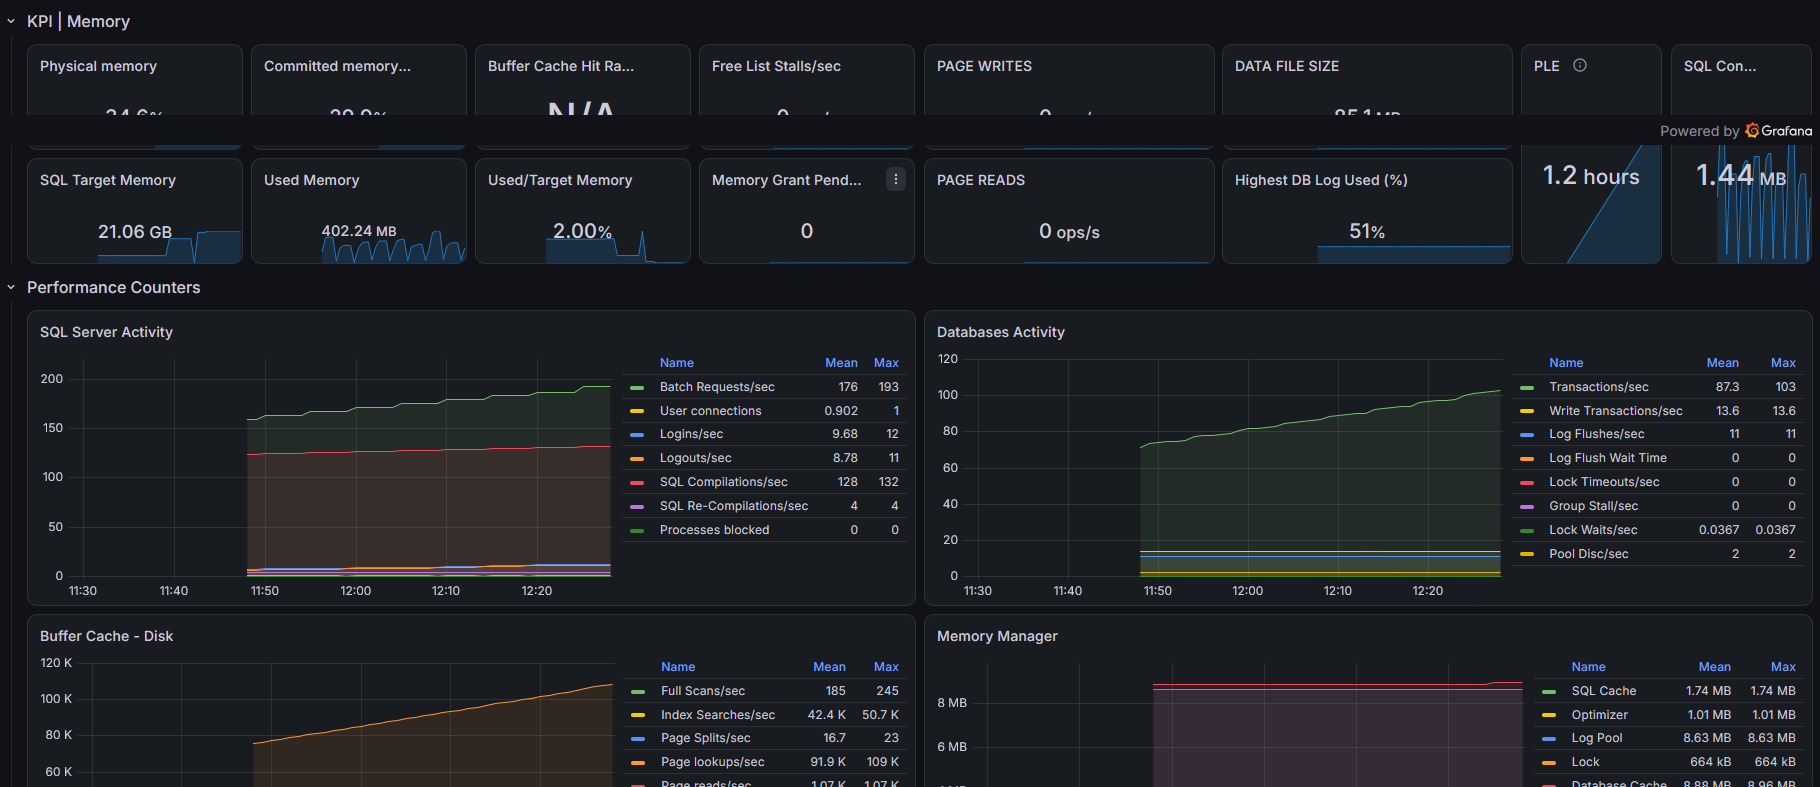
MSSQL Windows Exporter Dashboard (v0.31.8)
A Grafana dashboard for monitoring Microsoft SQL Server performance and the Windows host it runs on, using windows_exporter and Prometheus.
This dashboard is an updated adaptation of Grafana dashboard 15024 – MSSQL windows_exporter, originally designed for windows_exporter v0.16. This version targets windows_exporter v0.31.8 and uses updated Prometheus metric queries.
What it monitors
- SQL Server: collector health, connections, transactions, database activity, locks and deadlocks, buffer cache, SQL Server memory, and database log activity.
- Windows host: CPU usage, memory, storage capacity, and network traffic.
- Optional: per-process CPU usage when the
processcollector is enabled.
Some SQL panels depend on the SQL Server edition, installed performance counters, and available MSSQL metric groups. An empty panel does not always indicate a dashboard problem.
Requirements
- Grafana 10+ with a configured Prometheus datasource.
- Prometheus scraping
windows_exporteron your Windows server. - windows_exporter v0.31.8 installed as a Windows service.
- A running Microsoft SQL Server instance with functioning Windows performance counters.
1. Configure windows_exporter
Enable the collectors below in your config.yaml:
collectors:
  enabled: cpu,logical_disk,memory,mssql,net,process
log:
level: warn
web:
listen-address: ":9182"
The mssql collector is required for SQL Server panels. The process collector is optional and is used for the CPU load per process panel. You may keep other collectors already enabled in your existing configuration.
Make sure the Windows service is actually using this configuration file, then restart it in an elevated PowerShell session:
Restart-Service windows_exporter
Check that the exporter is exposing SQL metrics:
(Invoke-WebRequest 'http://localhost:9182/metrics' -UseBasicParsing).Content -split '\r?\n' |
  Select-String '^windows_mssql_collector_success'
2. Configure Prometheus
Ensure Prometheus can reach the exporter on TCP port 9182. Example scrape configuration:
scrape_configs:
  - job_name: windows_exporter
    static_configs:
      - targets: ['windows-server.example.local:9182']
Replace the example target with your Windows server's hostname or IP address. If you already scrape that exporter, you do not need a second scrape job: newly enabled metrics will be collected automatically. Restrict access to port 9182 to your monitoring network; do not expose it directly to the public internet.
To verify ingestion, query the Prometheus datasource in Grafana Explore:
windows_mssql_collector_success
A value of 1 means that MSSQL subcollector succeeded; 0 indicates a failure. Inspect the collector and mssql_instance labels to identify which one.
3. Import the dashboard
- In Grafana, open Dashboards → New → Import.
- Upload the dashboard's Classic JSON file (or import it by its published Grafana dashboard ID).
- Select your Prometheus datasource and complete the import.
- Use the Server and DB Instance selectors at the top of the dashboard.
Selector note: In this version, Server is populated from the Prometheus job label, not the individual host's instance label. If several Windows servers share the same Prometheus job, the selector will not isolate a single host without modifying the dashboard variables and queries.
Troubleshooting
- All panels show No data: Confirm Prometheus is scraping the target and the correct datasource is selected.
- Windows panels work but SQL panels are empty: Confirm
mssqlis enabled, SQL Server is installed and running, andwindows_mssql_collector_successis present. - SQL subcollector reports
0: Inspect windows_exporter logs and SQL Server performance counters. Not all metric groups are supported or initialized on every SQL Server installation. - Process panel is empty: Enable the optional
processcollector.
Credits
Adapted from the original MSSQL windows_exporter dashboard (ID 15024). This revision updates the metrics and configuration guidance for windows_exporter v0.31.8.
References: windows_exporter documentation · MSSQL collector
Data source config
Collector config:
Upload an updated version of an exported dashboard.json file from Grafana
| Revision | Description | Created | |
|---|---|---|---|
| Download |

Microsoft SQL Server

Easily monitor Microsoft SQL Server, the popular relational database, with Grafana Cloud's out-of-the-box monitoring solution.
Learn more