
Node Exporter Full v2
InfiniBand panel legends in English including the HPC port label; negative-Y transform now matched by query refId (robust to legend changes).
About
This dashboard is based on the community dashboard Node Exporter Full (ID 1860, rev45, by rfmoz) and adds an InfiniBand section.
What is added
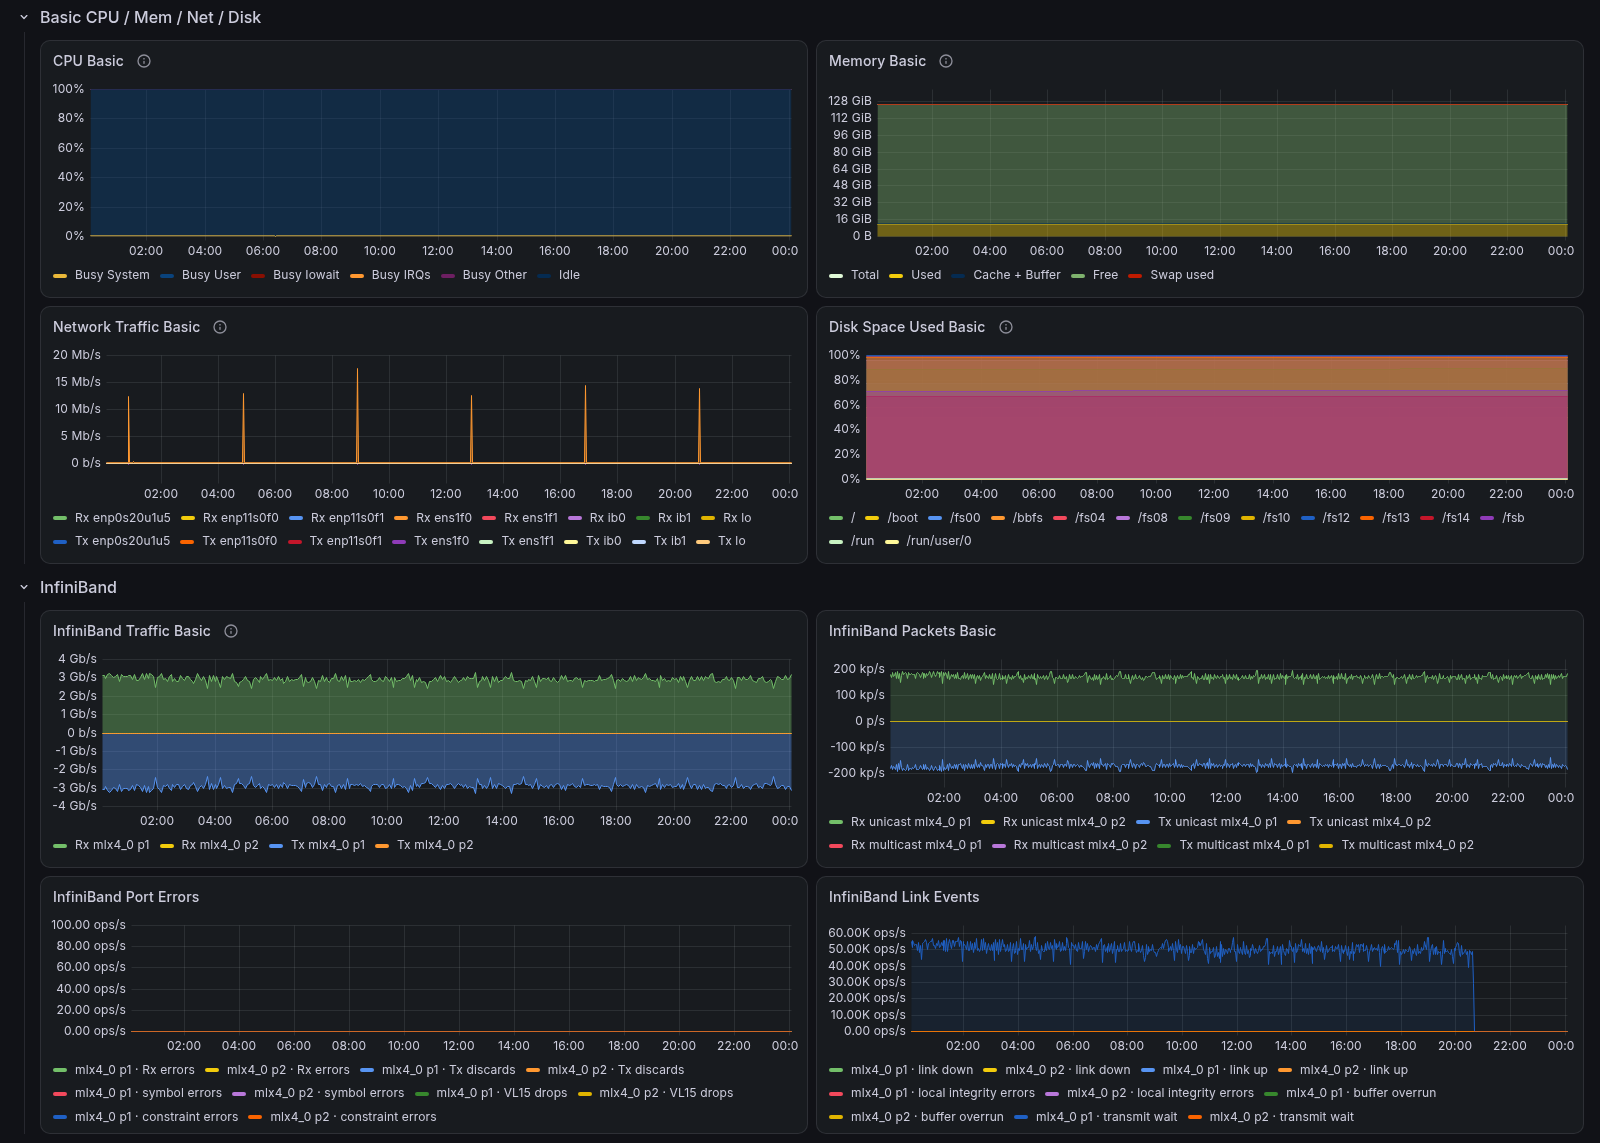
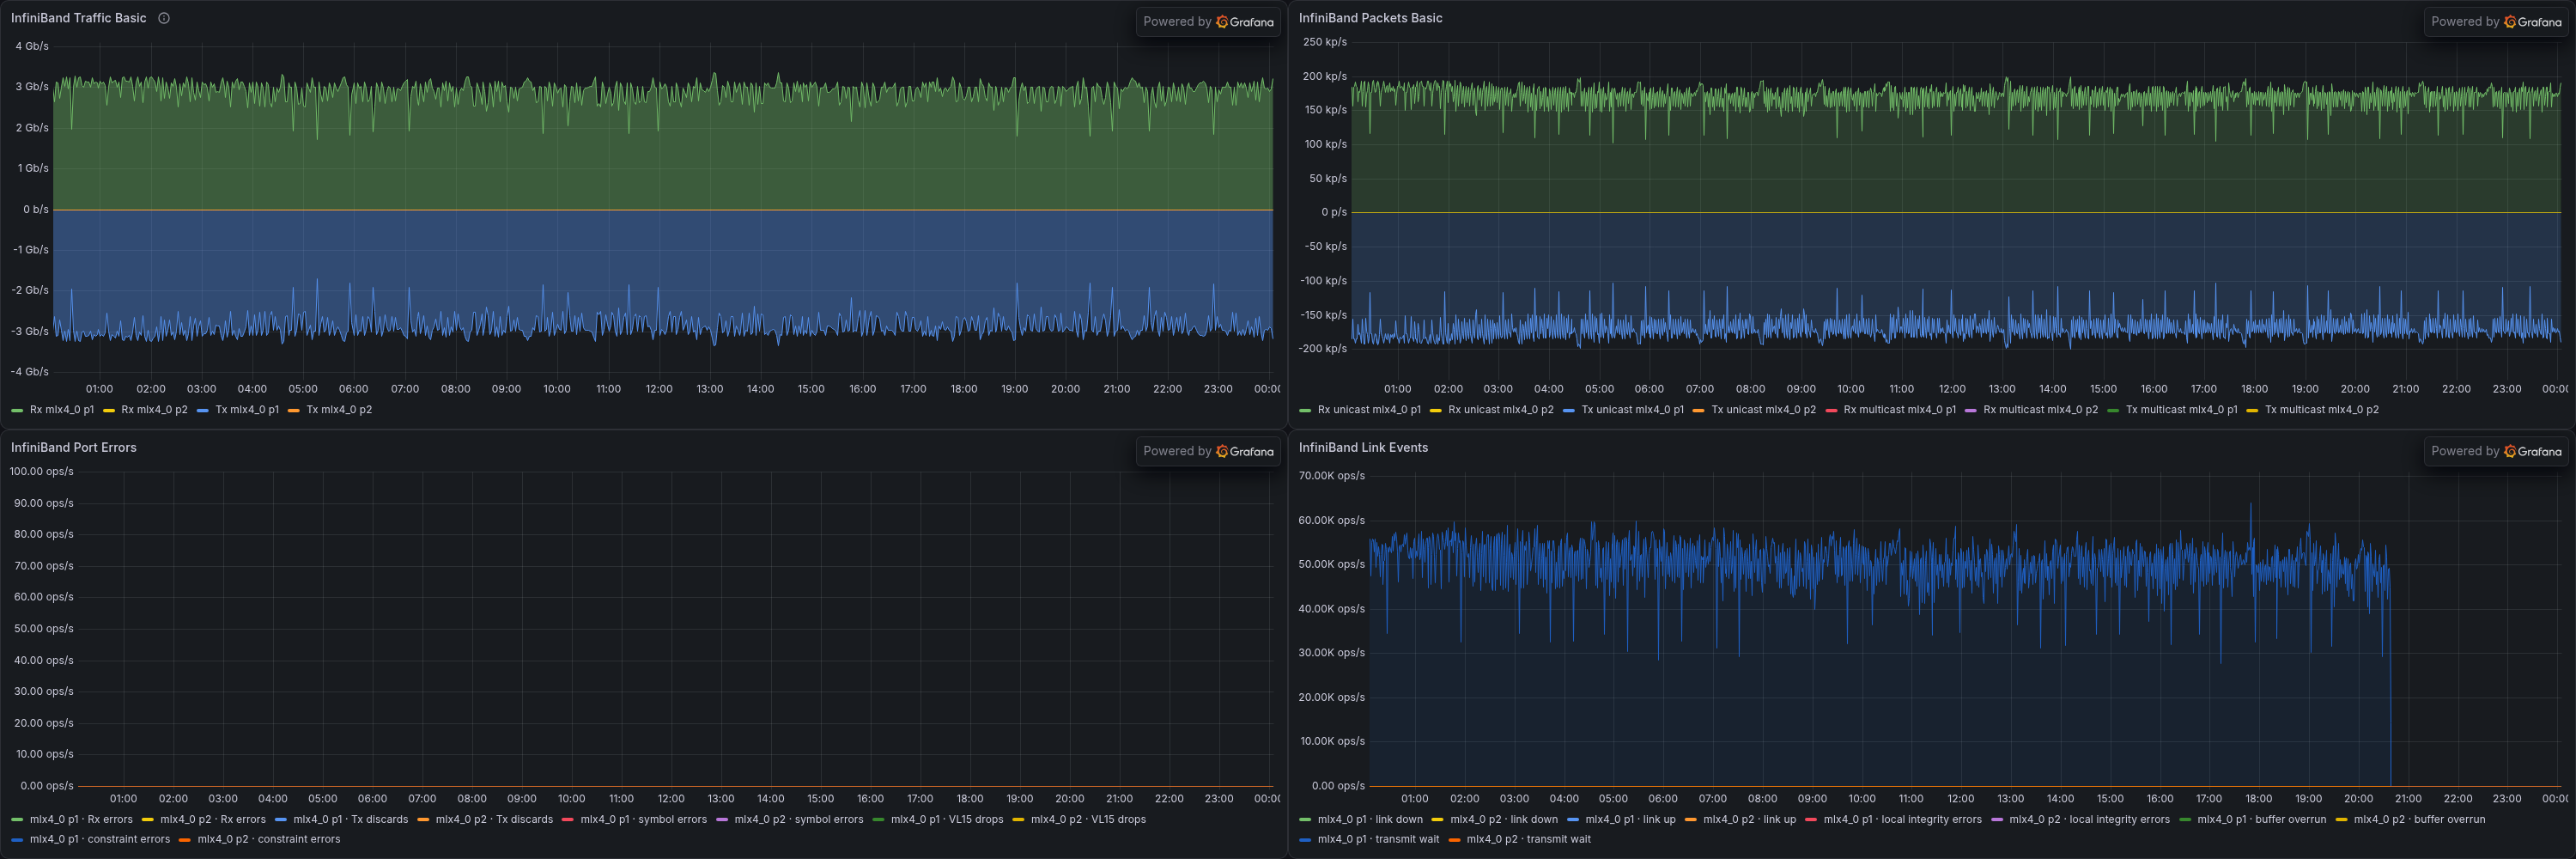
Right below the Basic CPU / Mem / Net / Disk row there is a new InfiniBand row with four panels:
- InfiniBand Traffic Basic - receive / transmit throughput per IB port
- InfiniBand Packets Basic - unicast and multicast packet rate
- InfiniBand Port Errors - port error counters
- InfiniBand Link Events - link events and congestion counters
Requirements
- Prometheus and node_exporter (the InfiniBand collector is enabled by default; metrics are prefixed with
node_infiniband_) - Template variables
job,nodenameandnode - The
${DS_PROMETHEUS}datasource variable; select your Prometheus datasource when importing
Notes
- InfiniBand panels only show data on nodes equipped with IB adapters; if your cluster has no IB, collapse or remove the row.
- All other panels are unchanged from the upstream Node Exporter Full dashboard, which requires node_exporter 1.0 or later.
Data source config
Collector type:
Collector plugins:
Collector config:
Revisions
Upload an updated version of an exported dashboard.json file from Grafana
| Revision | Description | Created | |
|---|---|---|---|
| Download |

Linux Server

Monitor Linux with Grafana. Easily monitor your Linux deployment with Grafana Cloud's out-of-the-box monitoring solution.
Learn more