
n8n Production Overview (queue mode)
n8n in queue mode: main, webhook and worker health, Bull queue depth, executions and failures, duration percentiles, task runners, Node.js process health, Postgres and Redis/Valkey.
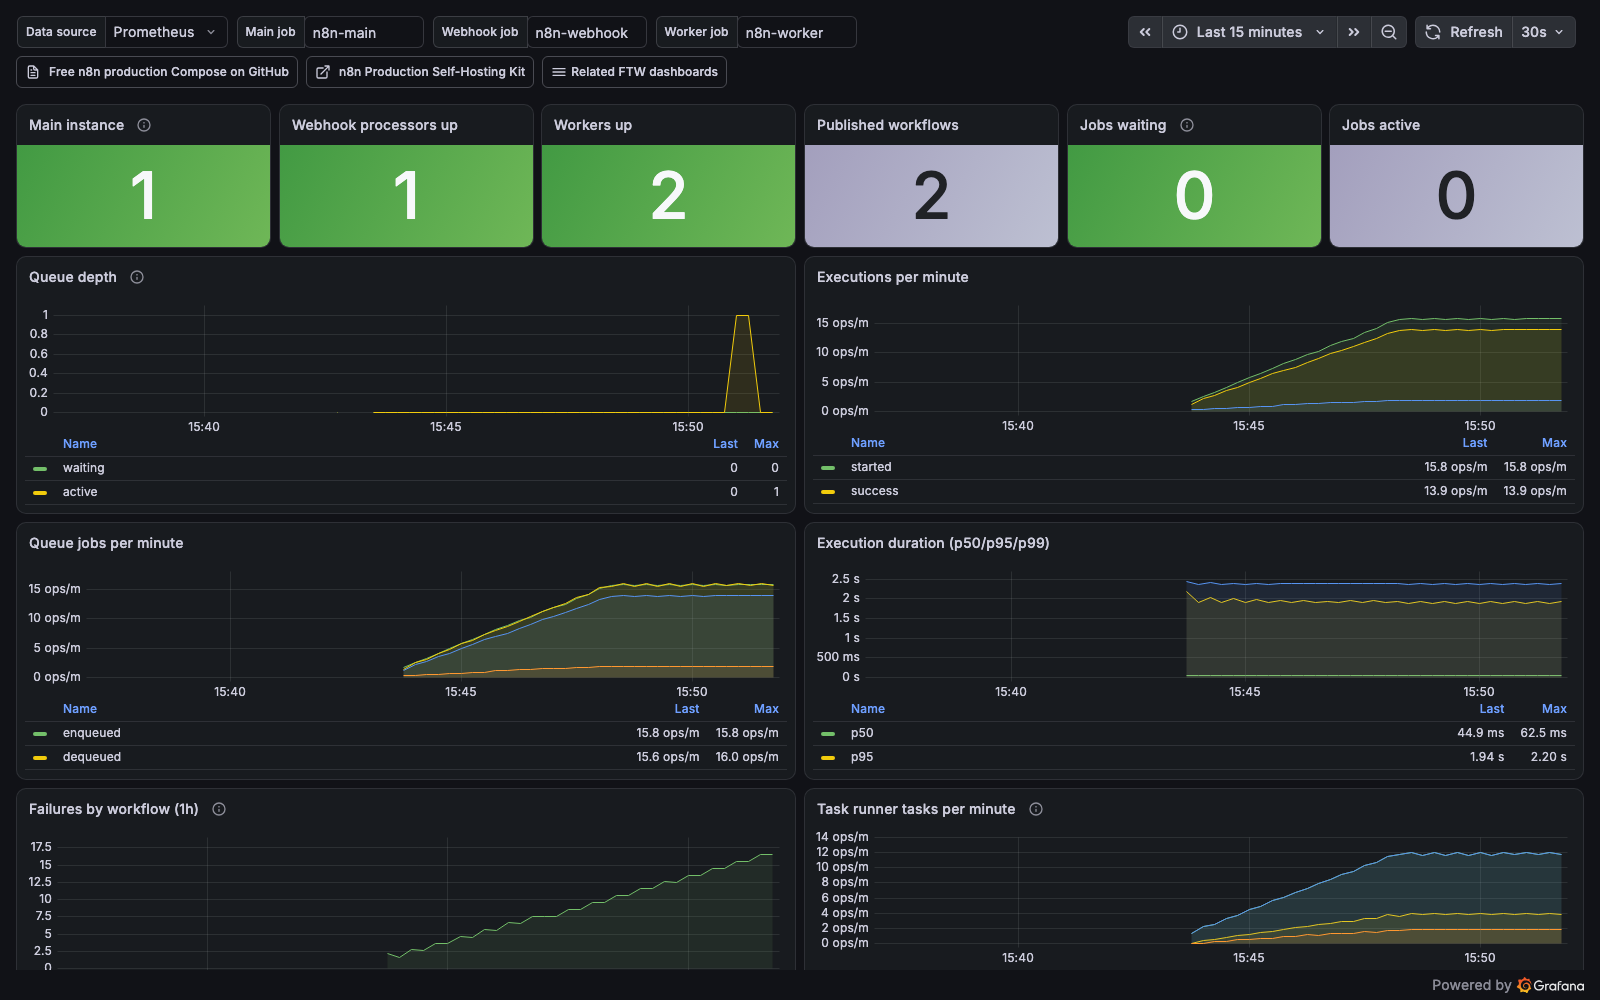
Is your self-hosted n8n keeping up? One board for n8n in queue mode: whether main, webhook processors and workers are up, the Bull queue backlog, executions and failures per minute, execution duration percentiles, the busiest failing workflows, task runners, Node.js process health, and the Postgres and Redis/Valkey underneath.
Requirements
- n8n with Prometheus metrics on:
N8N_METRICS=true, plusN8N_METRICS_INCLUDE_MESSAGE_EVENT_BUS_METRICS=true(executions and failures),N8N_METRICS_INCLUDE_QUEUE_METRICS=true(queue panels),N8N_METRICS_INCLUDE_CACHE_METRICS=true(cache hit ratio) andN8N_METRICS_INCLUDE_WORKFLOW_ID_LABEL=true("Failures by workflow") - Queue mode (
EXECUTIONS_MODE=queue) with workers exposing/metrics(QUEUE_HEALTH_CHECK_ACTIVE=true); on a single instance the queue and worker panels stay empty - postgres_exporter and redis_exporter for the database panels
- Grafana 10.4 or later
Setup
Import the dashboard and select your Prometheus data source. The Main job, Webhook job and Worker job boxes at the top hold the Prometheus job names of your n8n main, webhook and worker scrapes (default n8n-main, n8n-webhook, n8n-worker); change them to match your scrape config and the three "up" stats follow.
Tested by importing this exact file into Grafana 10.4.0 and 13.2.2 against a real n8n 2.39.7 queue-mode stack with two workers under webhook load: all 32 queries return data.
A free hardened Compose setup for self-hosting n8n: https://github.com/Fractal-Techware/n8n-production-compose
Data source config
Collector config:
Upload an updated version of an exported dashboard.json file from Grafana
| Revision | Description | Created | |
|---|---|---|---|
| Download |