
VPS Host (node_exporter)
One Linux server at a glance: uptime, CPU, memory, swap and OOM kills, filesystems, inodes, disk I/O and network (node_exporter).
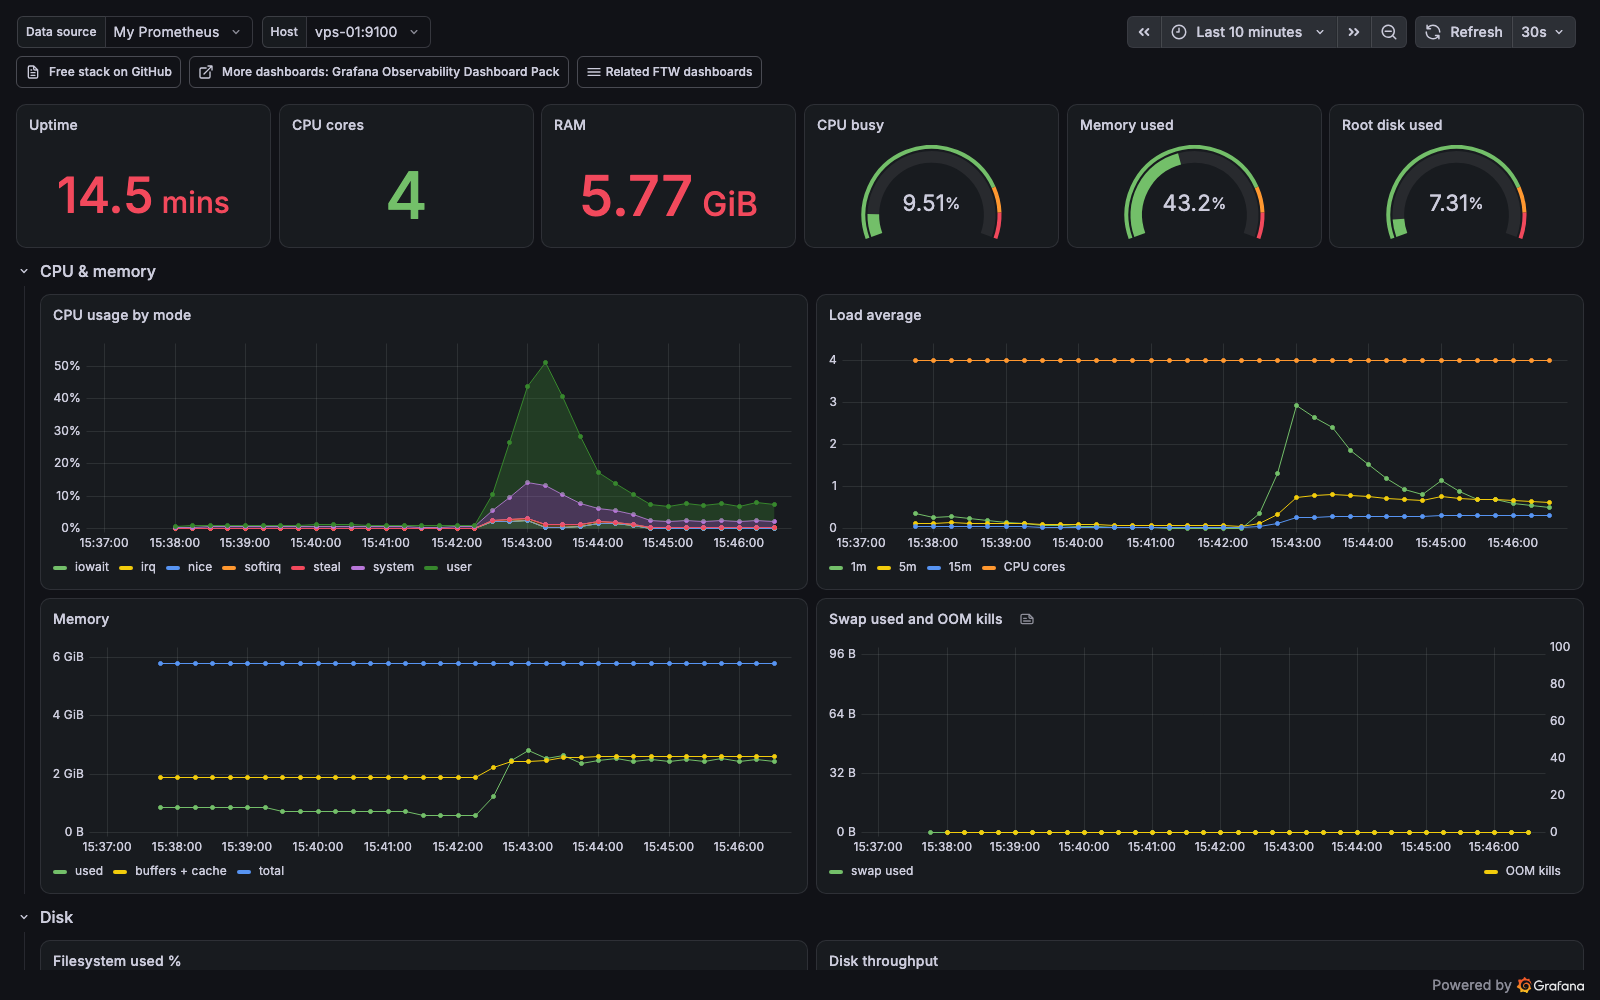
One Linux server at a glance: uptime, CPU, memory, swap and OOM kills, filesystems, inodes, disk I/O and network. Built for a single VPS or a handful of hosts, where you want to see what one machine is doing rather than a fleet average.
Requirements
- Prometheus scraping node_exporter 1.8 or later (default collectors: cpu, meminfo, loadavg, filesystem, diskstats, netdev, uname, vmstat)
- Grafana 10.4 or later
What it shows
- Stats: uptime, CPU cores, total RAM, and gauges for CPU busy, memory used and root disk used
- CPU & memory: CPU usage by mode, load average (1/5/15) against the core count, memory used vs buffers + cache vs total, swap used alongside OOM kills
- Disk: filesystem used % and inodes used % (tmpfs, overlay and squashfs excluded), read/write throughput per device, I/O utilisation
- Network: receive/transmit in bits per second, and errors and drops (loopback, veth, docker and bridge interfaces excluded)
Setup
Import the dashboard, select your Prometheus data source, then pick a host from the Host dropdown. The dropdown is driven by node_uname_info, so it fills itself from whatever you scrape.
Tested by importing this exact file into Grafana 10.4.0 and 13.2.2 against node_exporter 1.12.1: all 25 queries return data.
MIT-licensed source, part of a free single-VPS stack (Prometheus + Grafana behind automatic HTTPS, generated credentials, hardened containers): https://github.com/Fractal-Techware/vps-observability-stack
Data source config
Collector config:
Upload an updated version of an exported dashboard.json file from Grafana
| Revision | Description | Created | |
|---|---|---|---|
| Download |