
Proxmox VE Dashboard
Monitoring Proxmox with InfluxDB Grafana
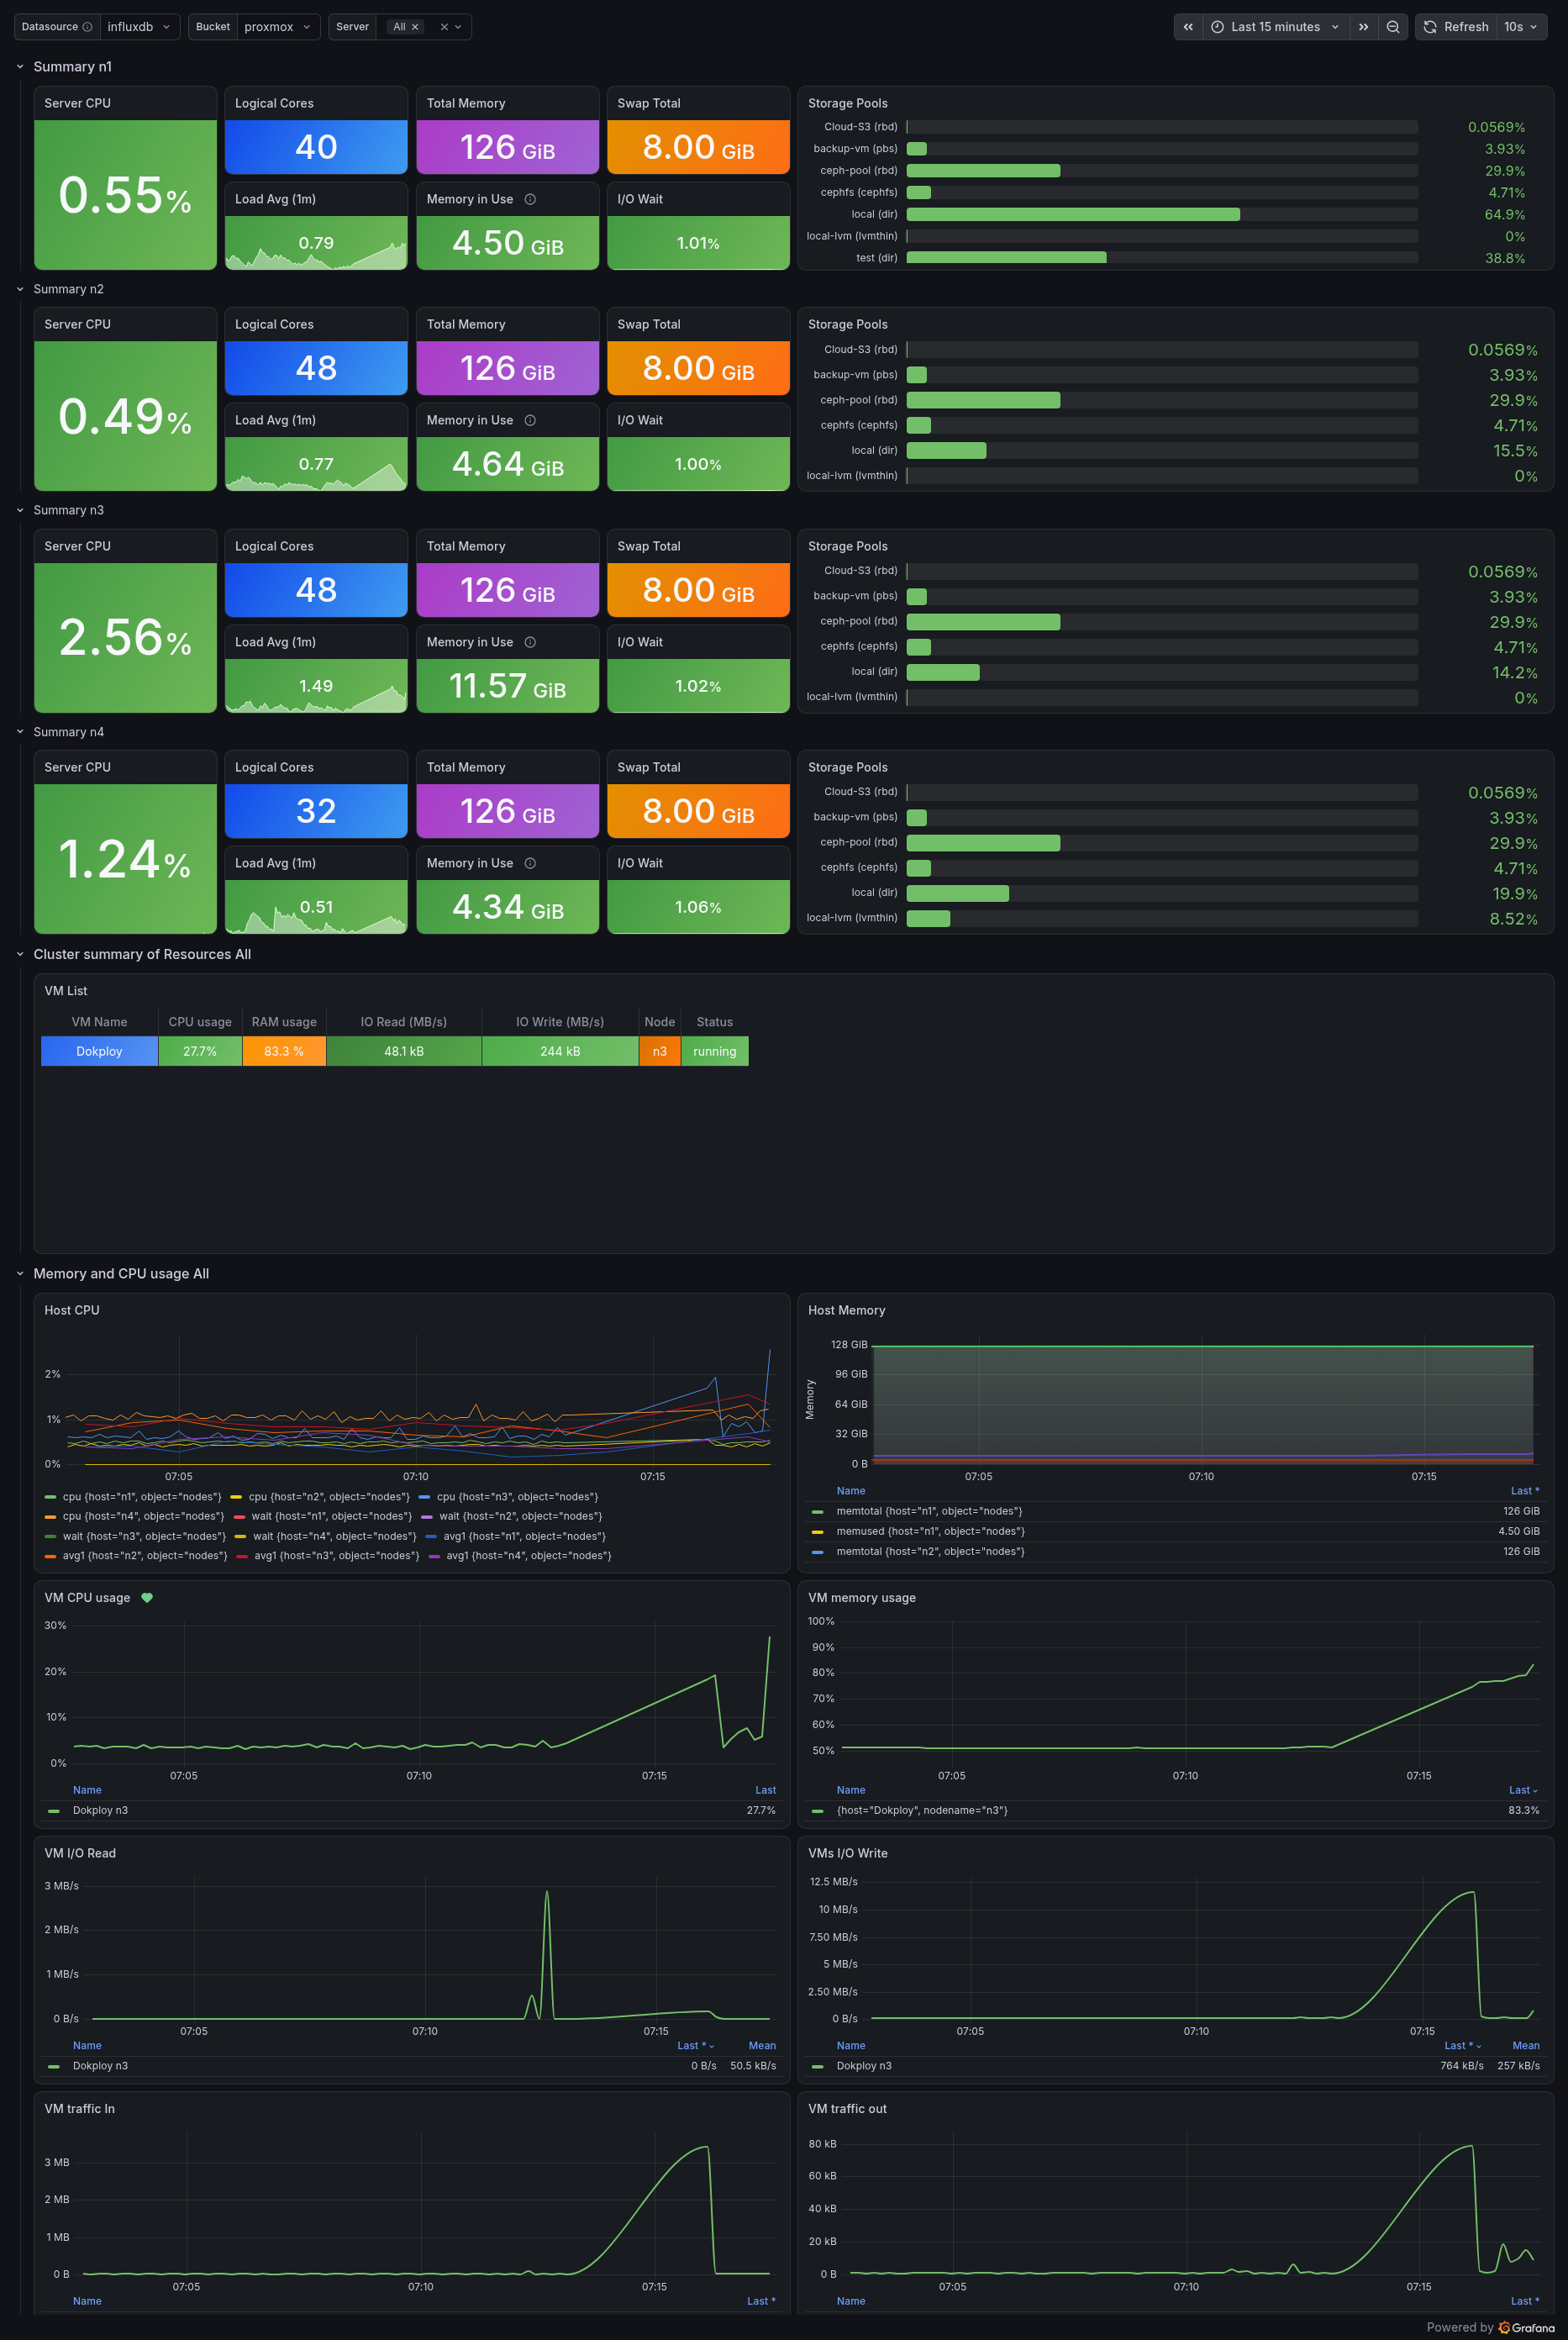
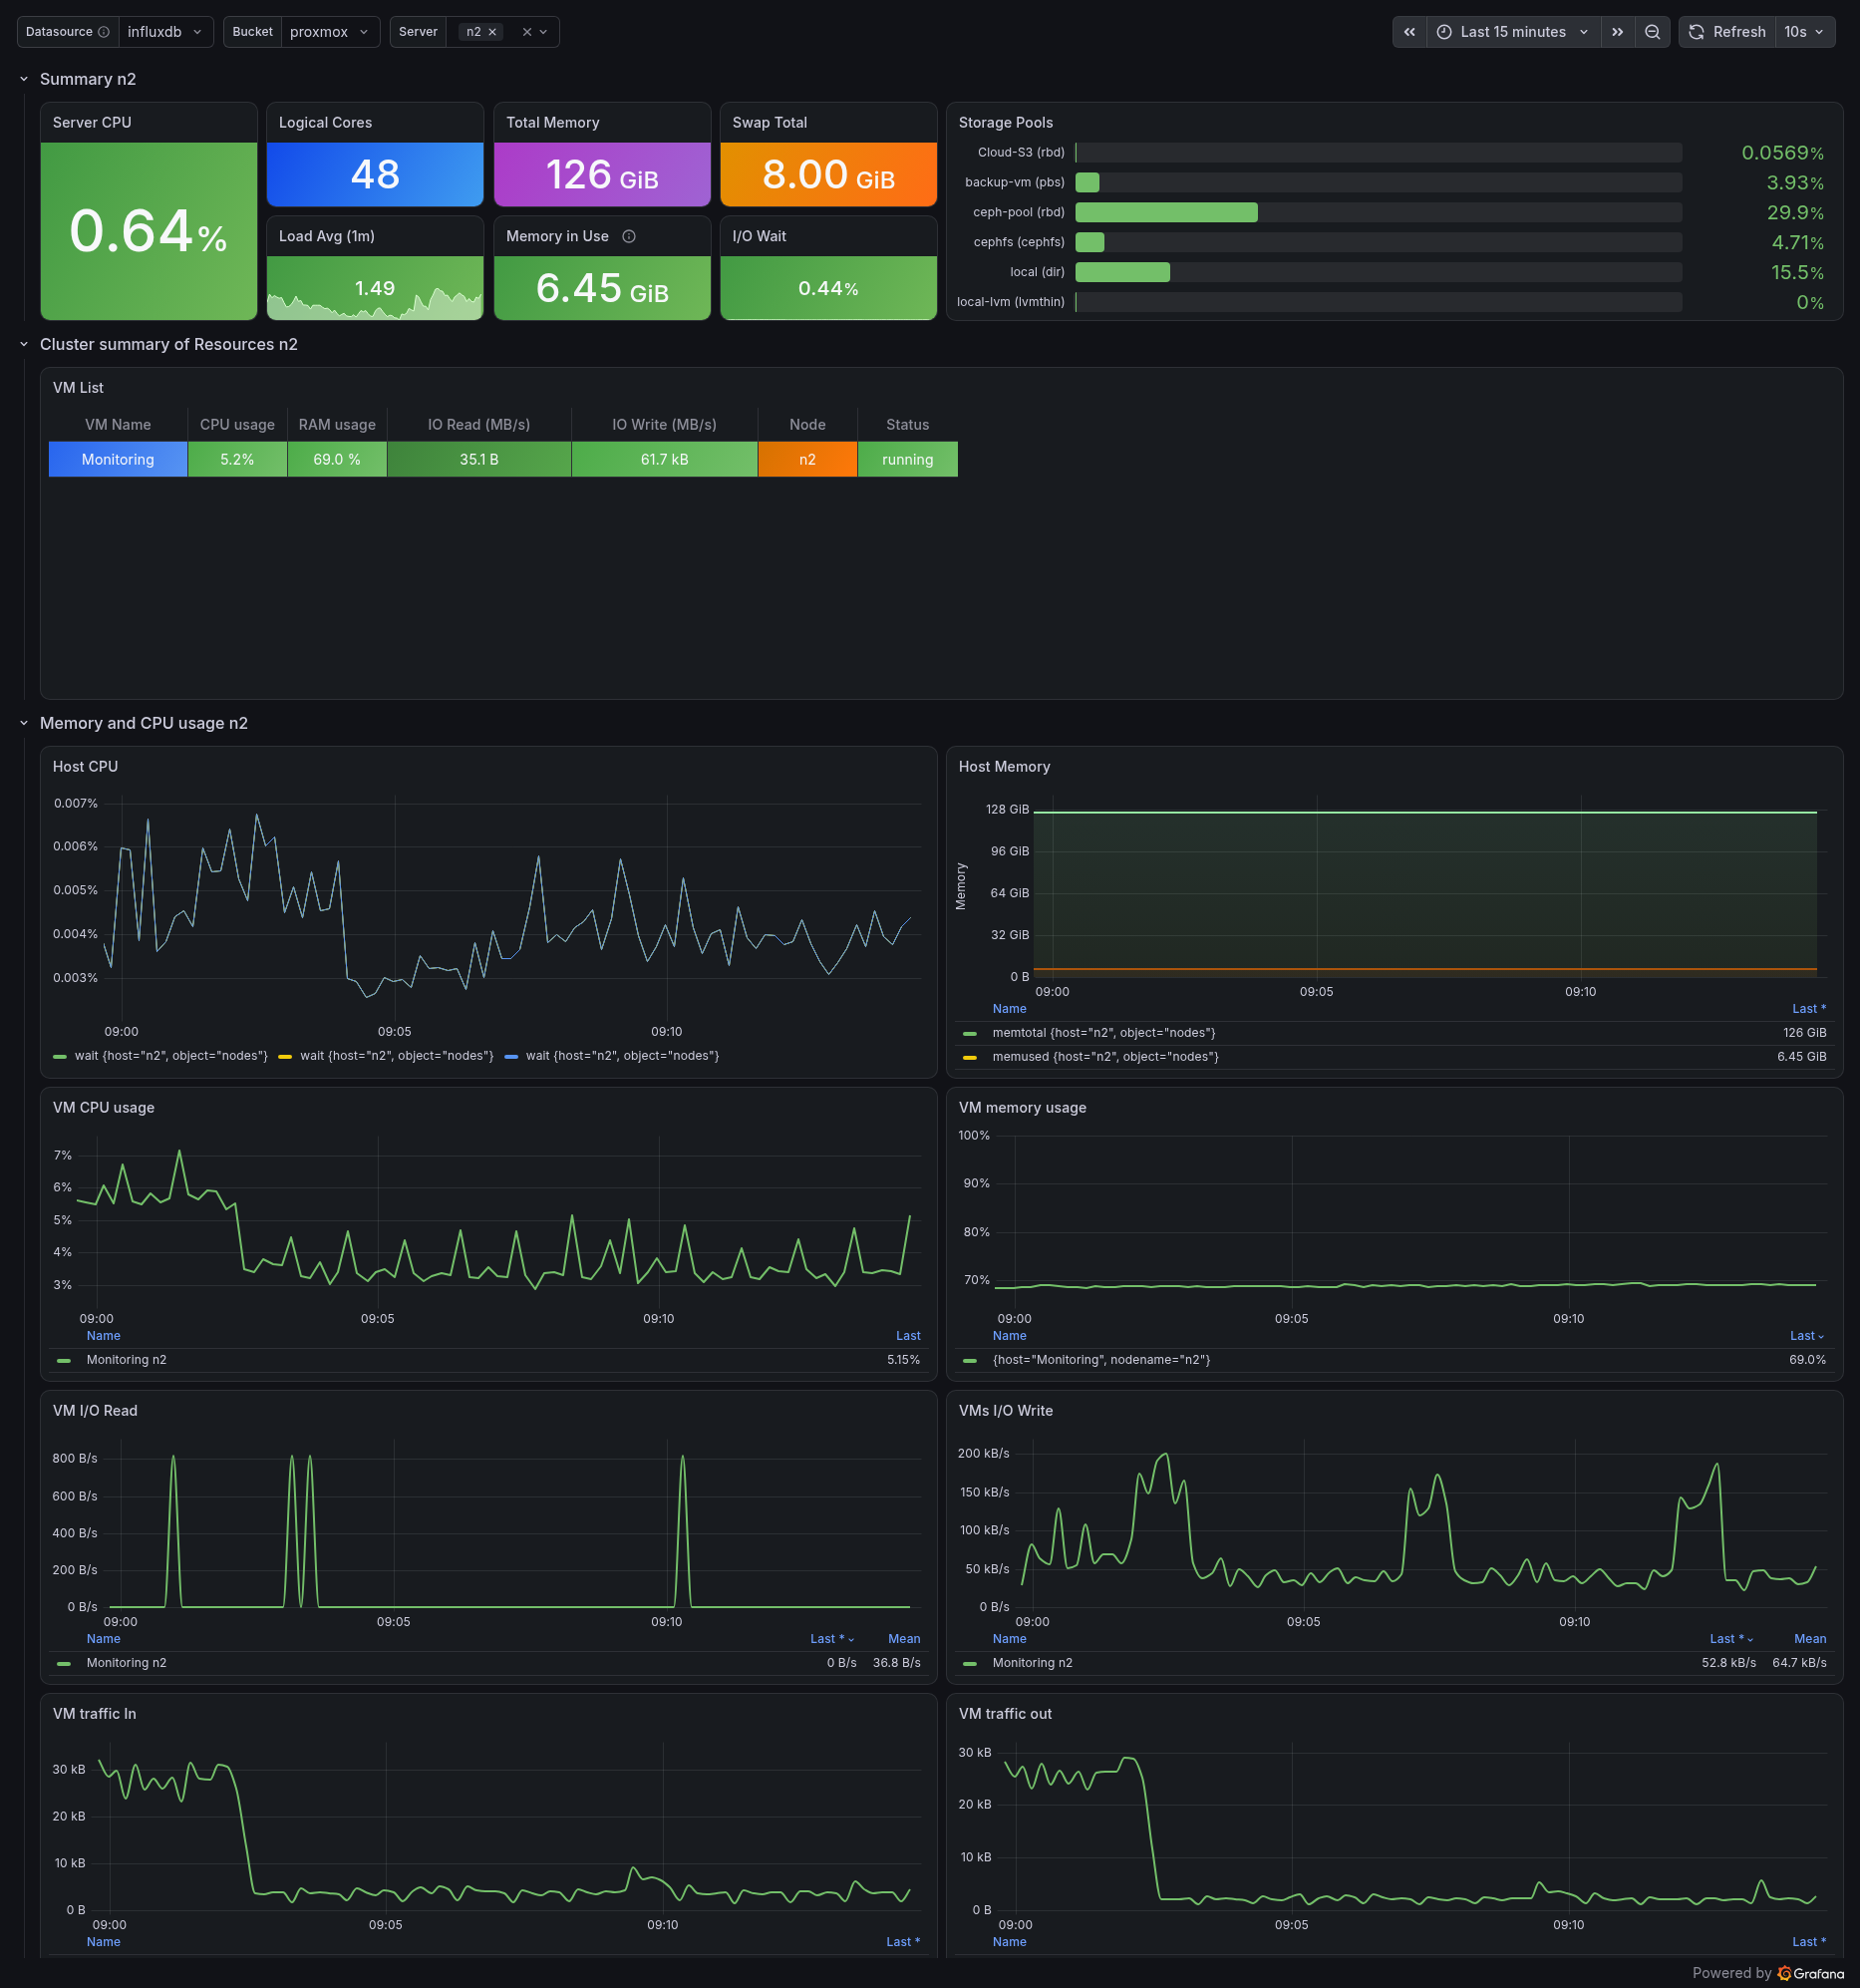
Proxmox VE Monitoring Dashboard
A clean Grafana dashboard for monitoring Proxmox VE clusters and standalone nodes.
Features
- Node & VM/LXC resource tracking (CPU, memory, network, storage).
- Multi-node cluster support.
Requirements
- Proxmox VE 8.x & 9.x
- InfluxDB 2.x
- Grafana
Installation
1. Proxmox VE Setup Go to Datacenter > Metric Server > Add InfluxDB. Enter your server details (IP, Port 8086, Org, Bucket, API Token).
2. Grafana Setup
Ensure the InfluxDB (Flux) data source is added. Go to Dashboards > Import and upload the .json file from this repository.
Credits
Inspired by jorgealbaladejo and unraided.
Repository
Data source config
Collector type:
Collector plugins:
Collector config:
Revisions
Upload an updated version of an exported dashboard.json file from Grafana
| Revision | Description | Created | |
|---|---|---|---|
| Download |