
Linux Network Stack (node_exporter)
Linux network stack from Prometheus node_exporter: conntrack limit/usage, per-CPU softirq/hardirq time, per-CPU softnet processing, NIC interrupts by CPU (needs --collector.interrupts), interfaces, TCP/UDP/ICMP, sockets. Every per-CPU panel lists all CPUs in its legend table.
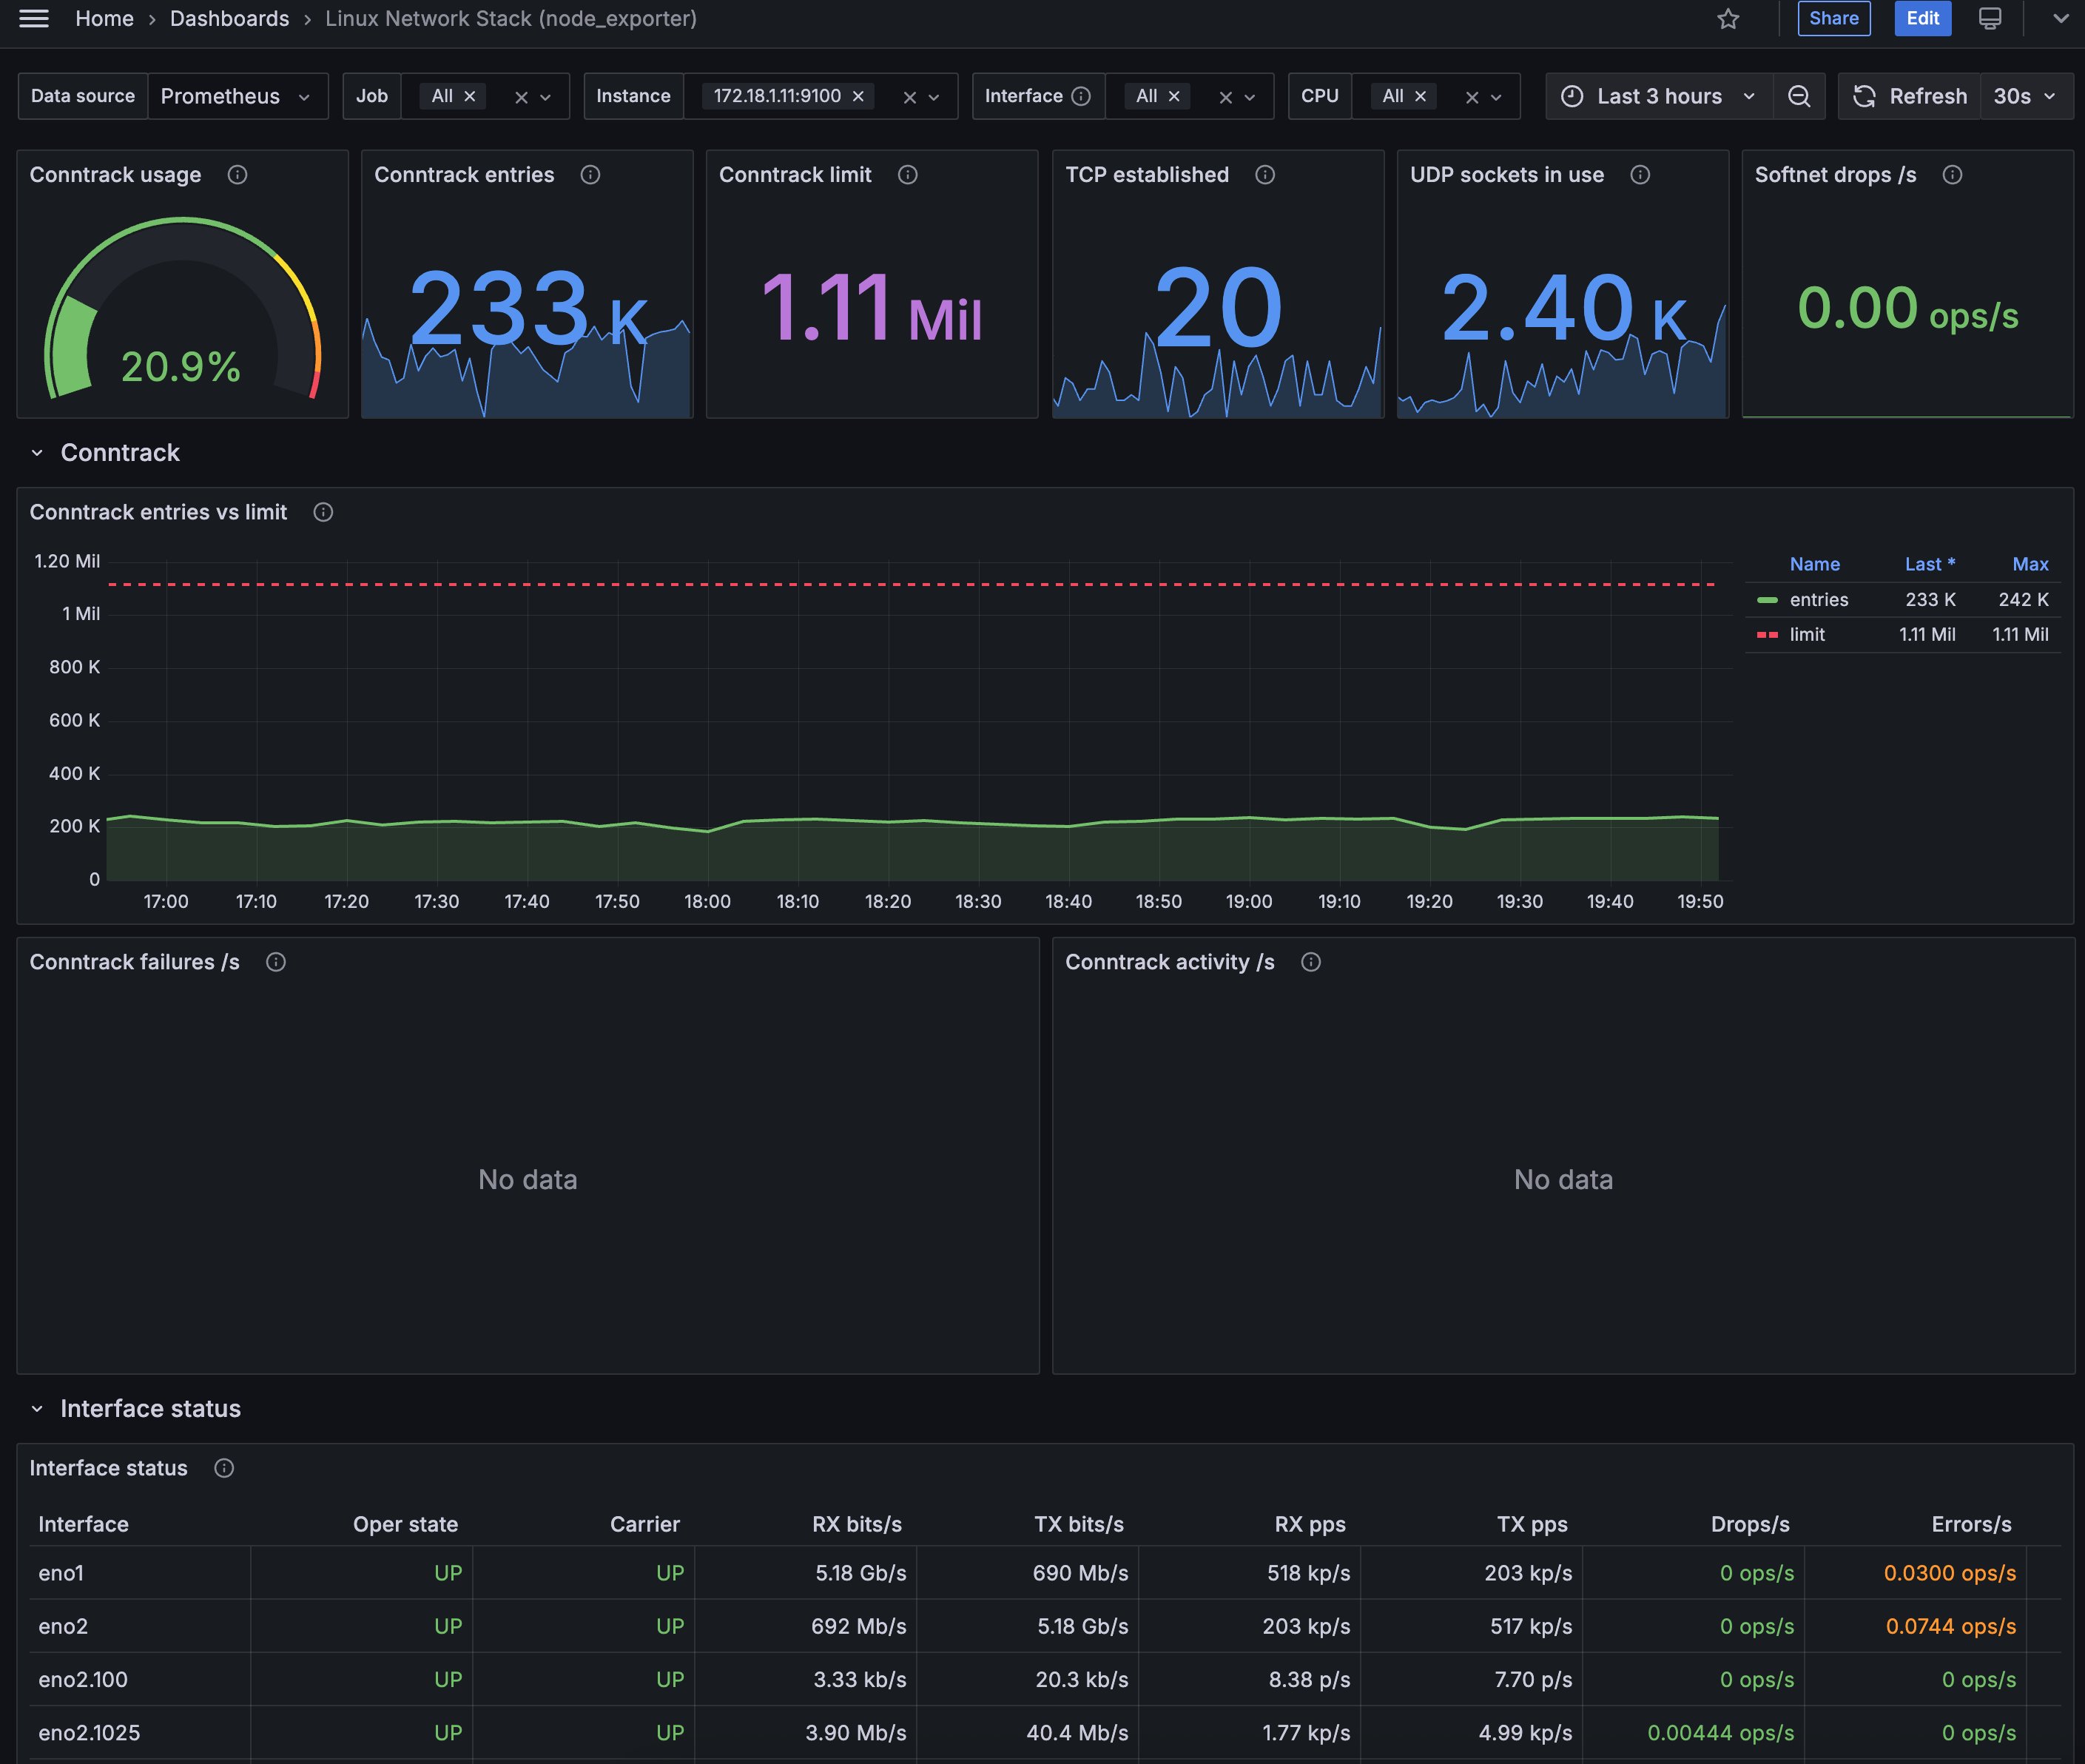
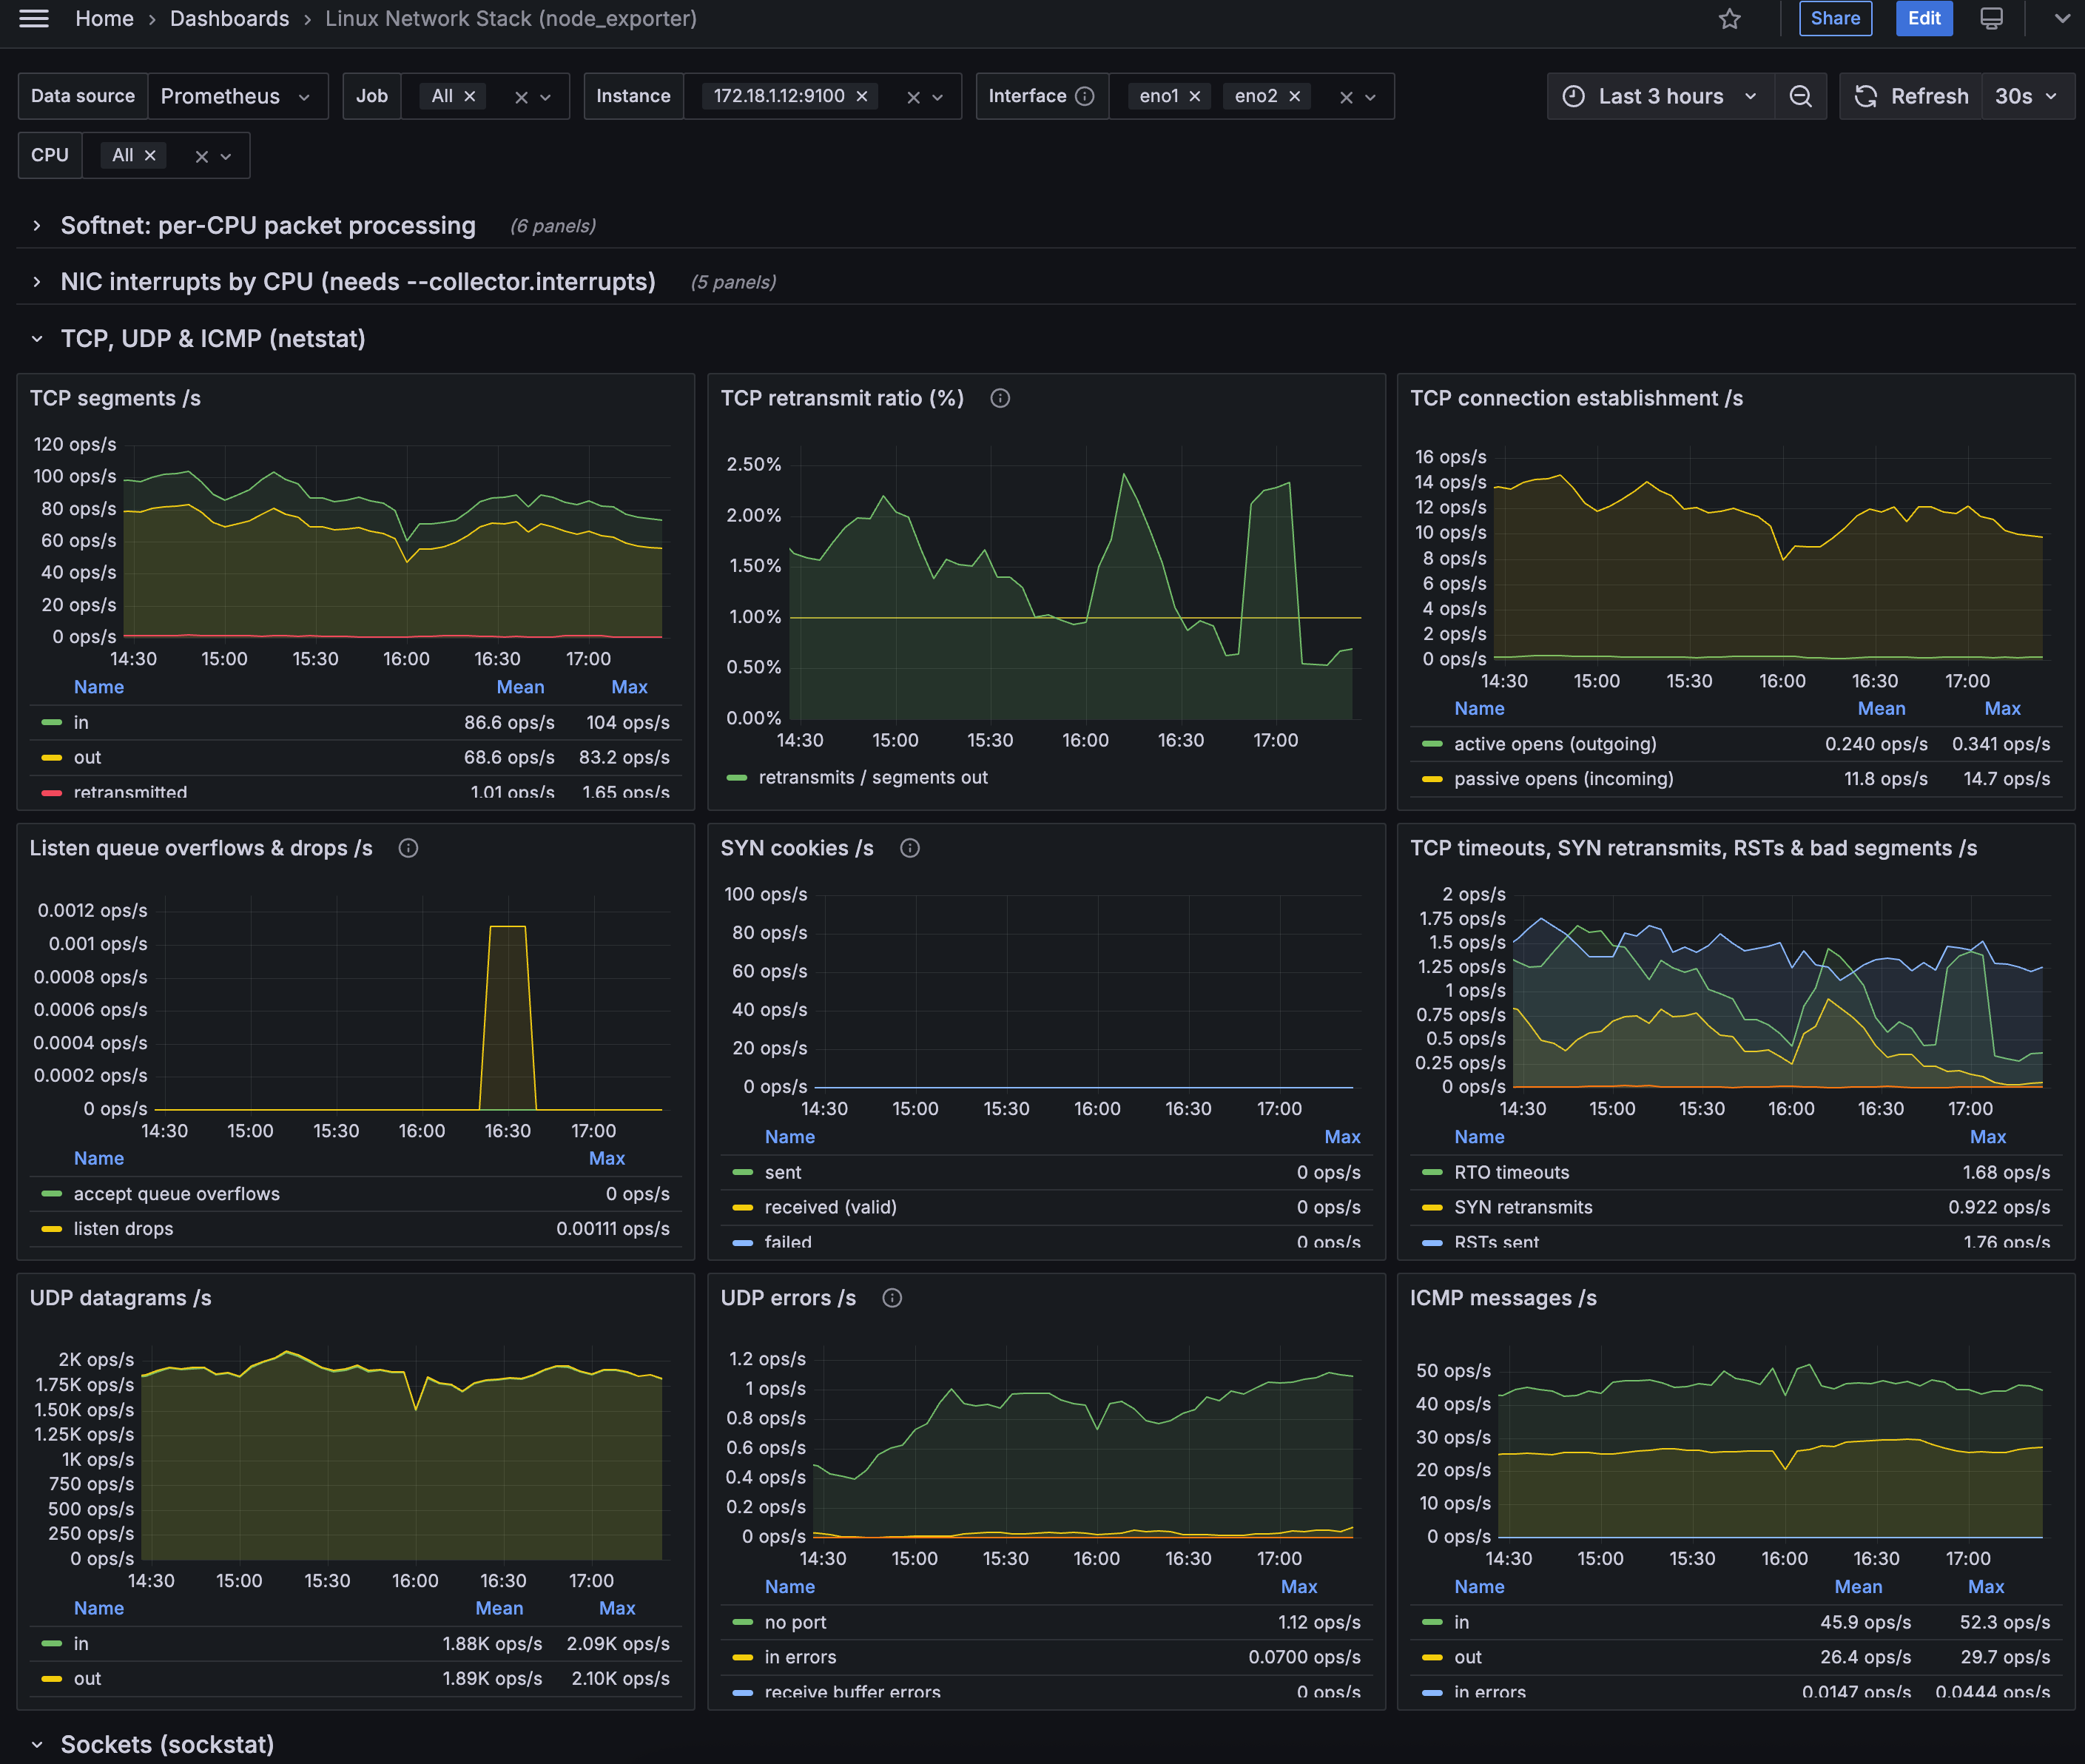
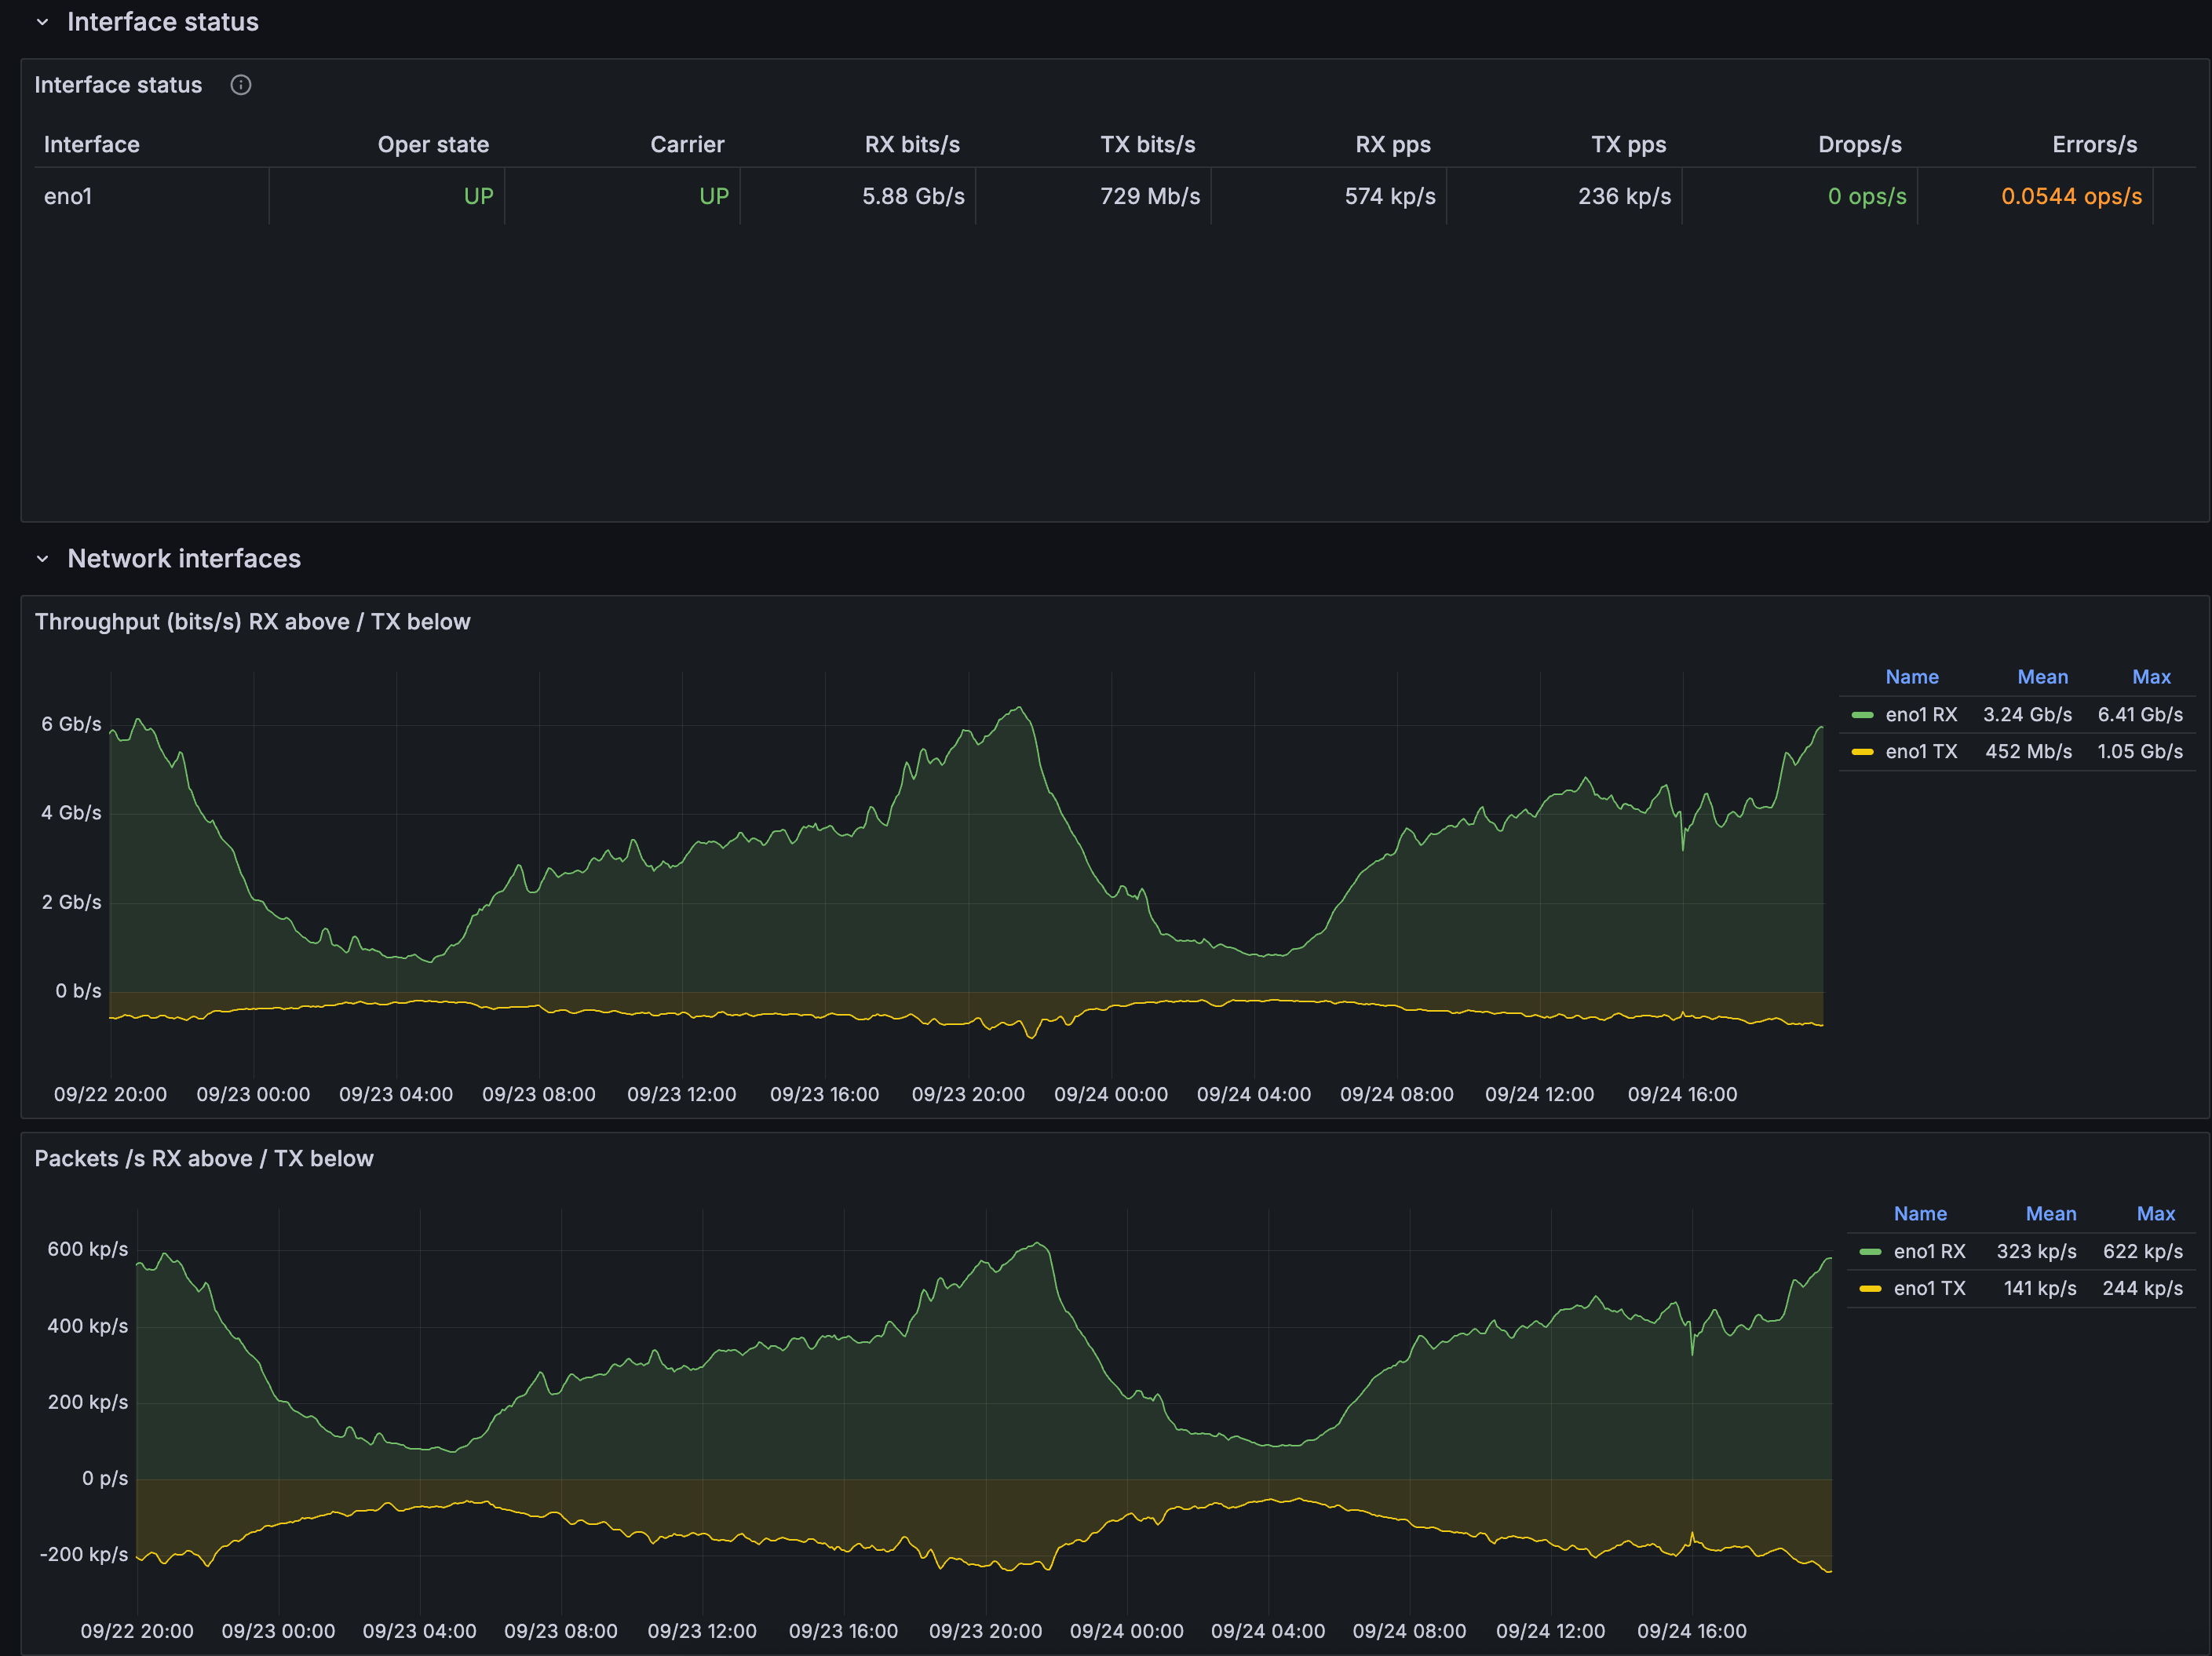
The Linux Network Stack (node_exporter) dashboard uses the prometheus data source to create a Grafana dashboard with the bargauge, gauge, stat, table and timeseries panels.
Data source config
Collector type:
Collector plugins:
Collector config:
Revisions
Upload an updated version of an exported dashboard.json file from Grafana
| Revision | Description | Created | |
|---|---|---|---|
| Download |

Linux Server

Monitor Linux with Grafana. Easily monitor your Linux deployment with Grafana Cloud's out-of-the-box monitoring solution.
Learn more