
Dagster Run Monitoring
Run, schedule, sensor, asset, and op pool monitoring for Dagster and Dagster+ (Dagster Cloud), using dagster-prometheus-exporter (https://github.com/HirofumiTsuda/dagster-prometheus-exporter), which polls Dagster's GraphQL API and exposes Prometheus metrics.
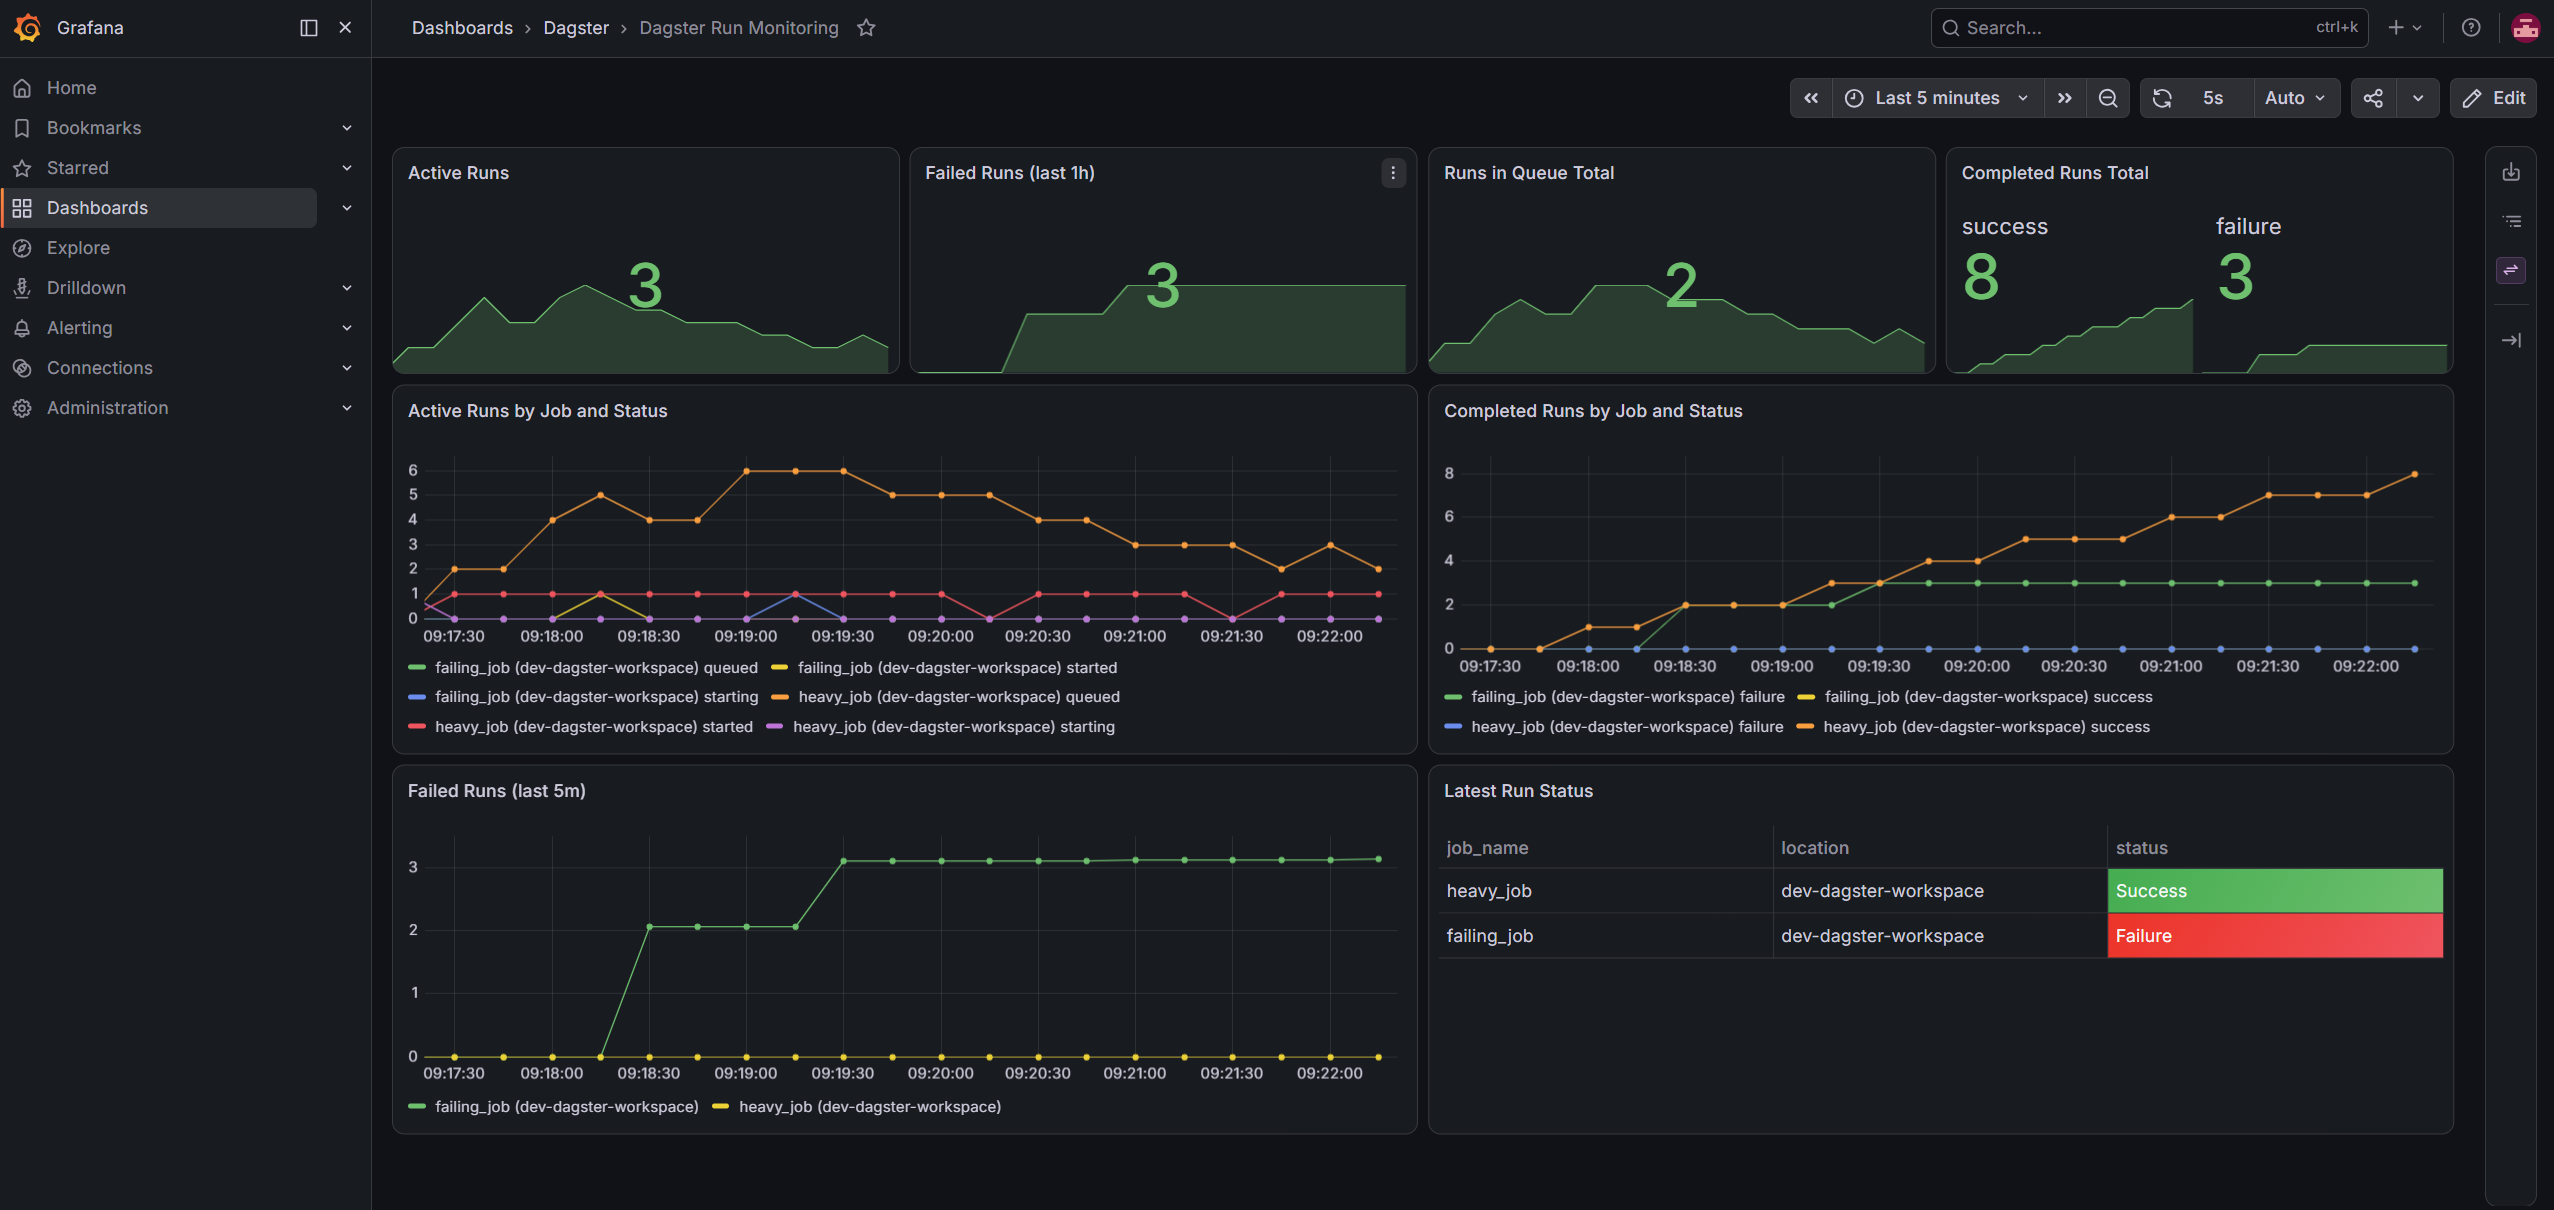
Run, schedule, sensor, and asset health for Dagster, from dagster-prometheus-exporter. Works with OSS Dagster and Dagster+ (Dagster Cloud).
- Run status, duration, and queue backlog
- Schedule and sensor tick health
- Asset staleness and materialization status
- Op pool concurrency
- Code-location load errors
- Exporter self-health
The exporter is a standalone Go binary that polls Dagster's GraphQL API and serves Prometheus metrics on :9101/metrics.
Setup: run ghcr.io/hirofumitsuda/dagster-prometheus-exporter (or the Helm chart) with DAGSTER_GRAPHQL_ENDPOINT set (plus DAGSTER_CLOUD_API_TOKEN for Dagster+), scrape it with Prometheus, then import this dashboard. Full docs in the README.
Data source config
Collector config:
Upload an updated version of an exported dashboard.json file from Grafana
| Revision | Description | Created | |
|---|---|---|---|
| Download |