
PostgreSQL 18 + Patroni | postgres_exporter
Full postgres_exporter v0.20.1 coverage for a Patroni-managed PostgreSQL cluster: Patroni cluster state, checkpoints, WAL, vacuum horizon, locks, replication, per-table and per-index statistics, buffer cache, host and exporter self-monitoring. Every panel verified against live data.
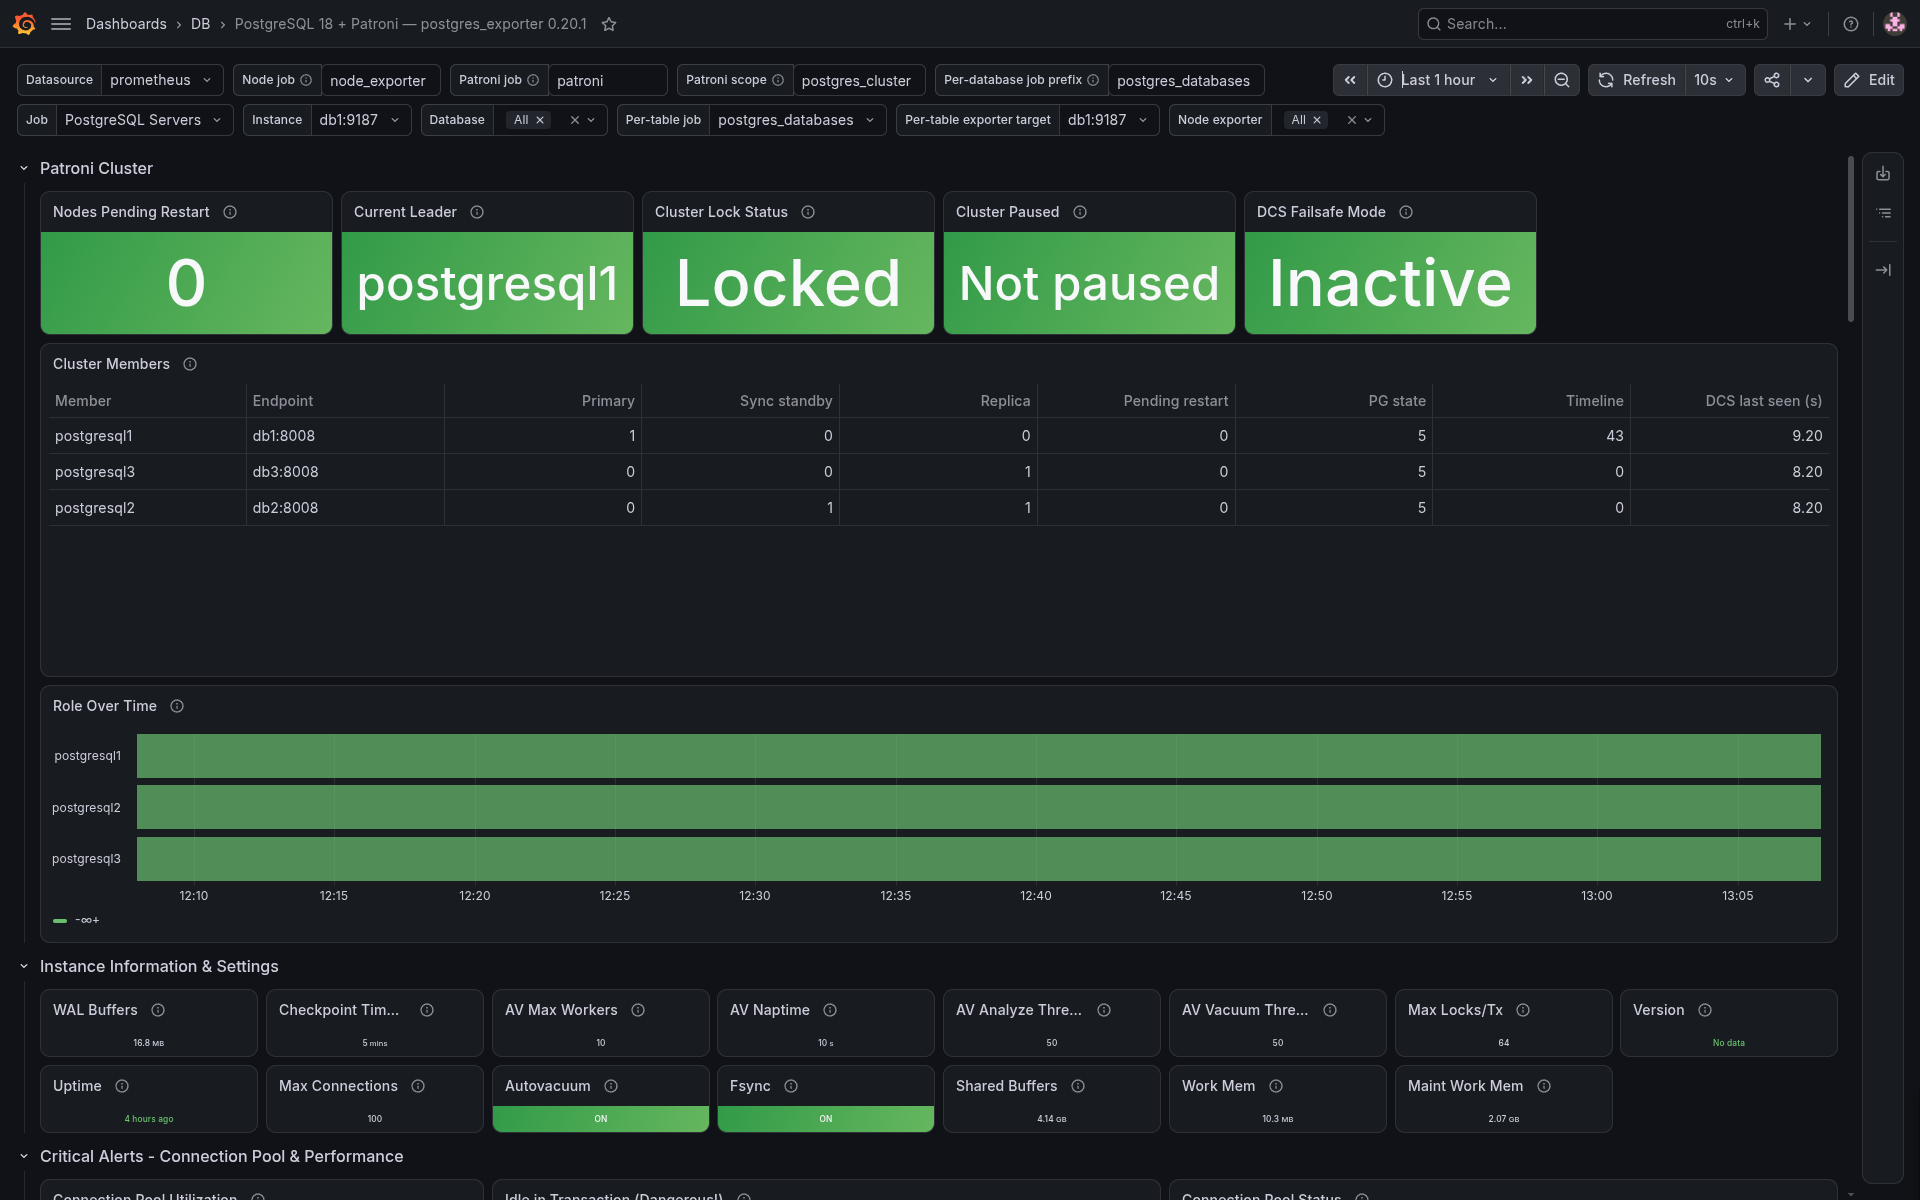
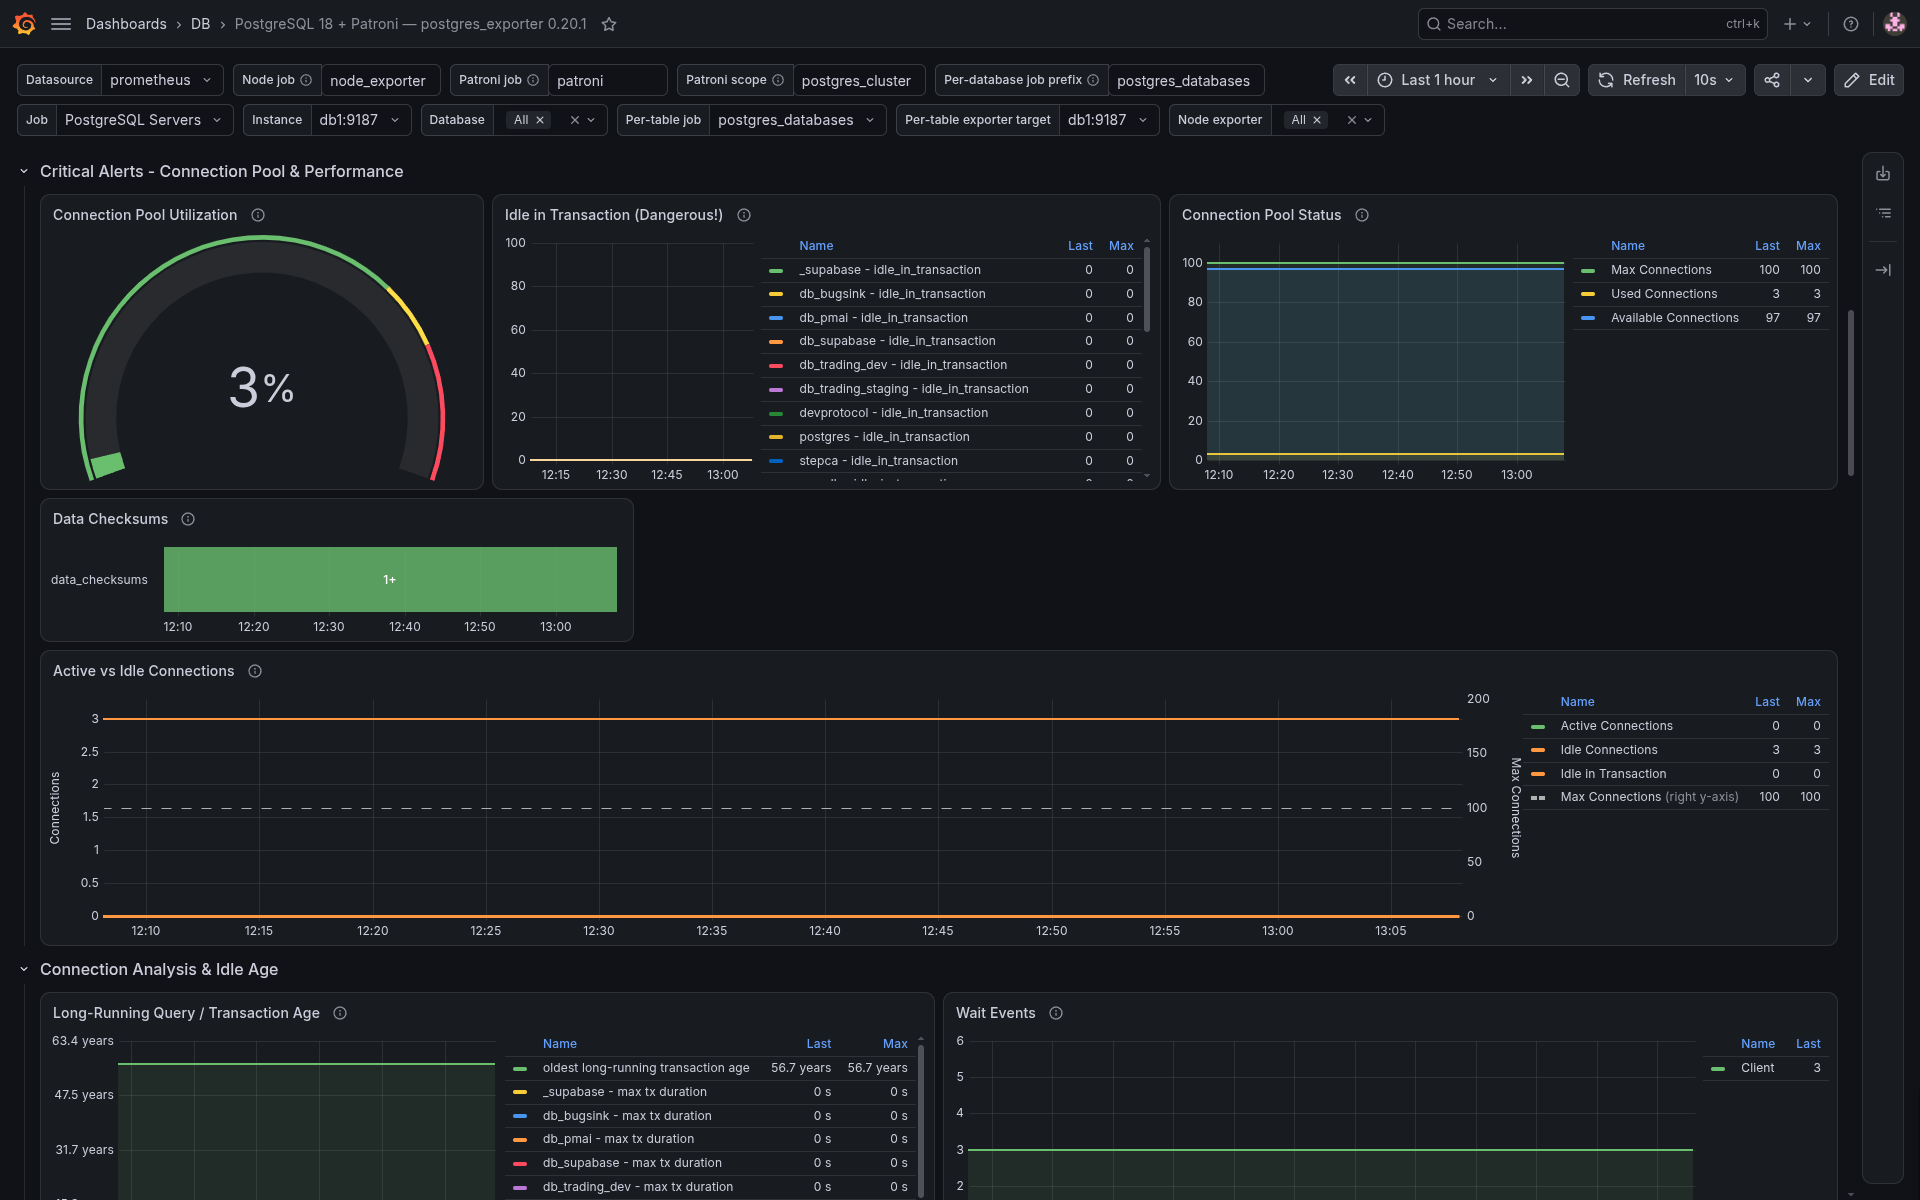
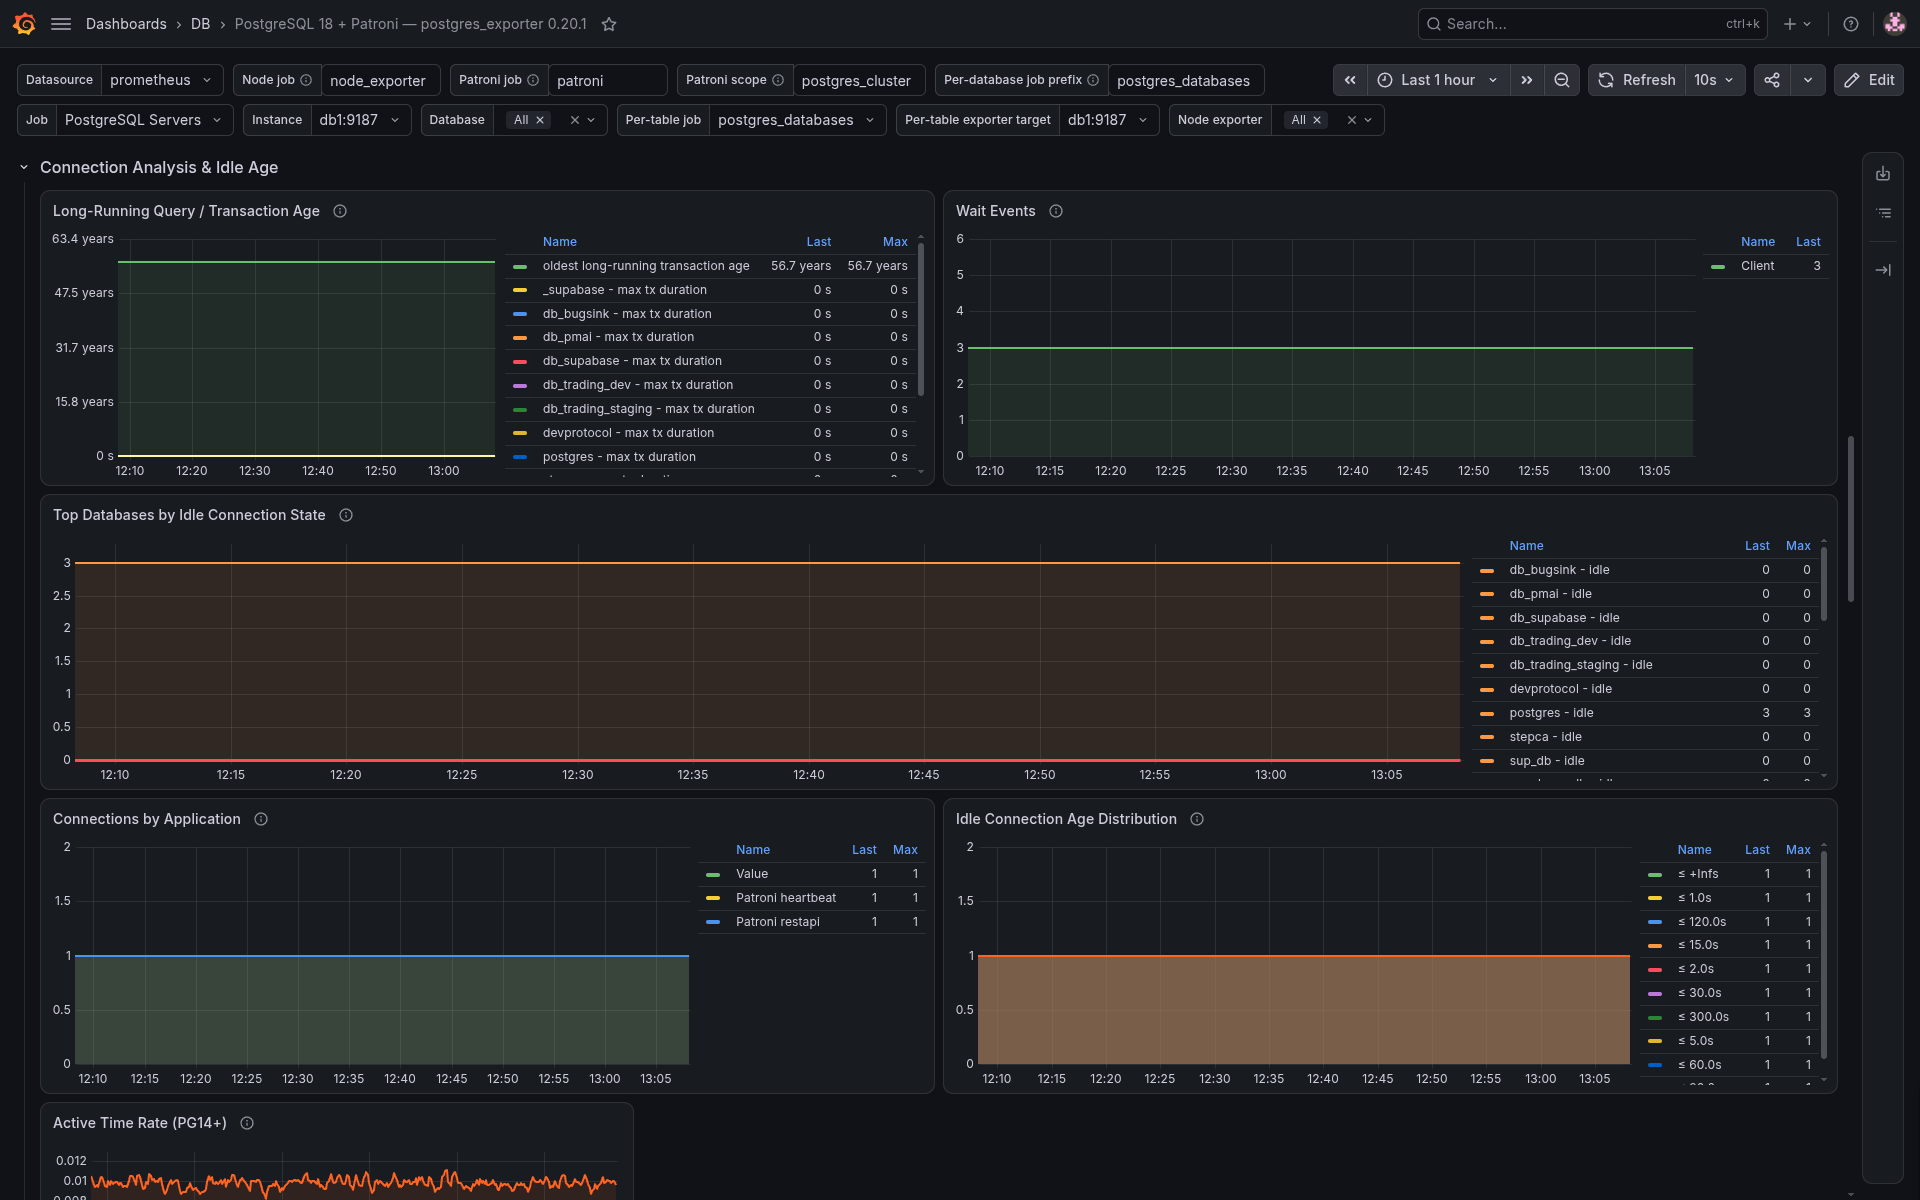
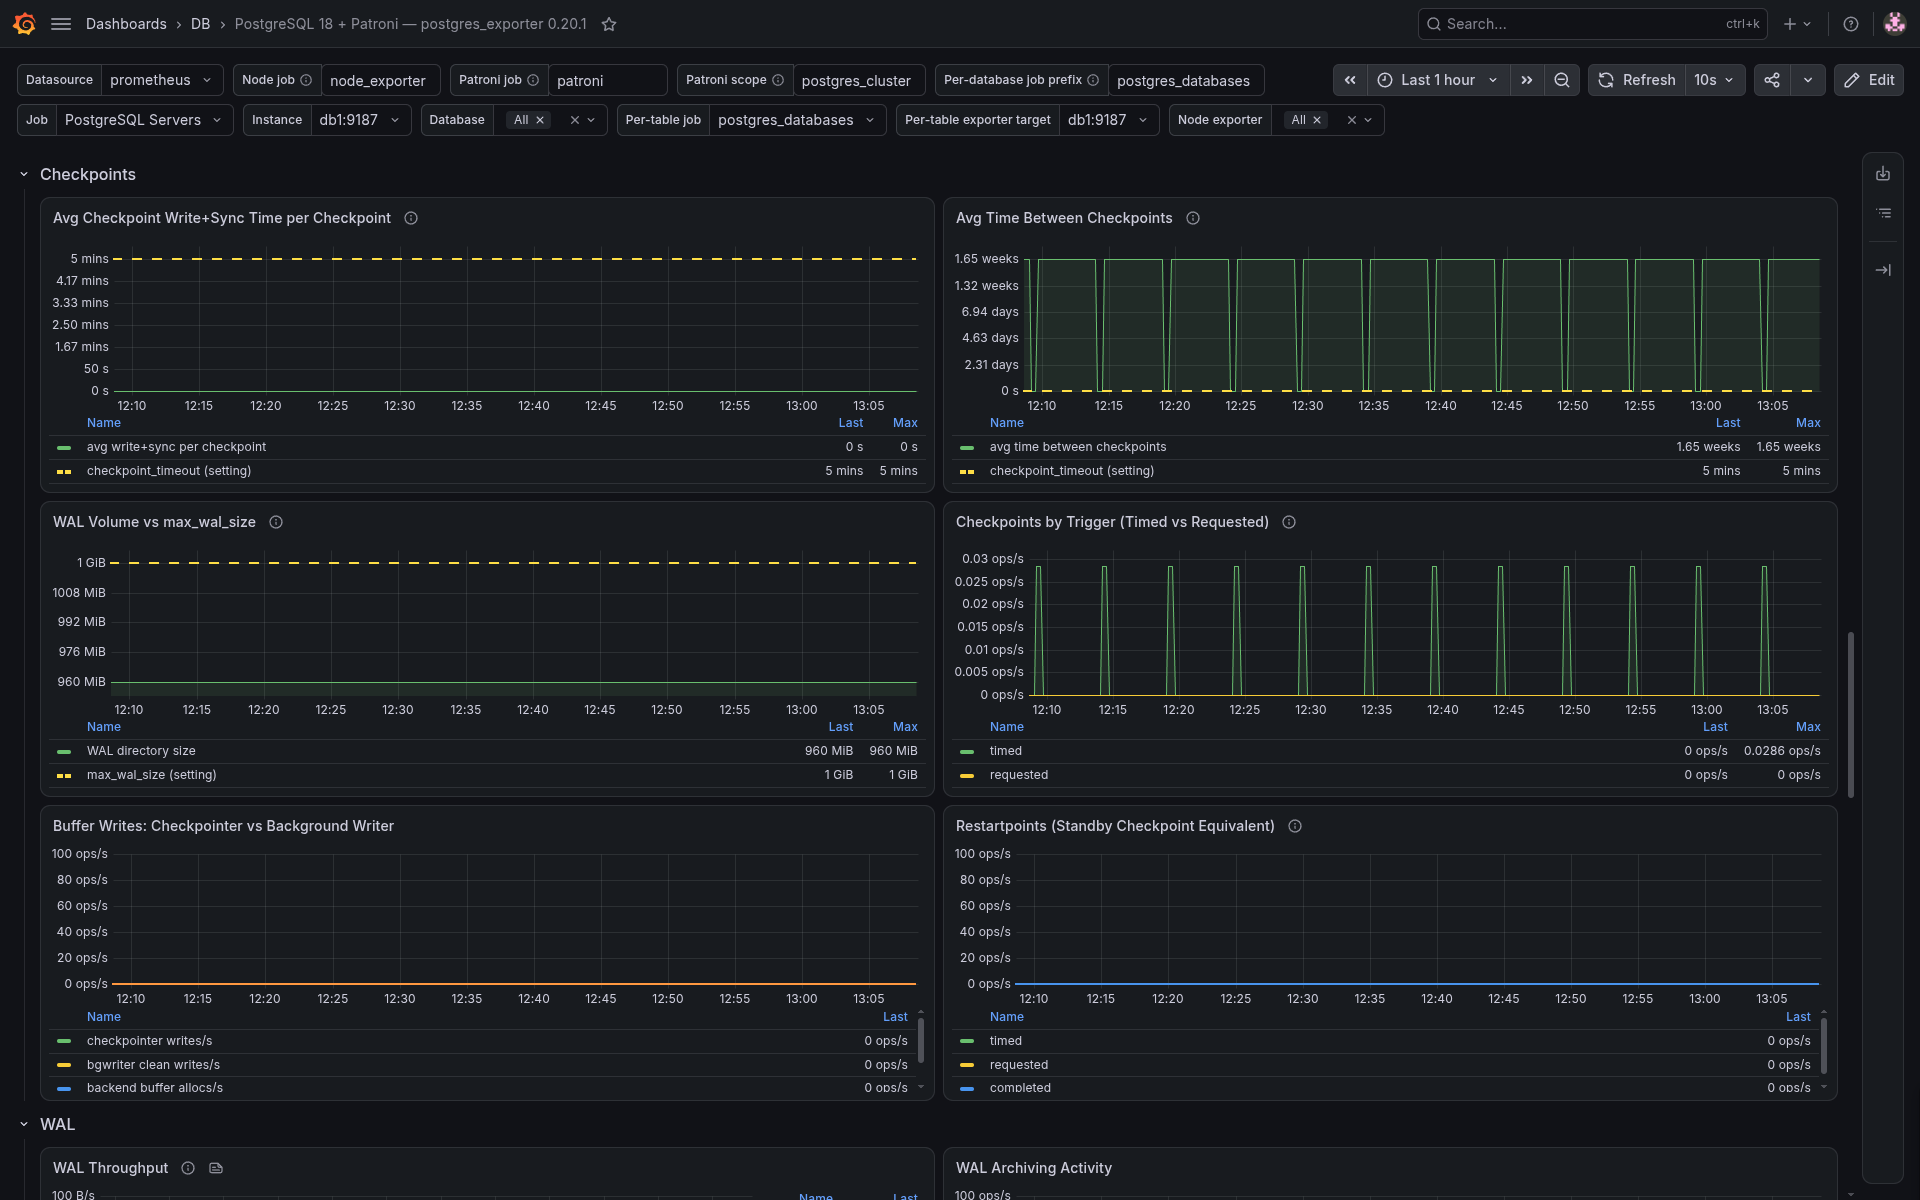
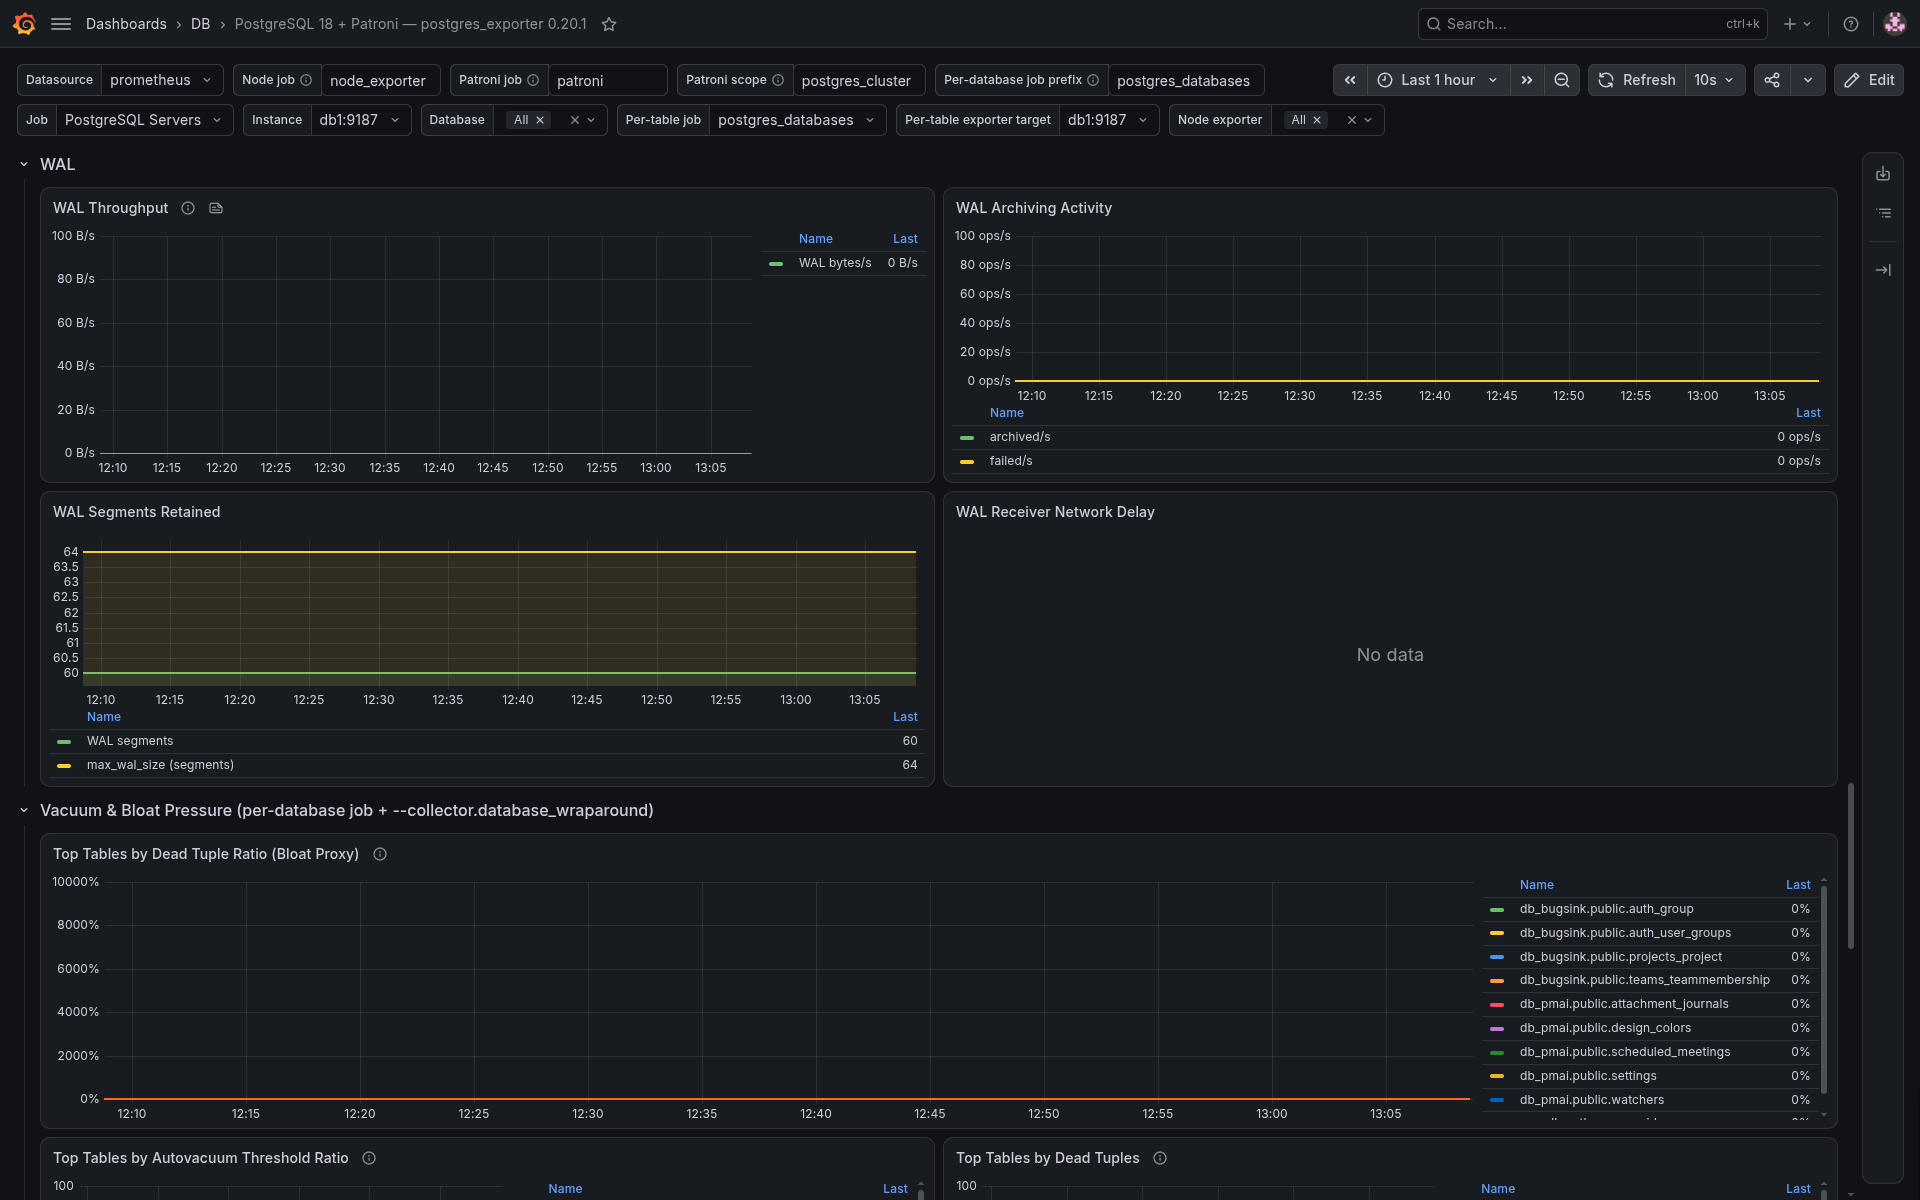
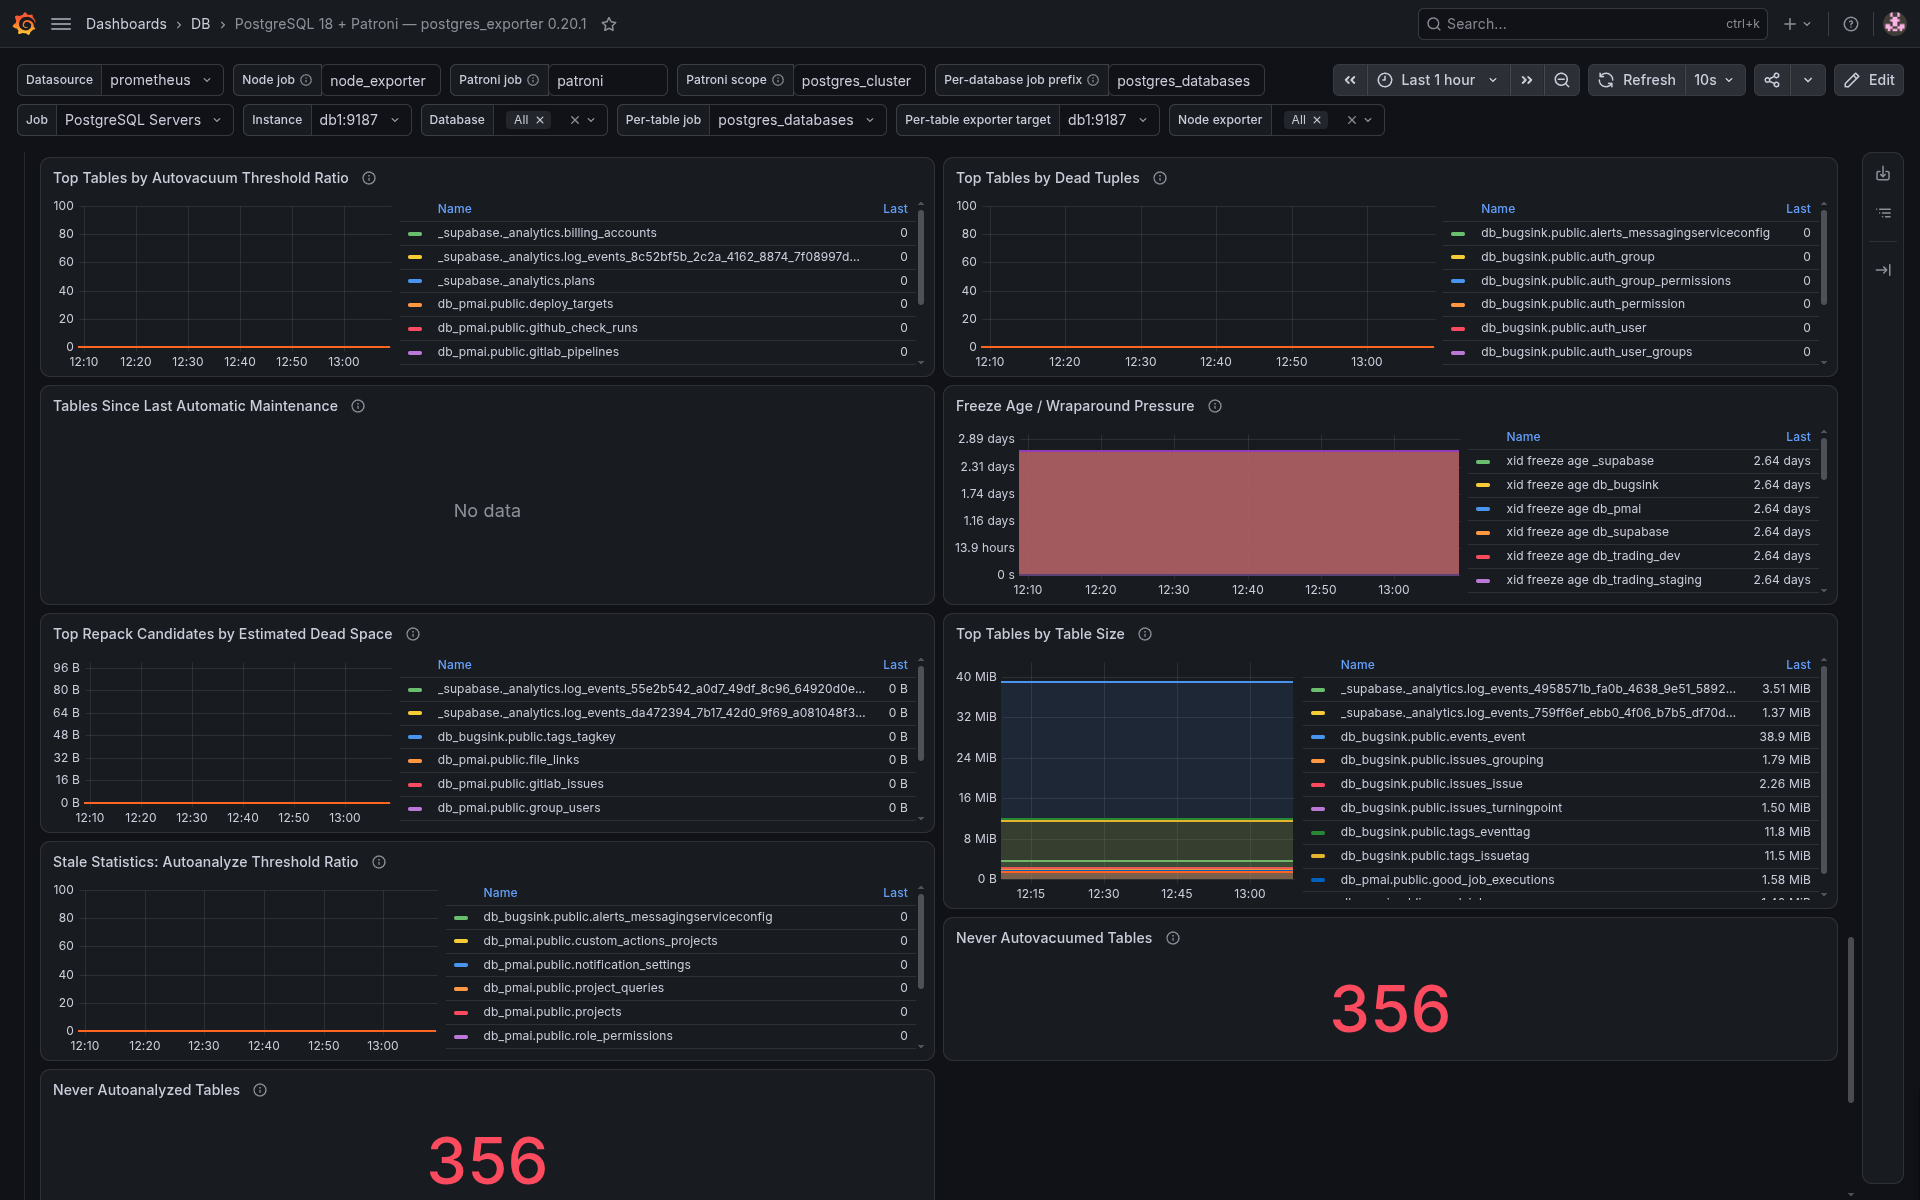
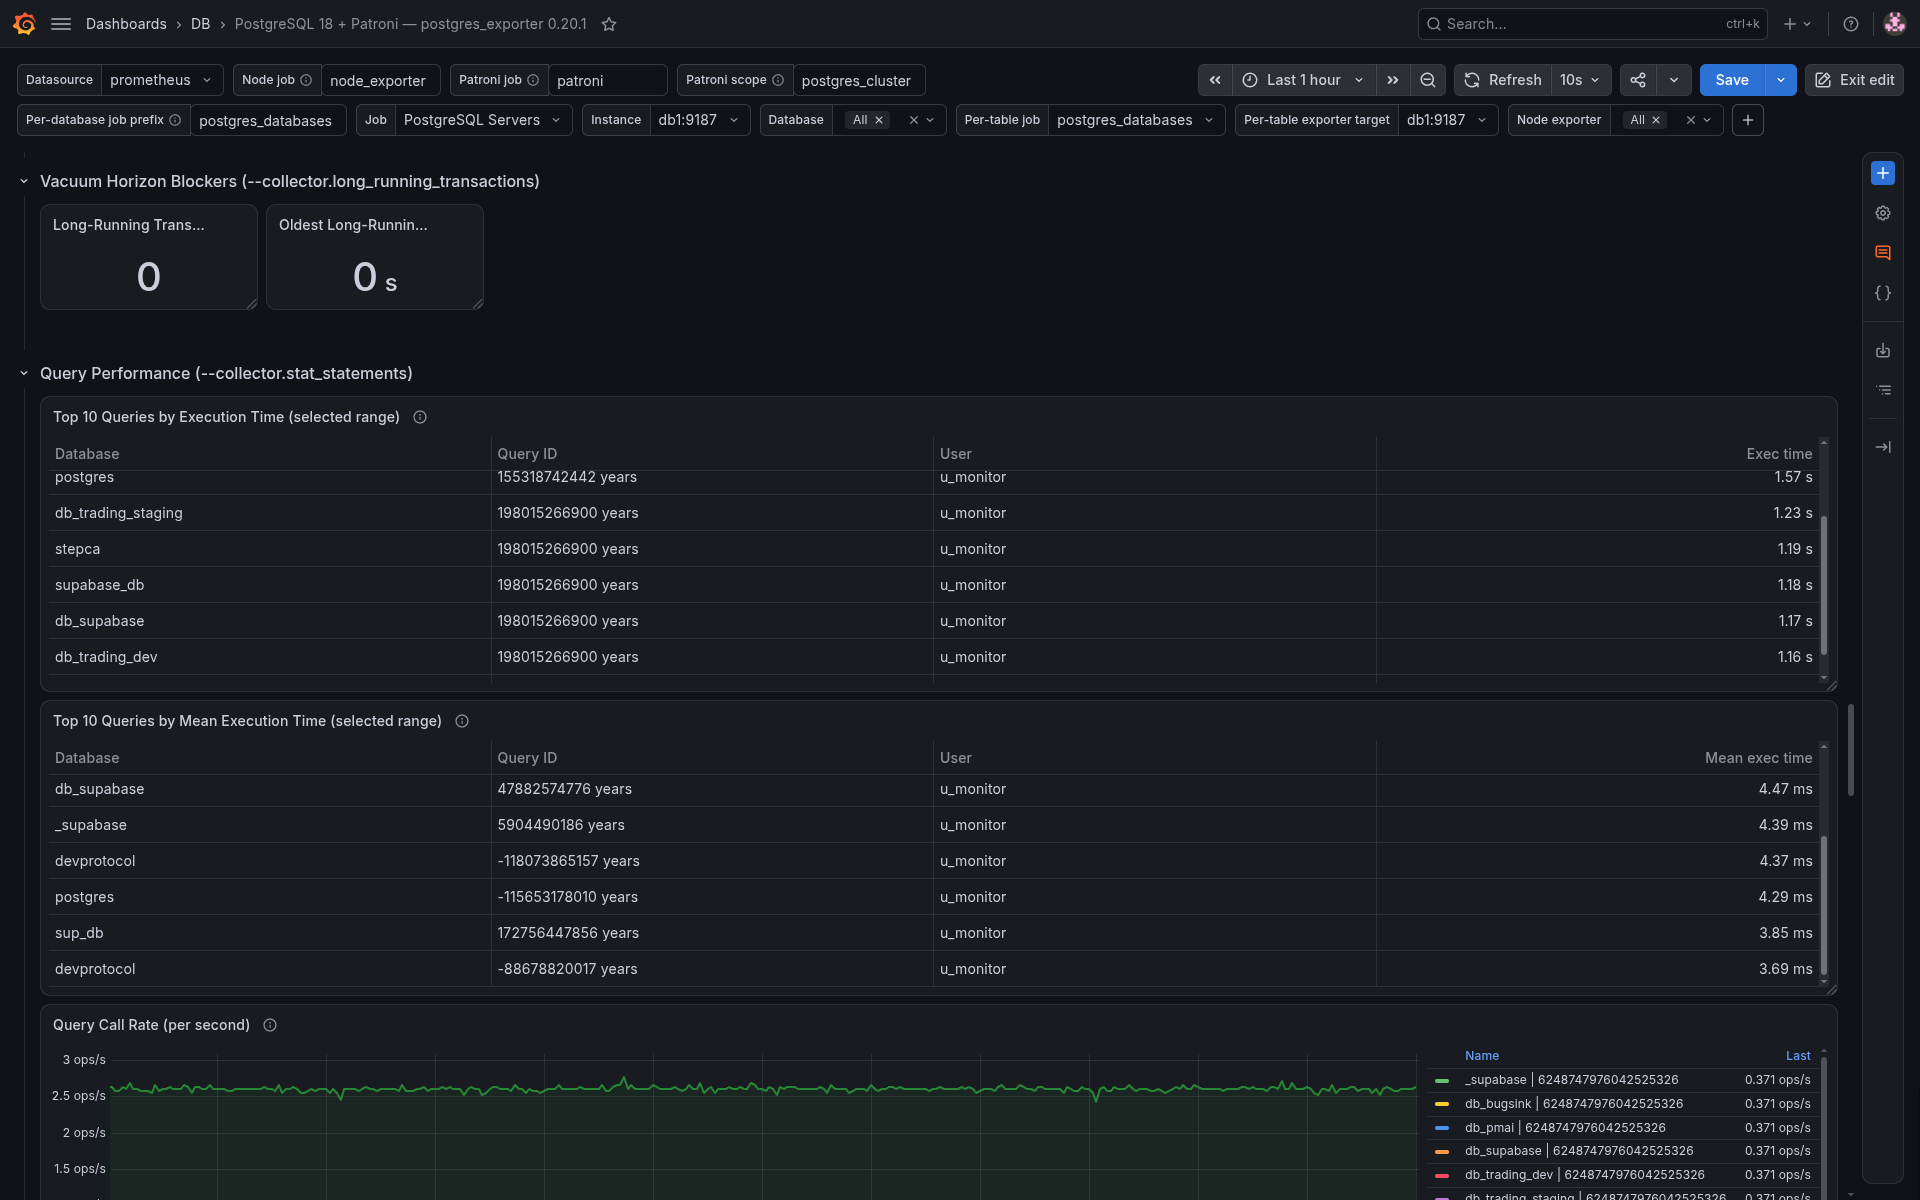
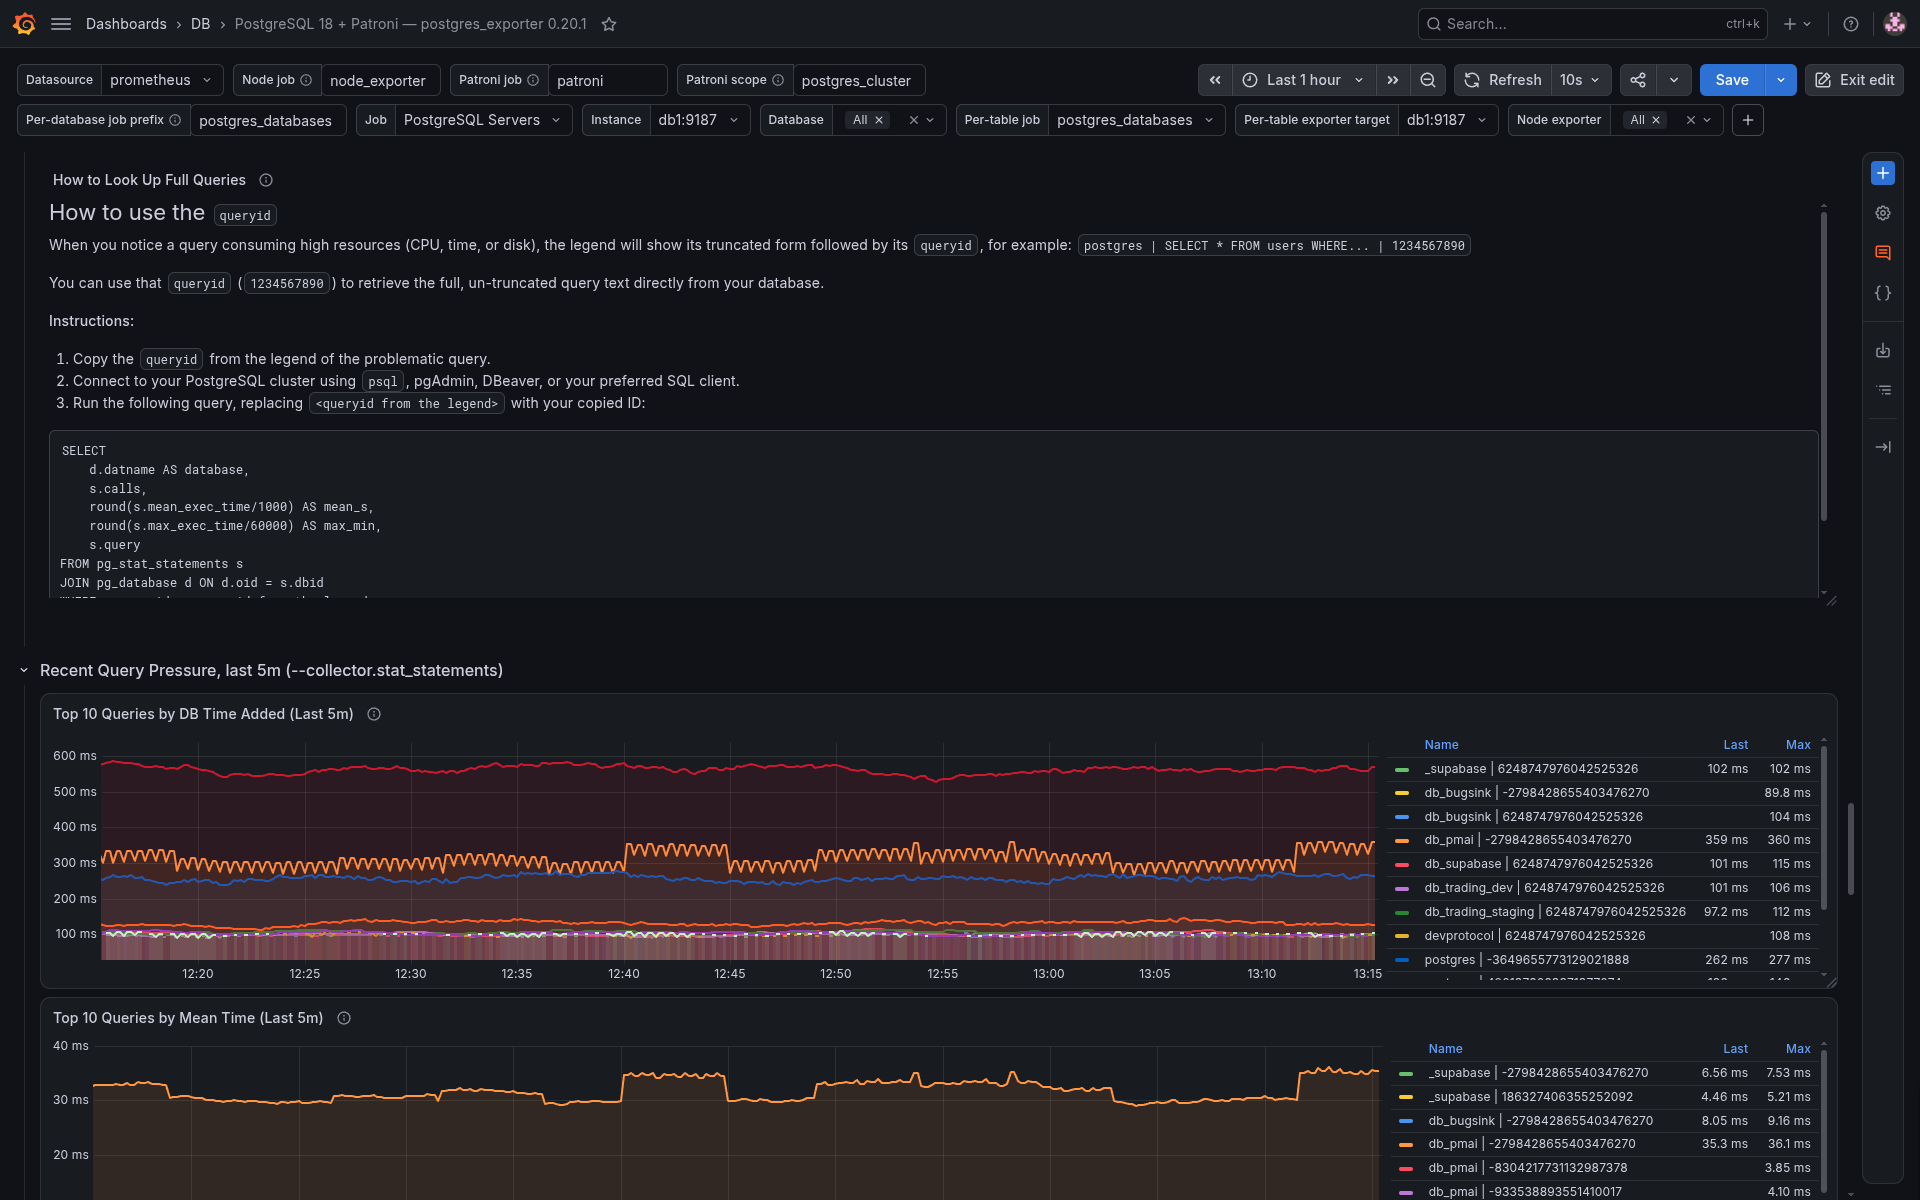
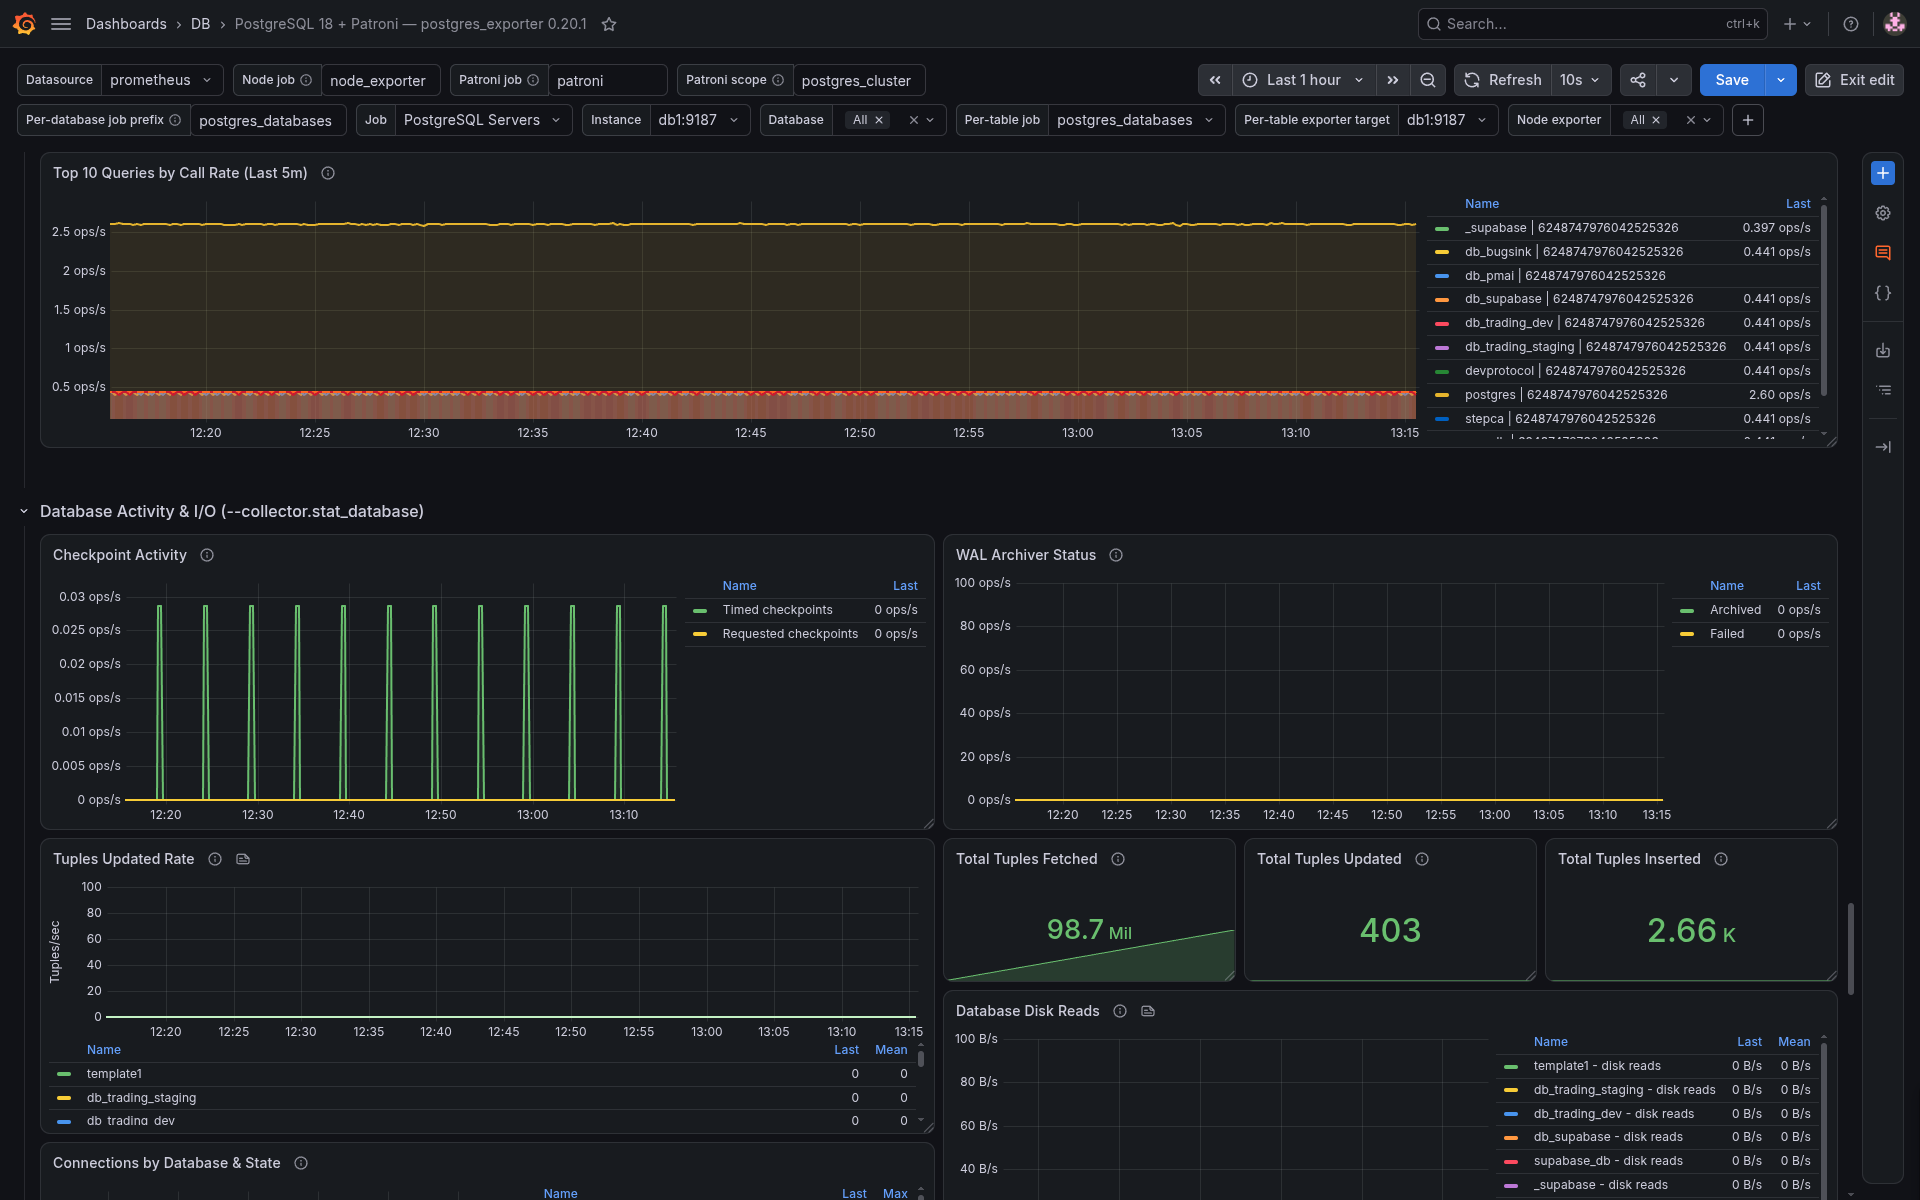
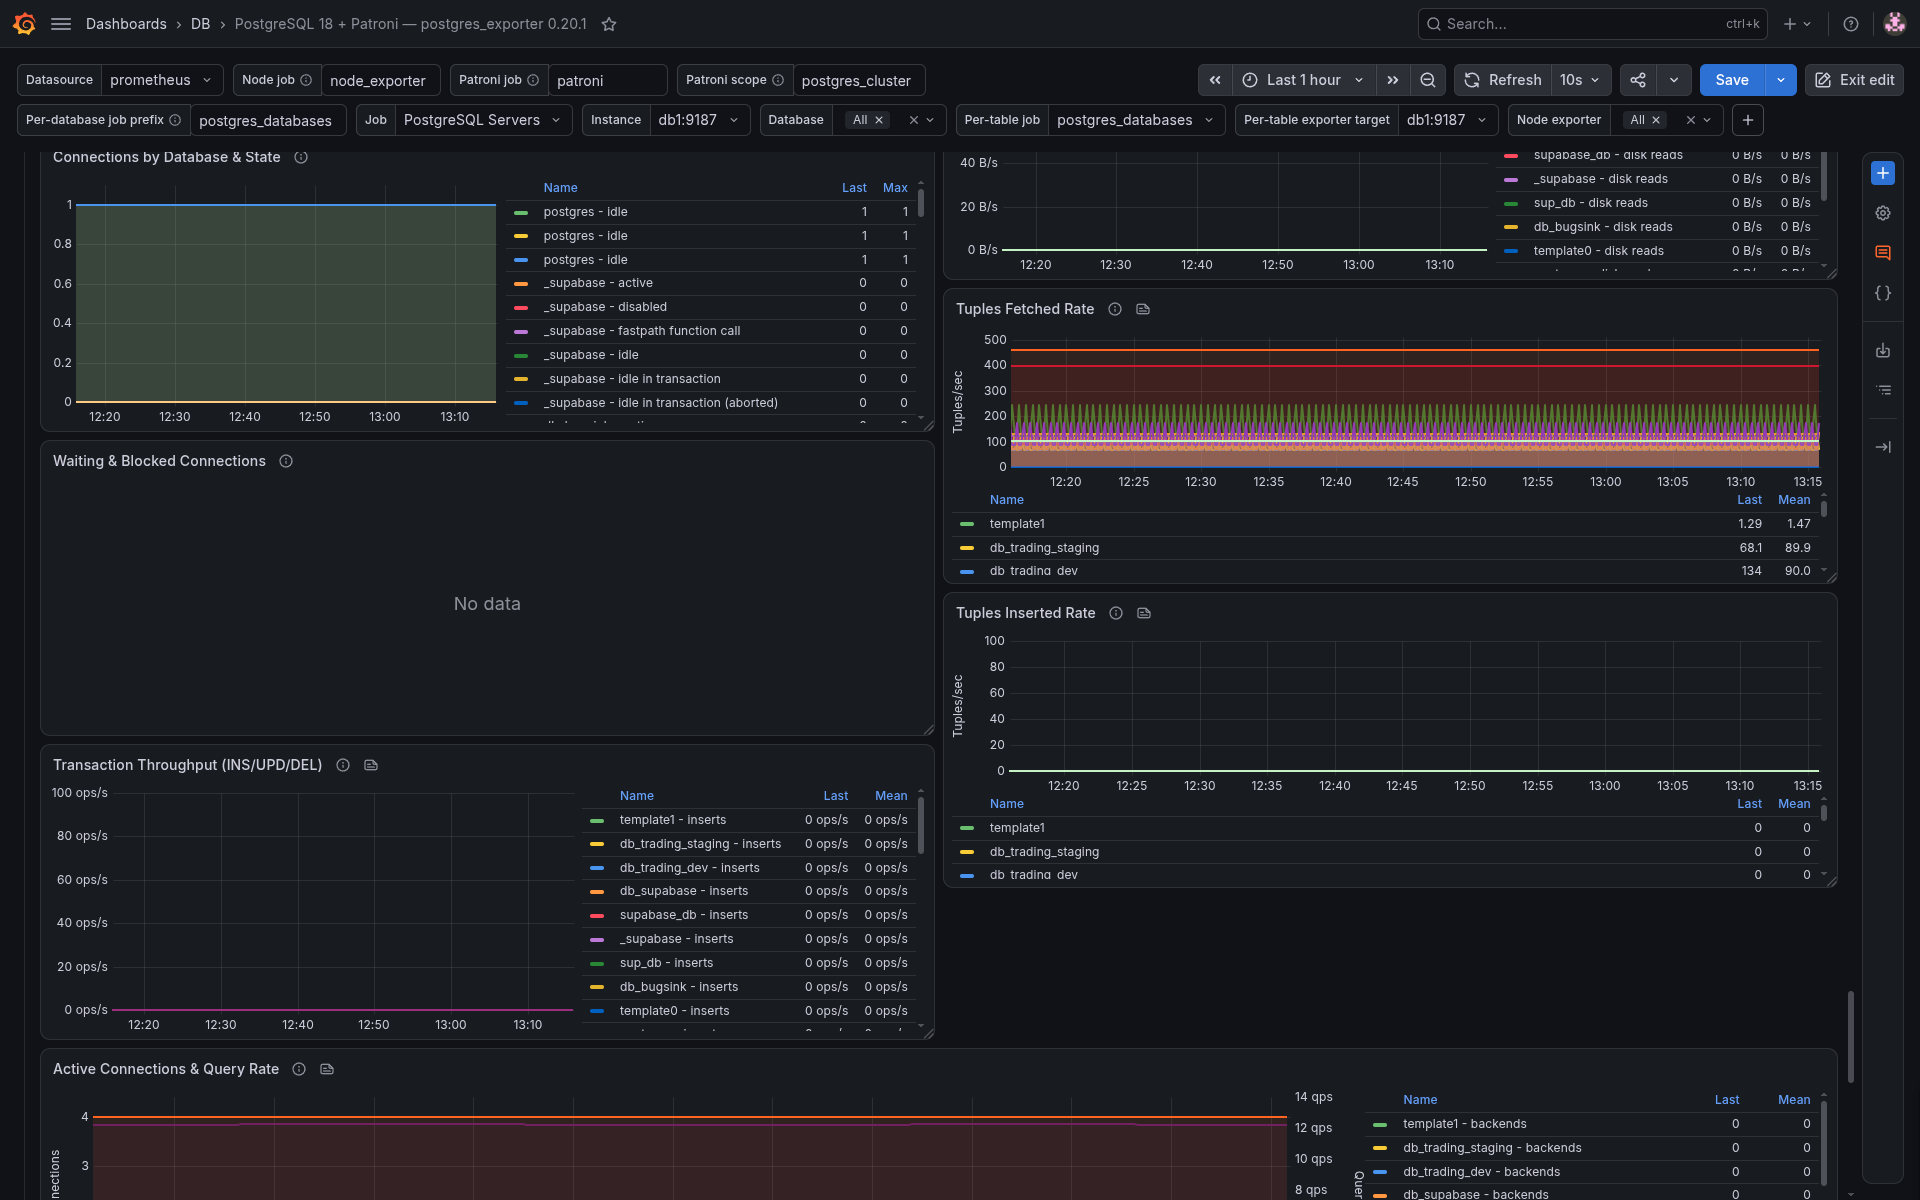
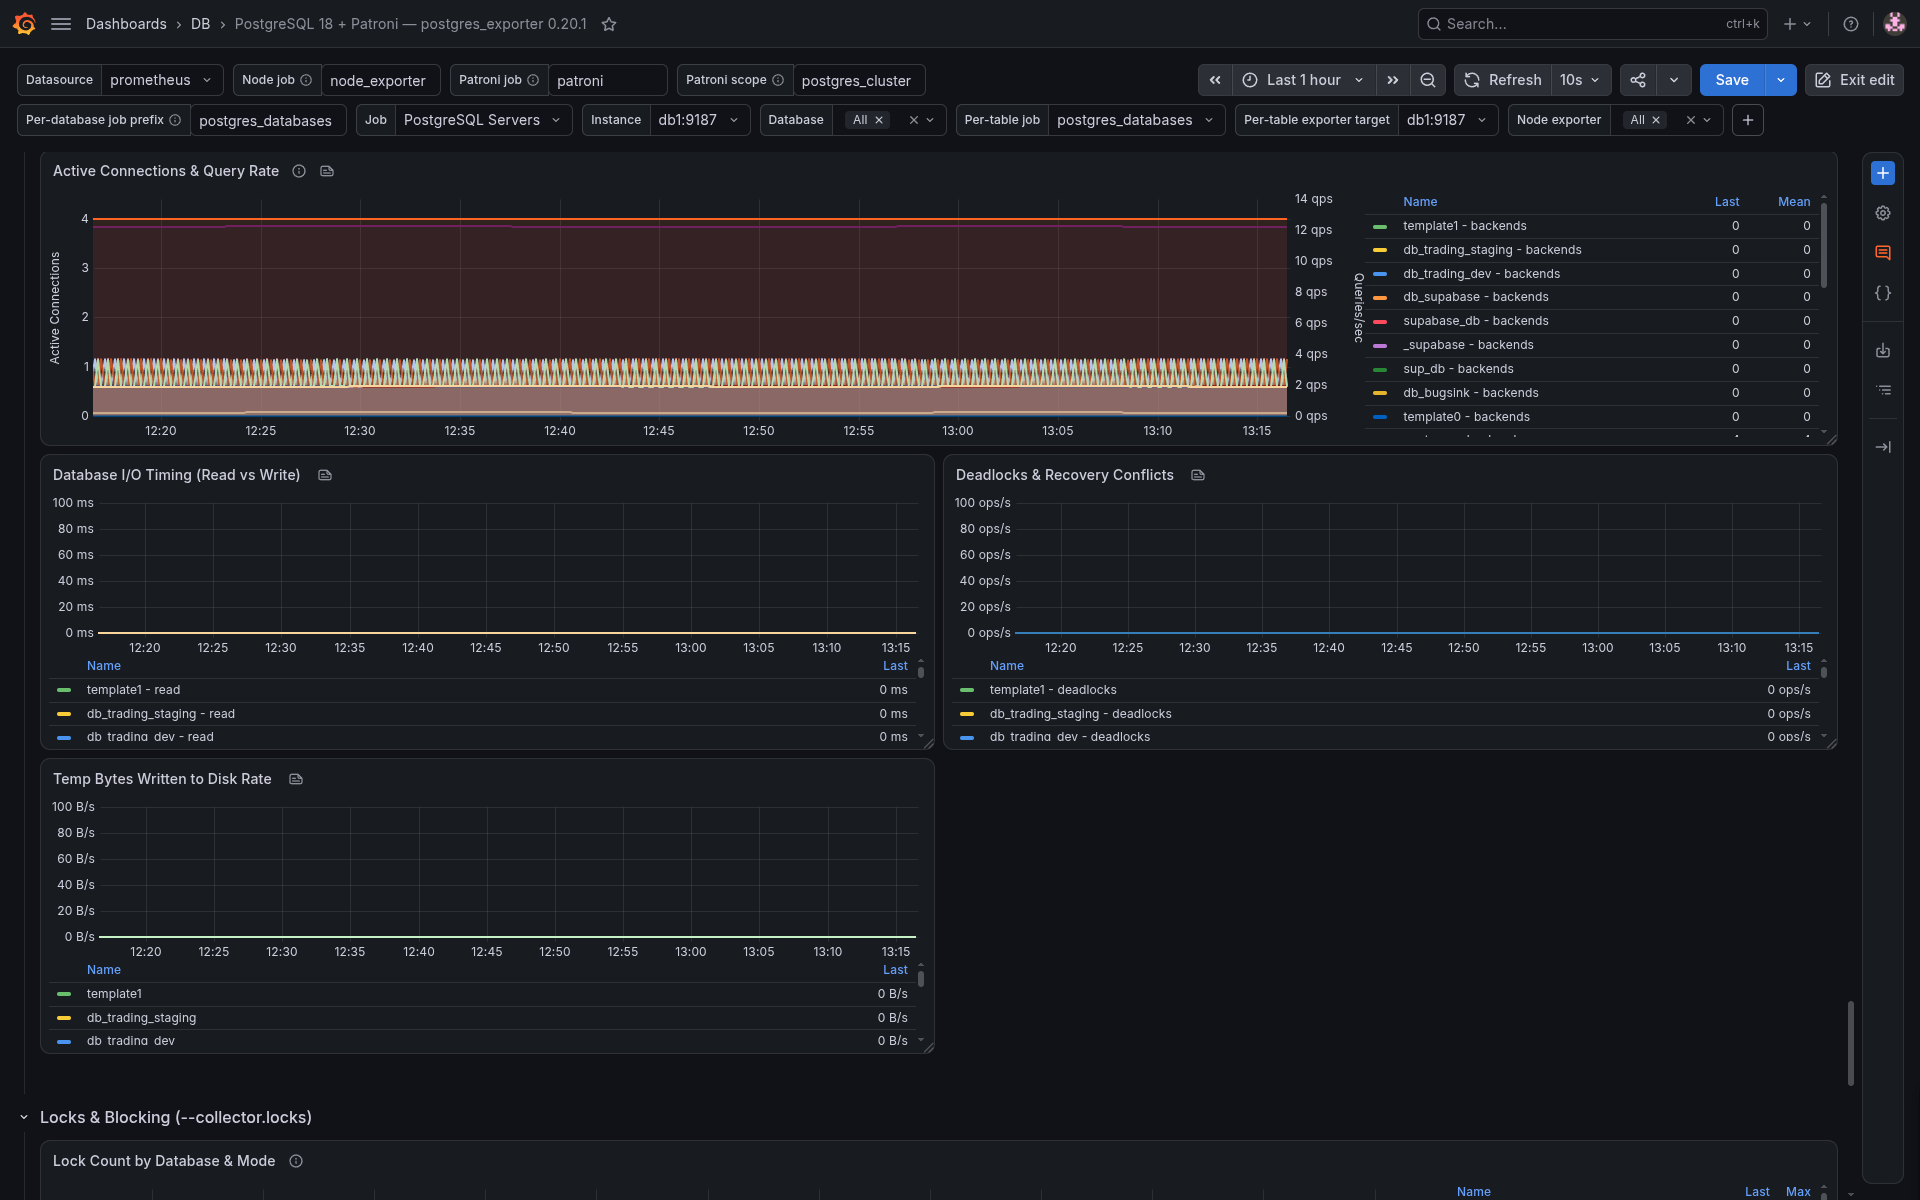
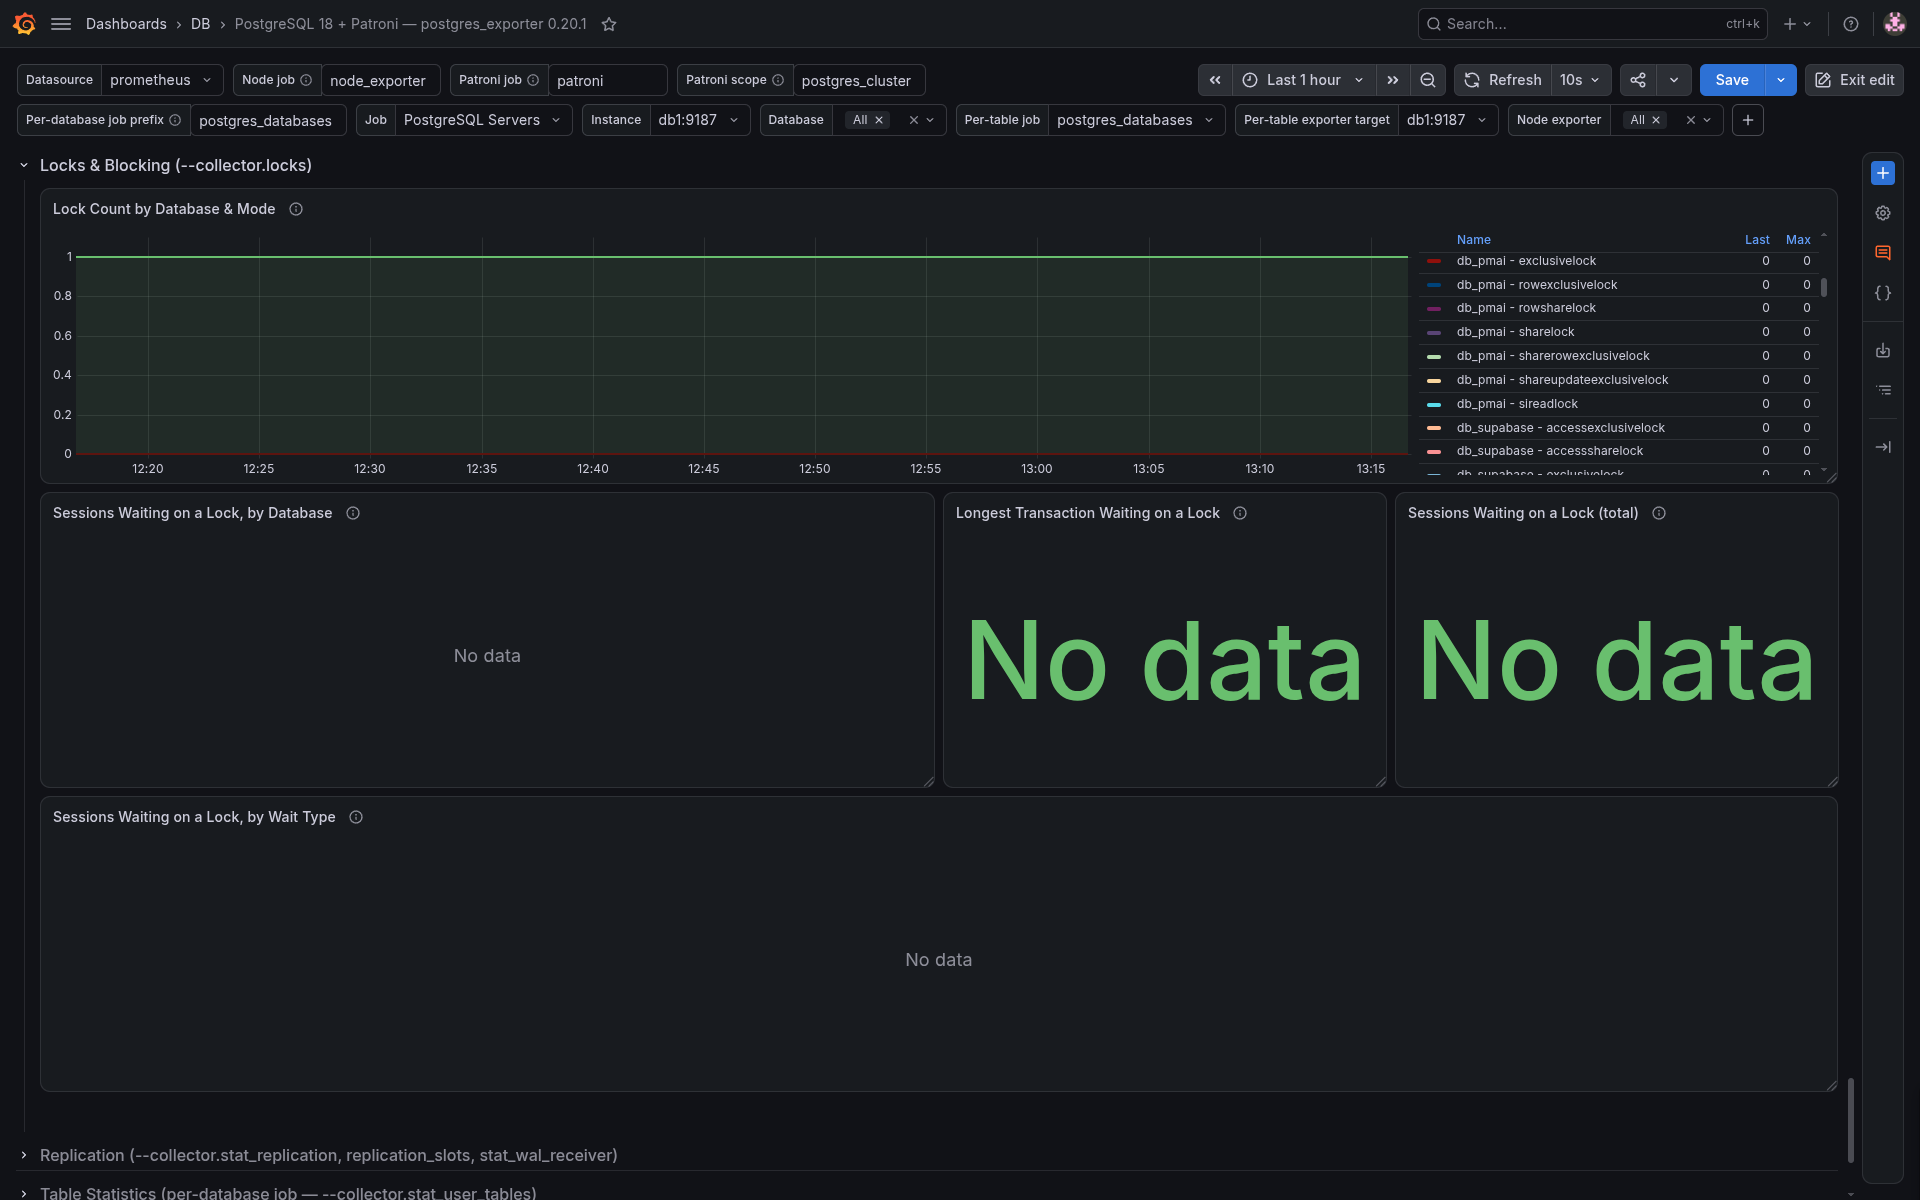
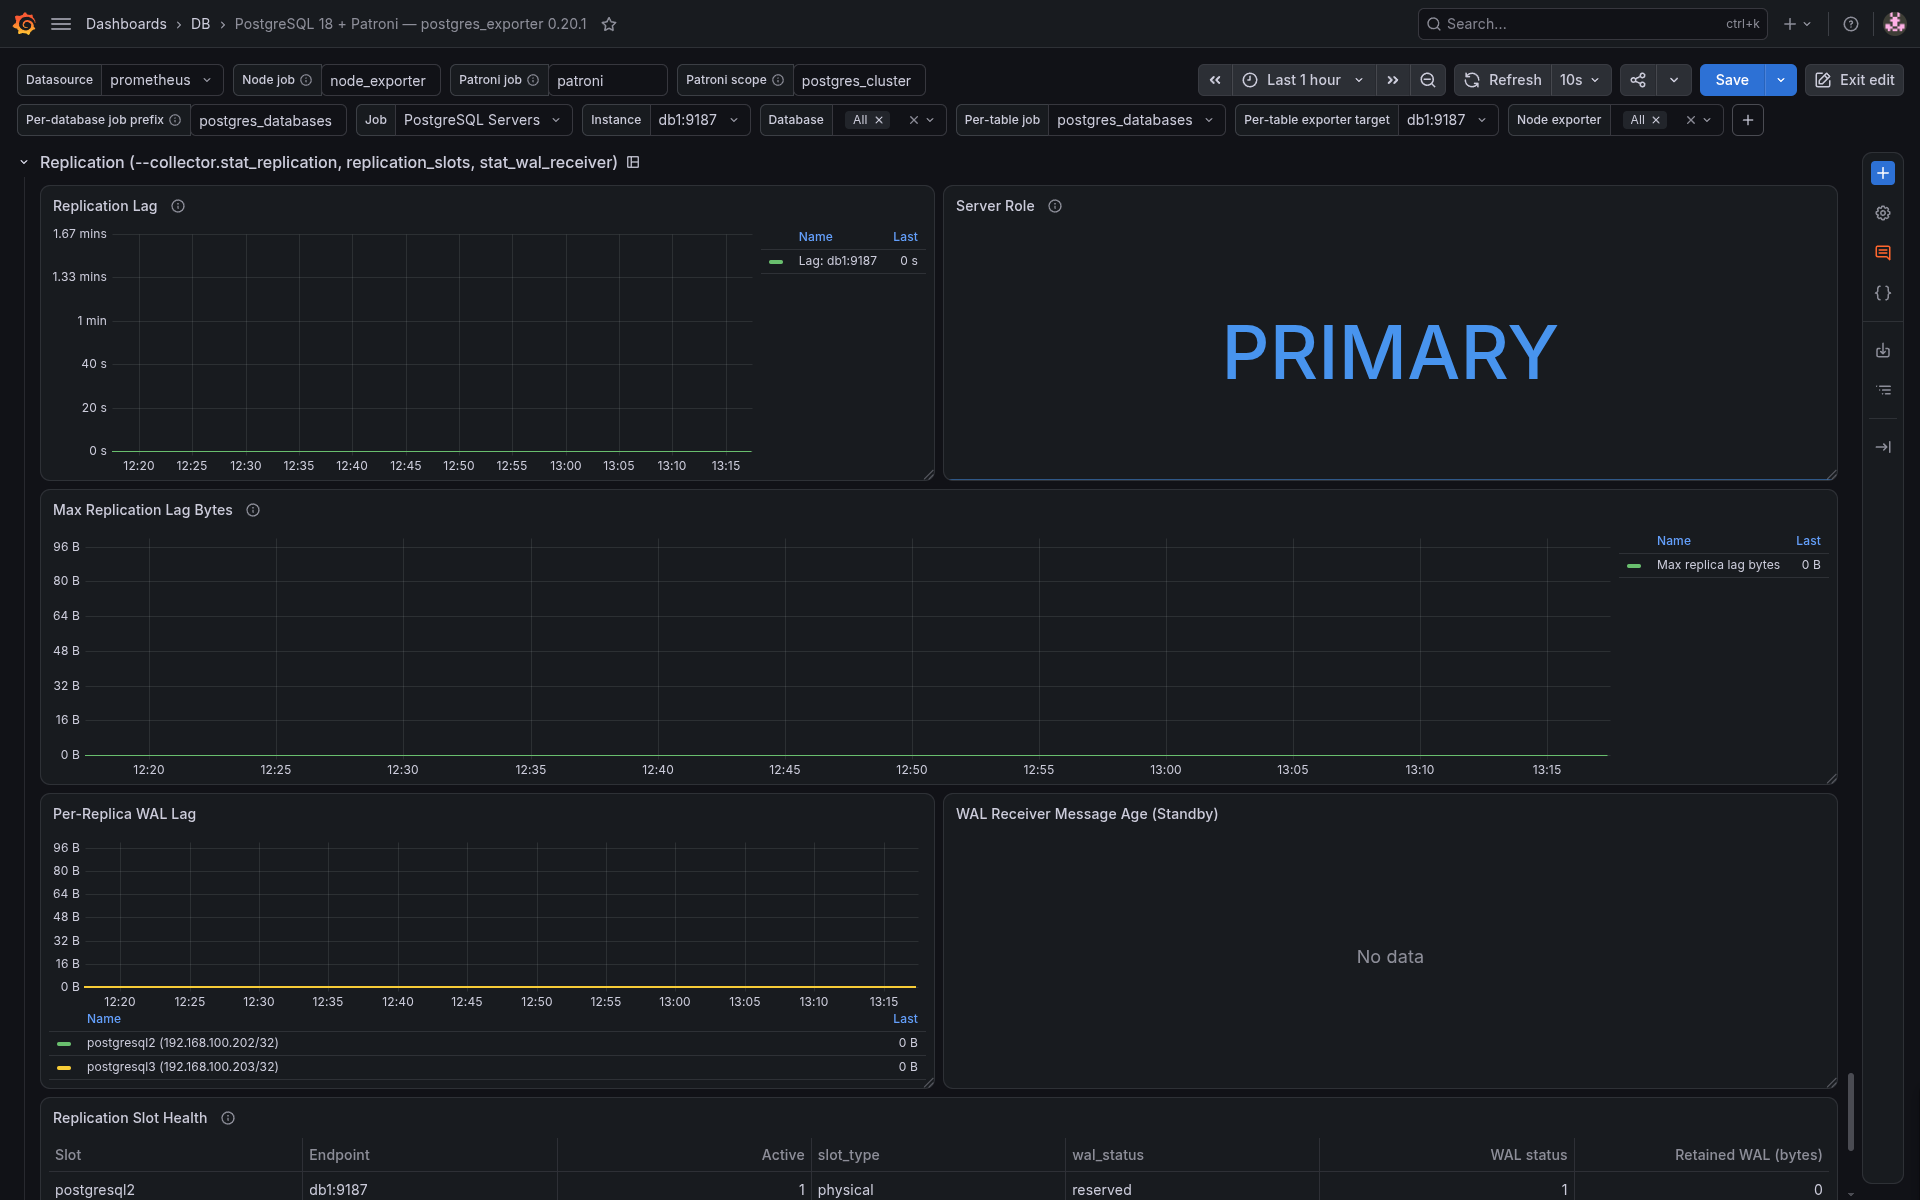
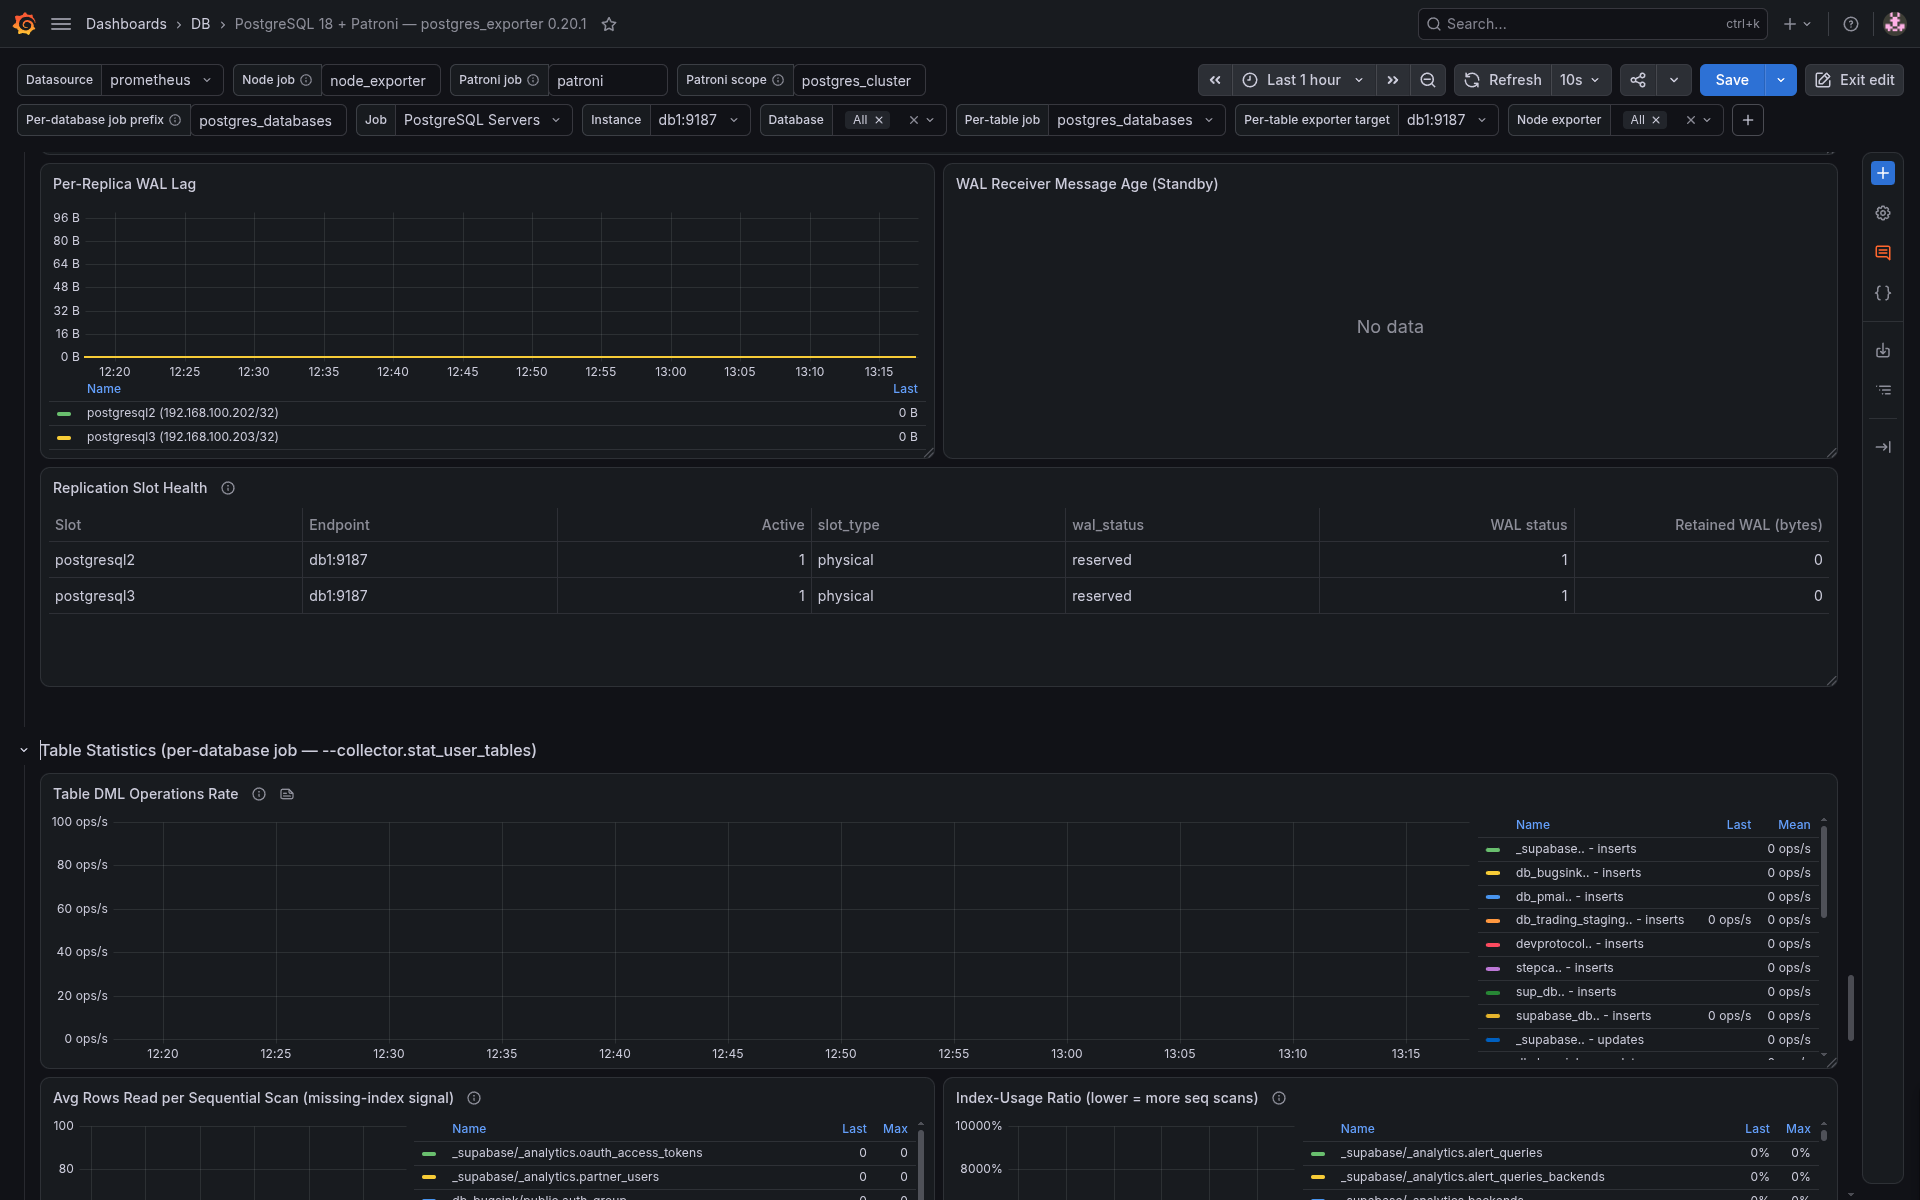
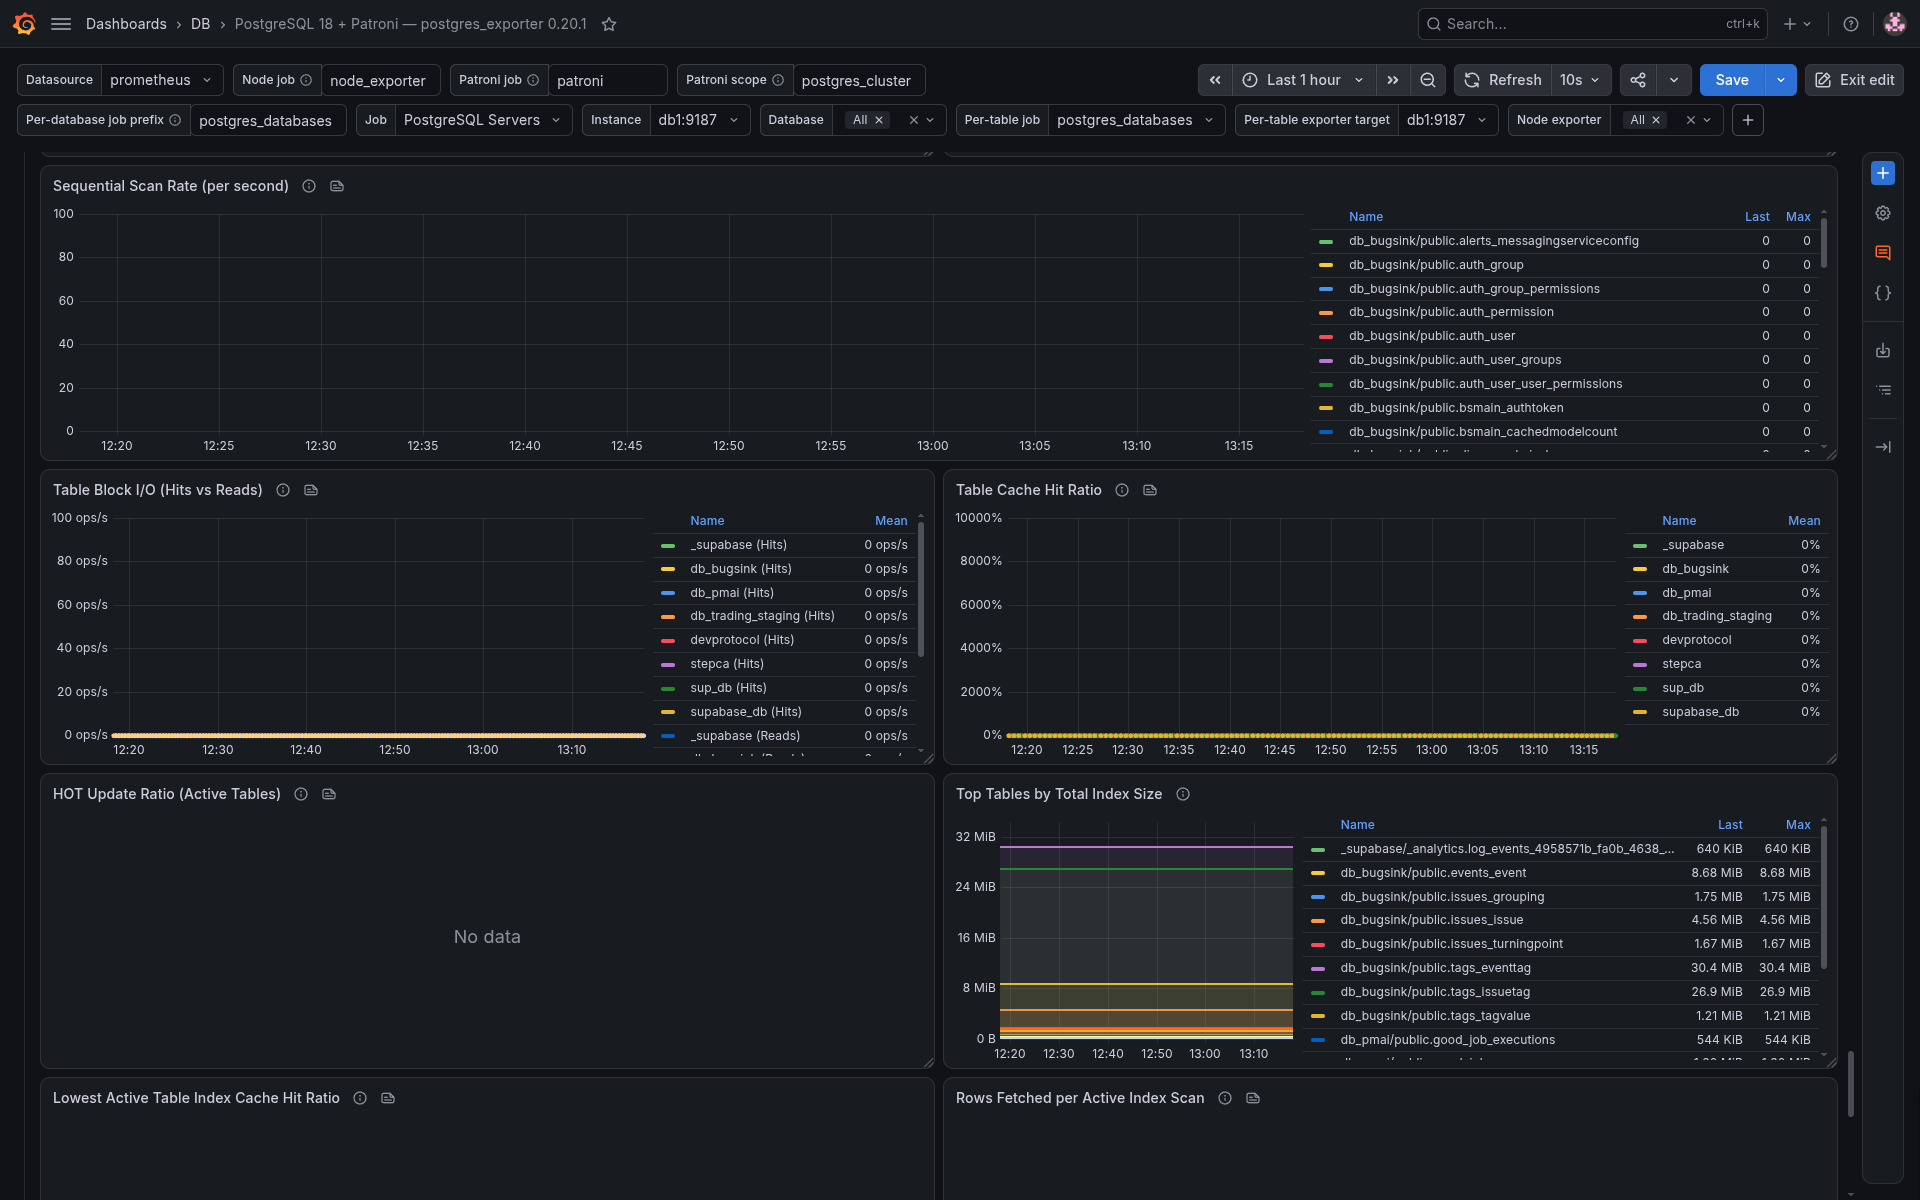
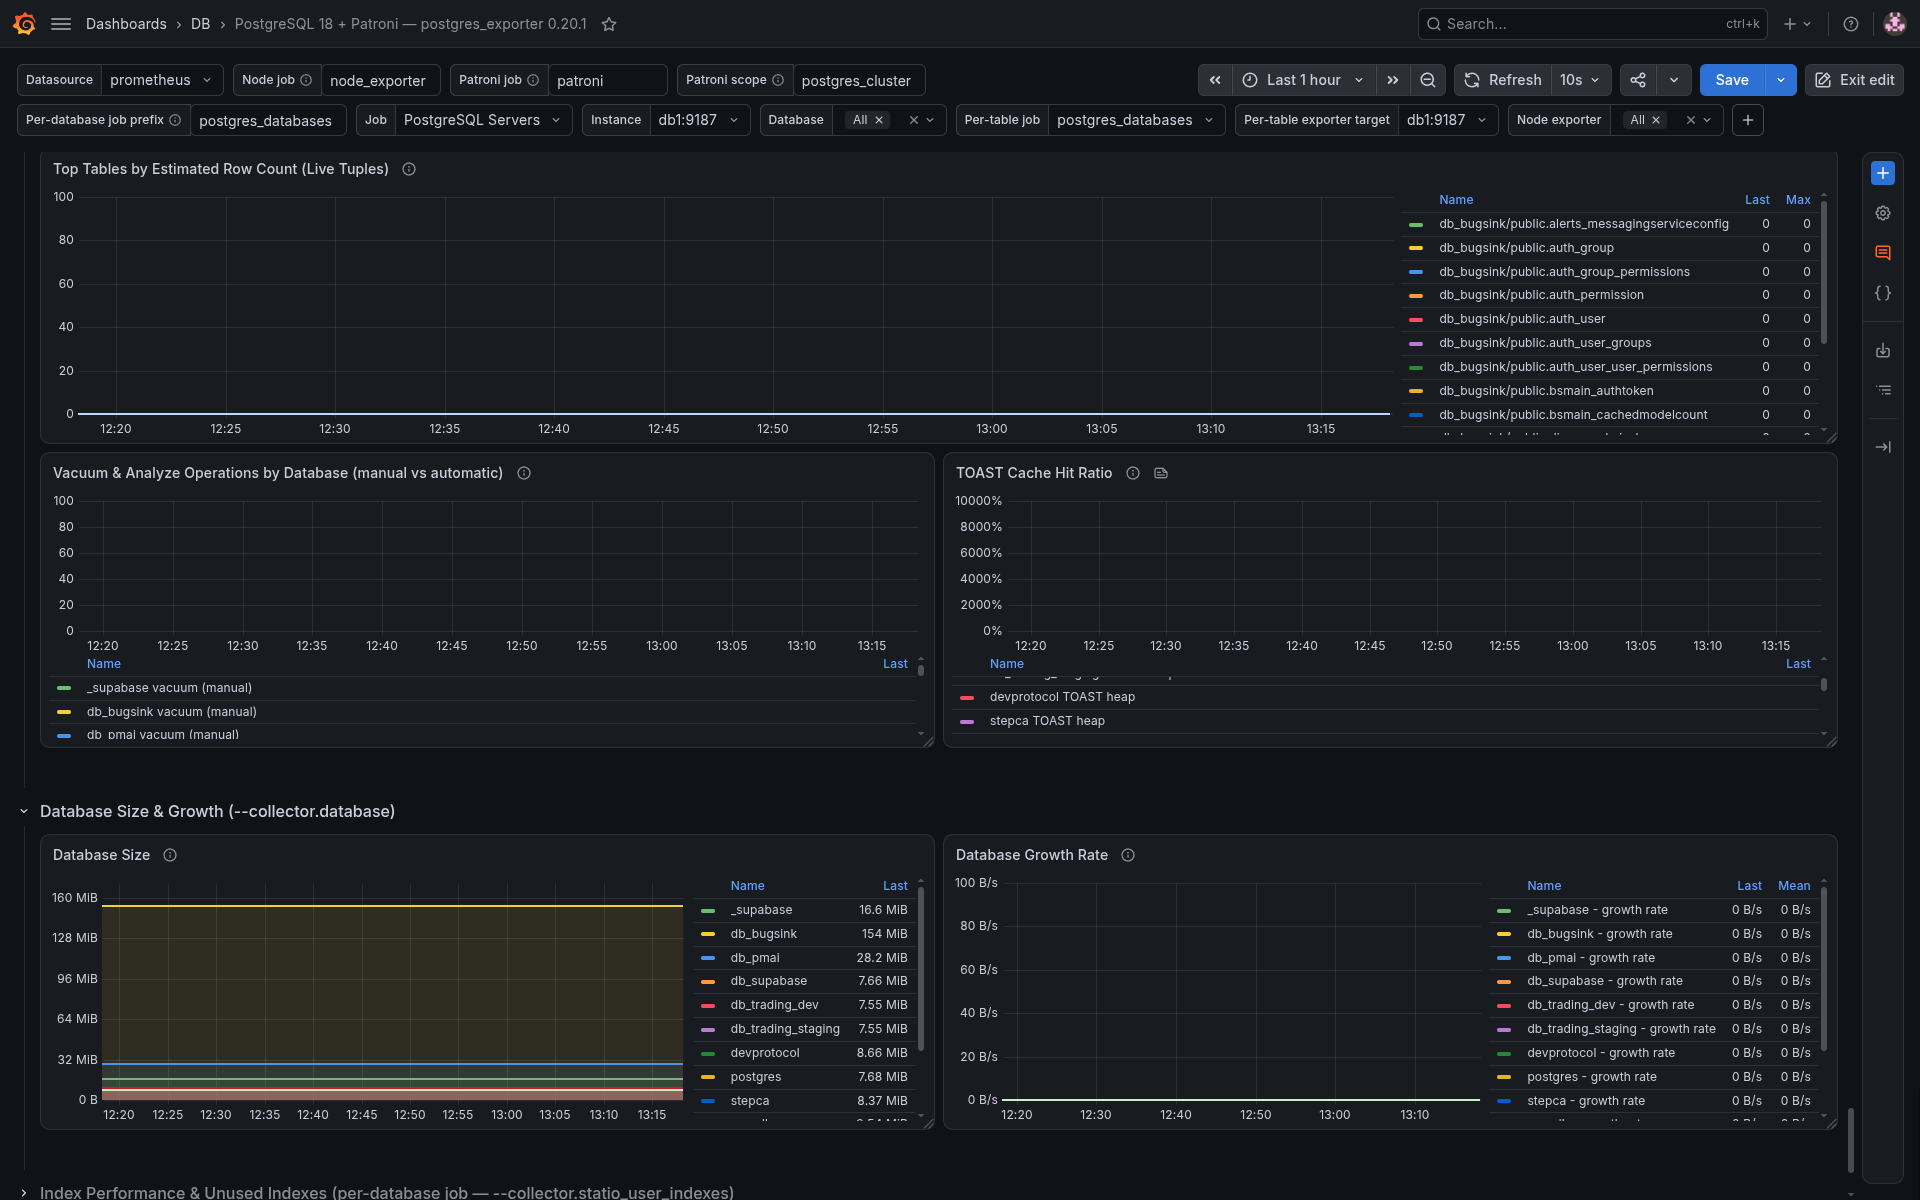
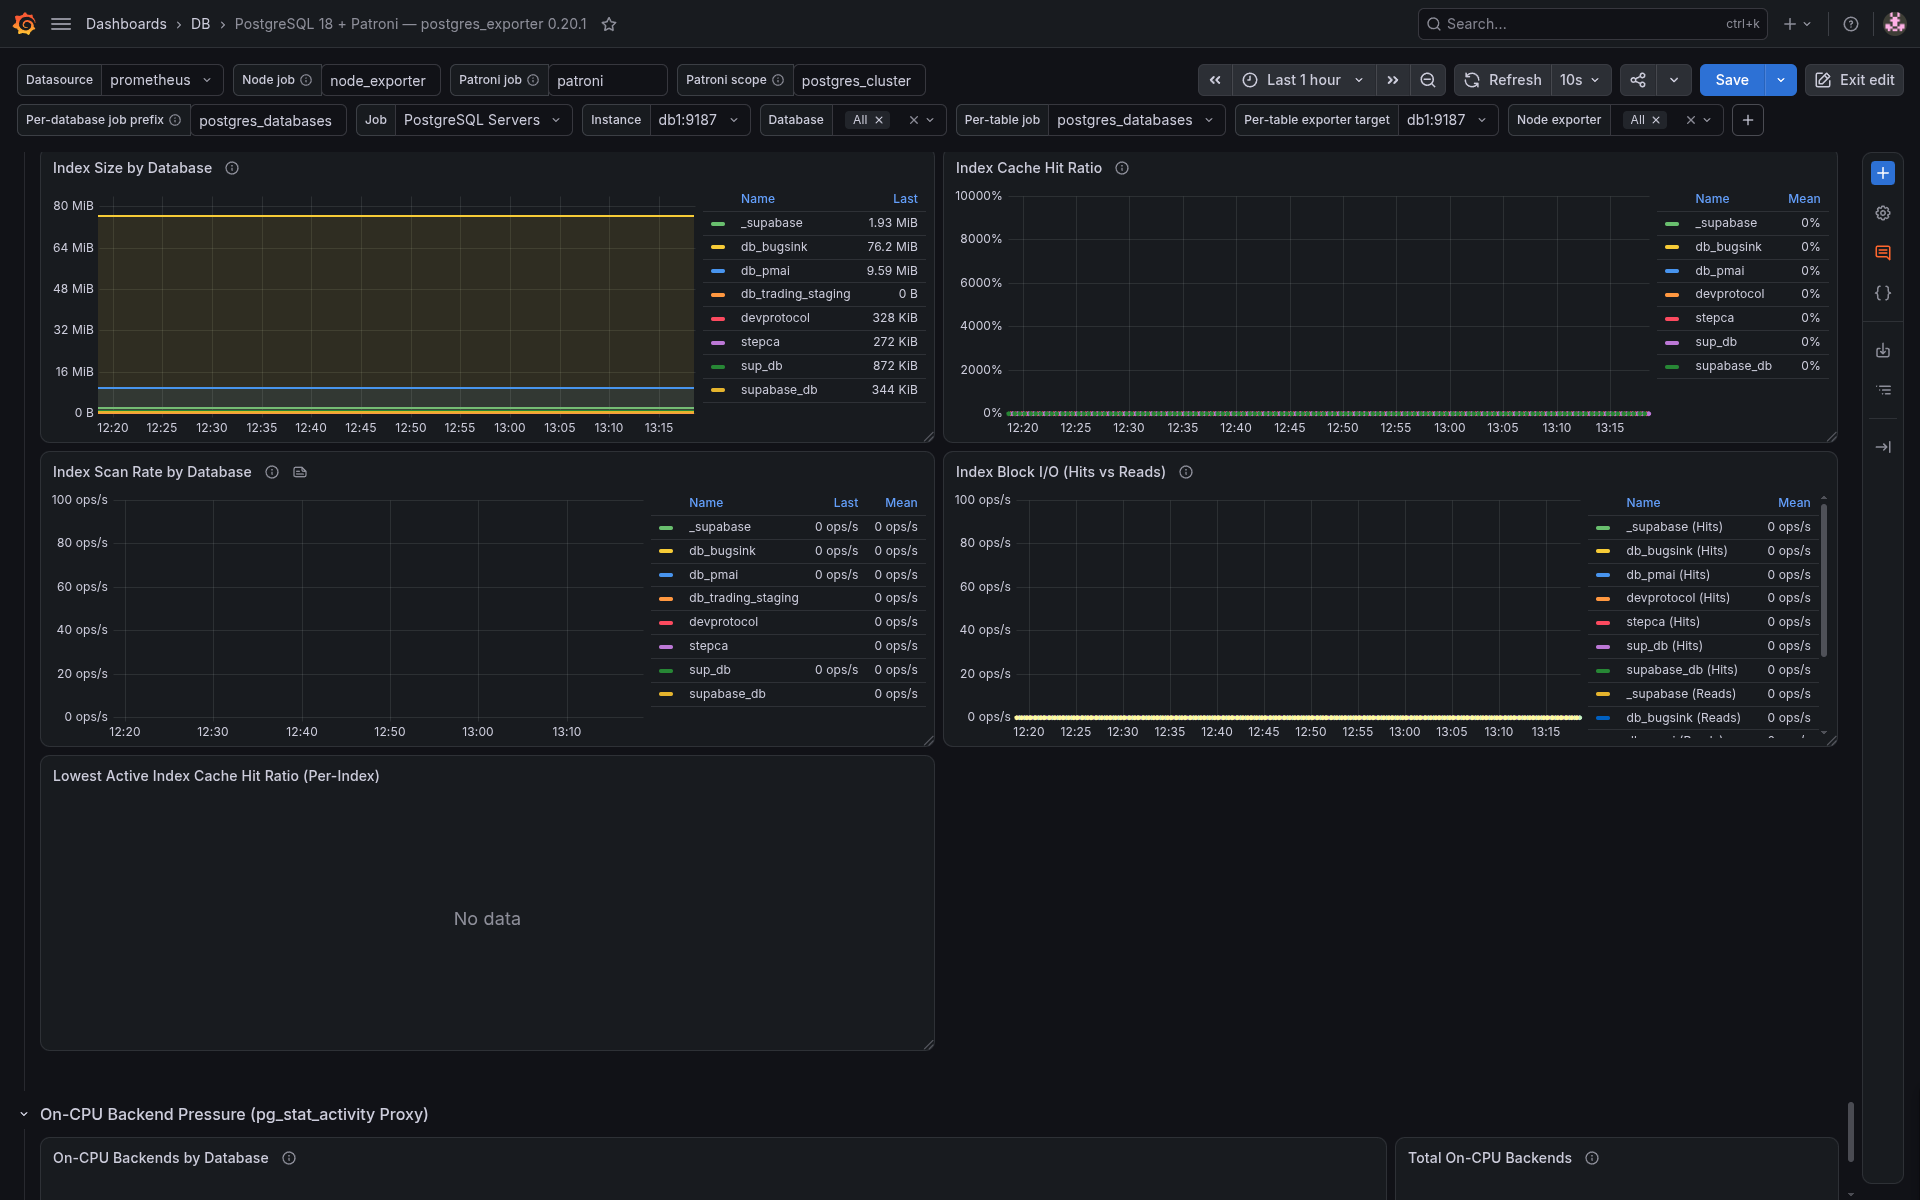
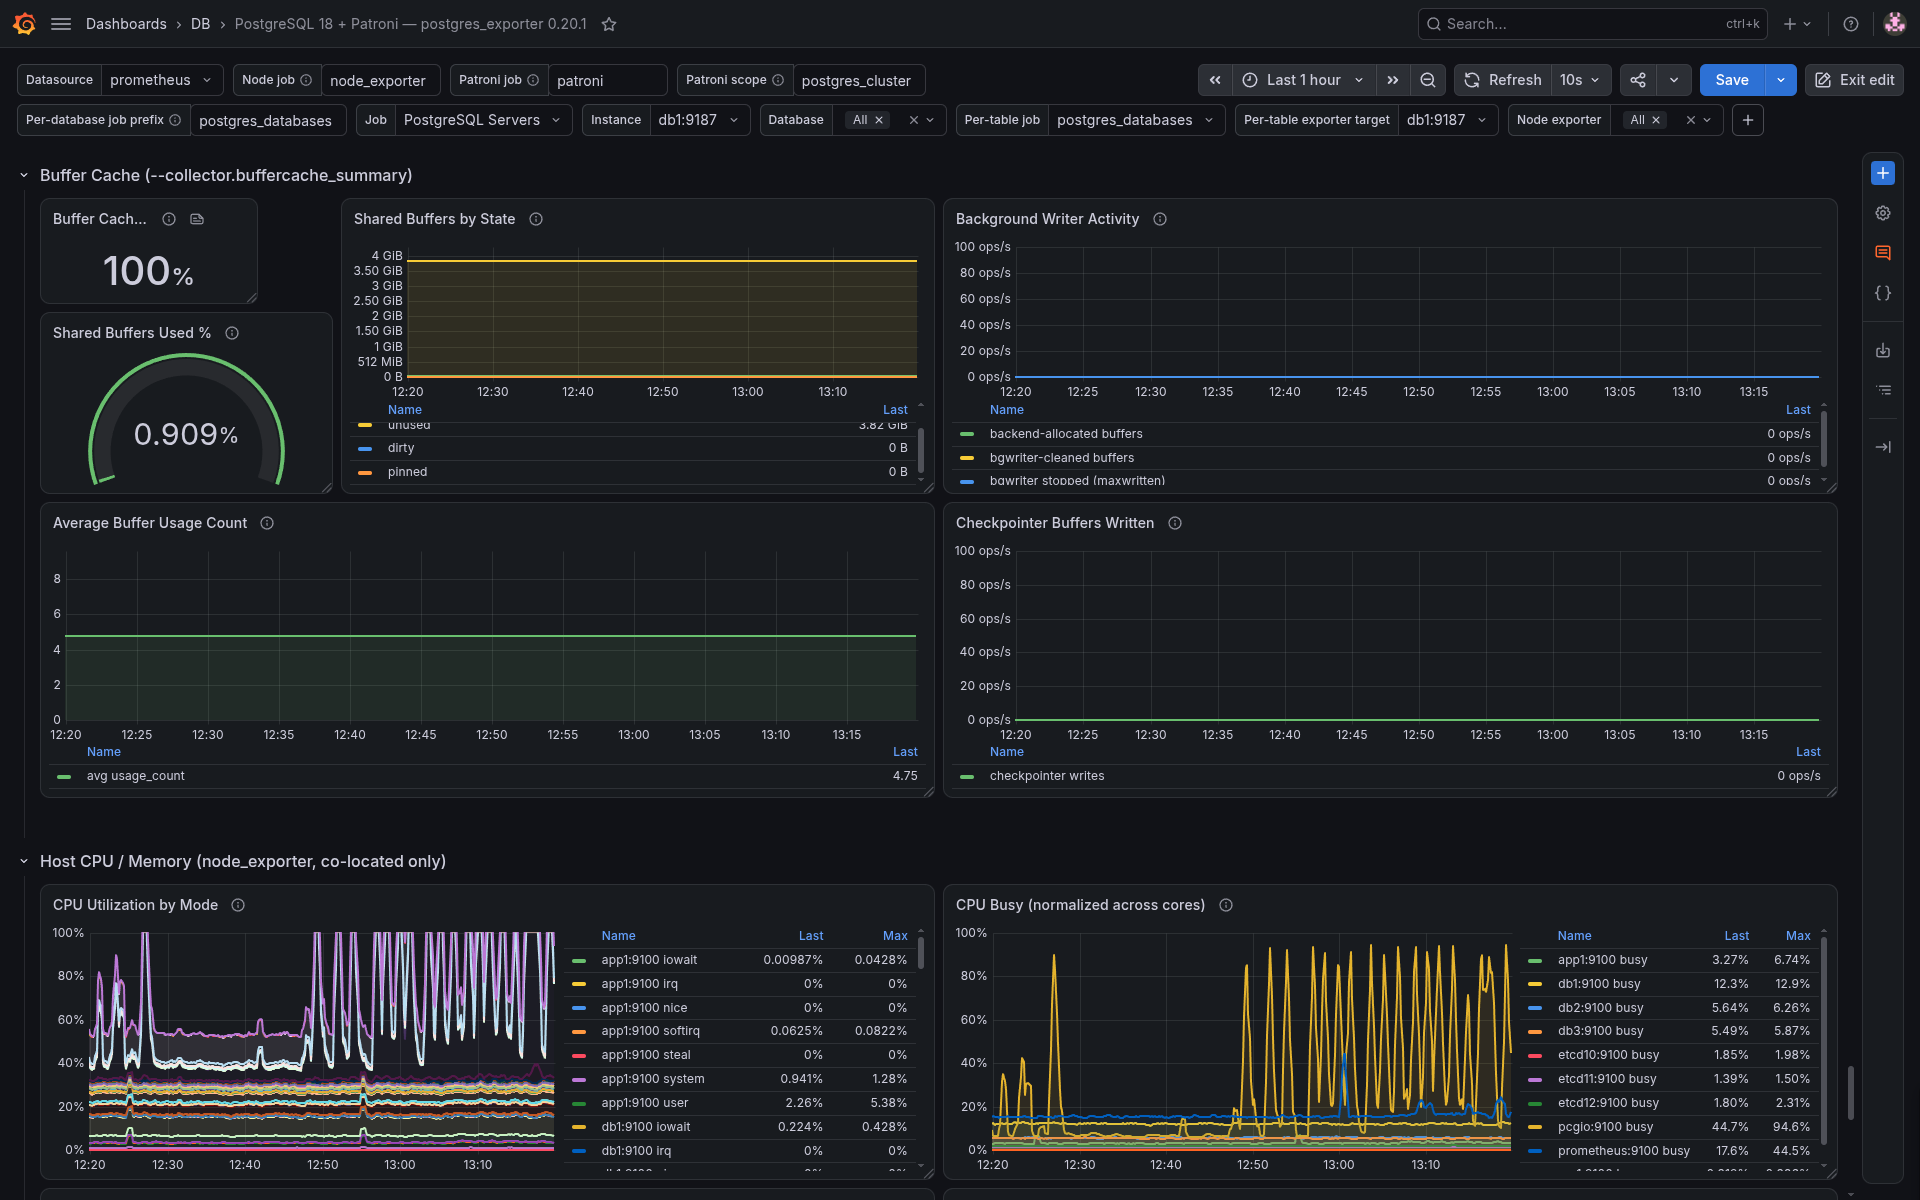
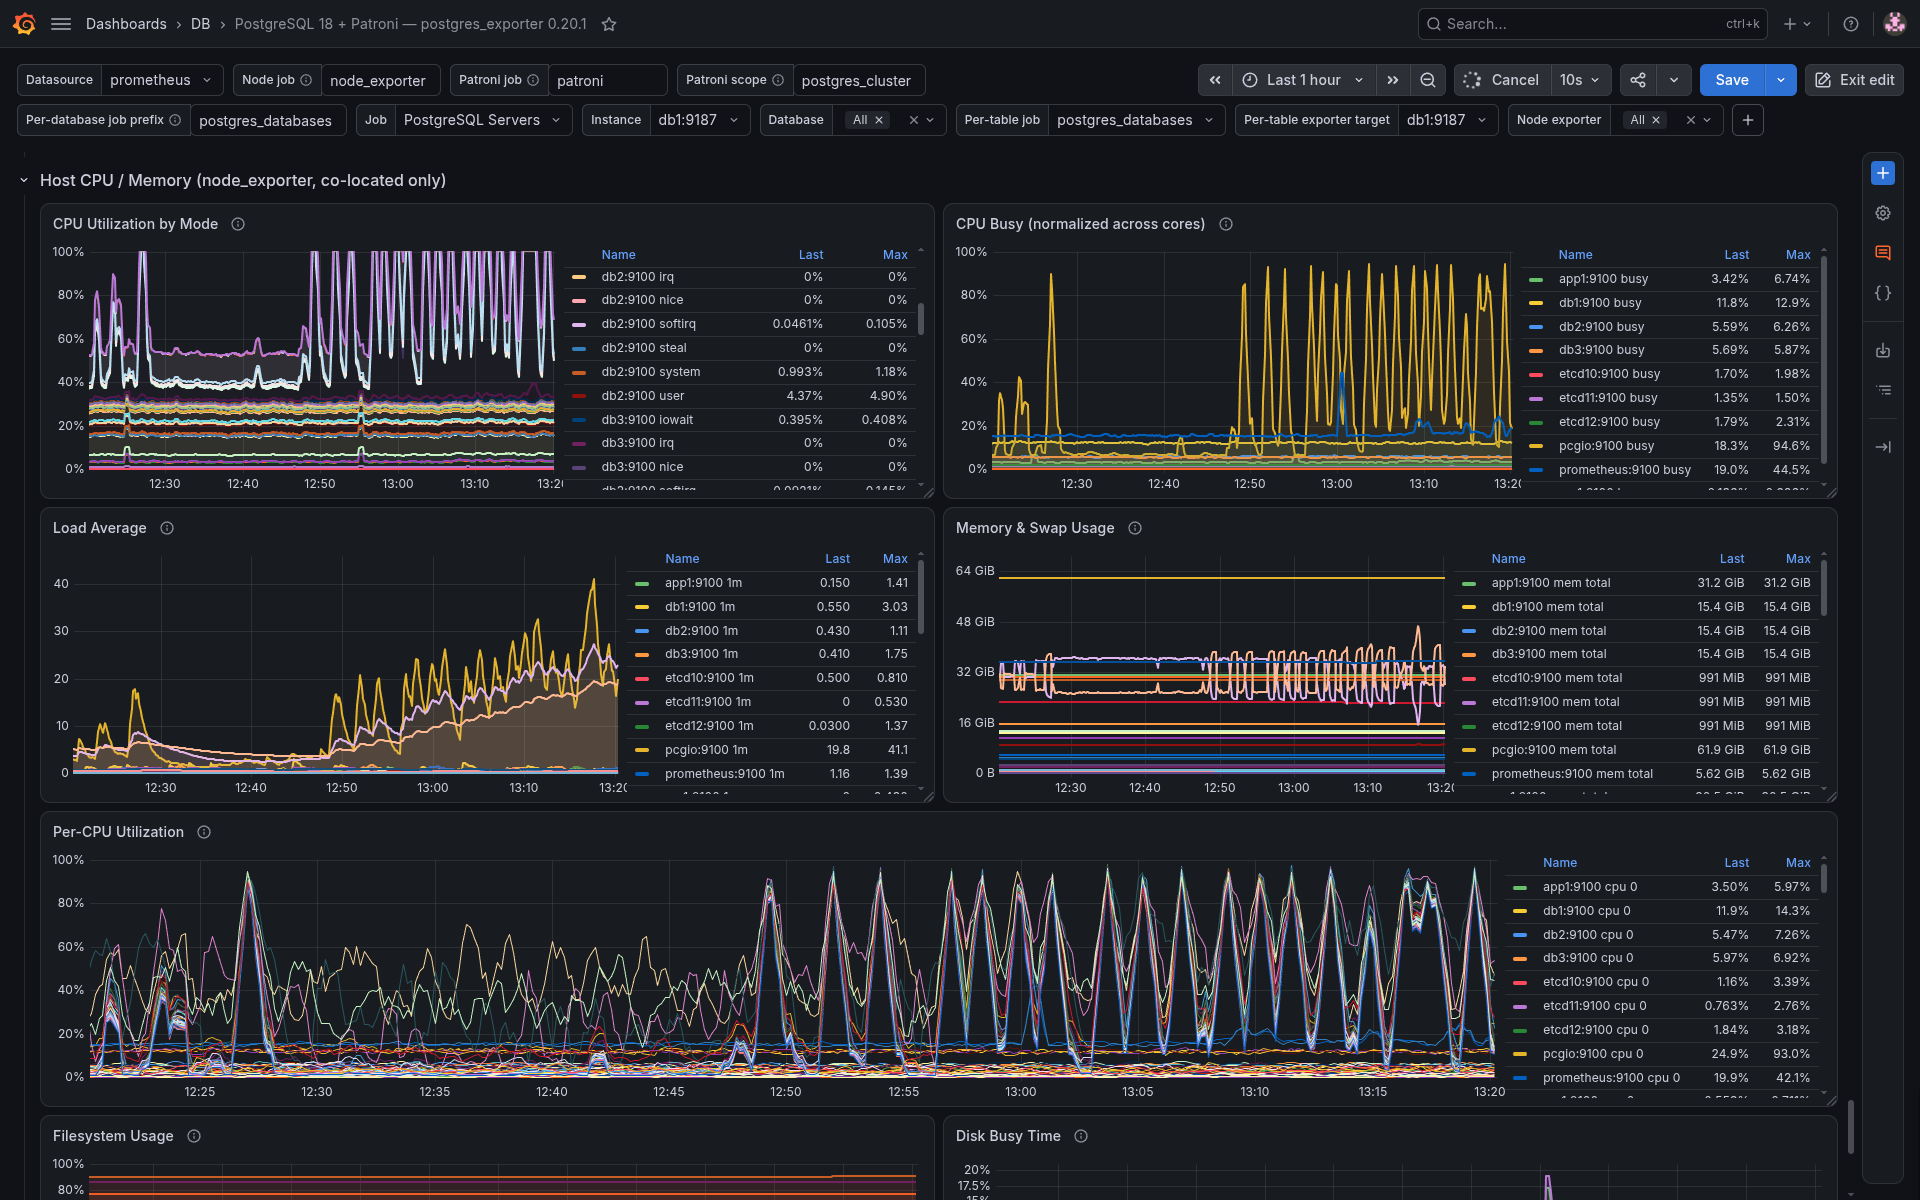
A 137-panel Grafana dashboard for a Patroni-managed PostgreSQL cluster scraped by prometheus-community/postgres_exporter v0.20.1, plus the field notes from getting there.
Most PostgreSQL dashboards are written against a metric list that someone assumed. This one was built the other way round: from pg_scrape_collector_success on a running exporter, which reports exactly the 26 collectors that exist, and from the /metrics output itself.
Requirements
| Component | Version | Notes |
|---|---|---|
| Grafana | 12.2+ | dashboard is in the dashboard.grafana.app/v2 schema, see below |
| Prometheus | 2.x / 3.x | any |
| postgres_exporter | 0.20.1 | one instance per node; 0.20.0 renamed replication_slot → replication_slots |
| PostgreSQL | 13+ | developed against 18.6 |
| Patroni | 2.1.0+ | for the Patroni Cluster row; the other 19 rows work without it |
| node_exporter | any | for the Host CPU / Memory row only |
What's in it
137 panels in 20 rows. The first six are expanded on load; the rest are collapsed, so the dashboard opens fast and you drill into what you need.
| Panels | Row |
|---|---|
| 7 | Patroni Cluster, members, leader, pending restart, cluster lock, paused, DCS failsafe, role over time |
| 15 | Instance Information & Settings |
| 5 | Critical Alerts, connection pool & performance |
| 6 | Connection Analysis & Idle Age |
| 6 | Checkpoints (including standby restartpoints) |
| 4 | WAL |
| 10 | Vacuum & Bloat Pressure |
| 2 | Vacuum Horizon Blockers |
| 4 | Query Performance |
| 3 | Recent Query Pressure, last 5m |
| 16 | Database Activity & I/O |
| 5 | Locks & Blocking |
| 6 | Replication |
| 13 | Table Statistics |
| 2 | Database Size & Growth |
| 5 | Index Performance & Unused Indexes |
| 2 | On-CPU Backend Pressure |
| 6 | Buffer Cache |
| 8 | Host CPU / Memory |
| 12 | Exporter Self-Monitoring |
Panels that are empty on a healthy cluster
Some panels are supposed to be empty, and this is deliberate, they are the ones you want to notice when they stop being empty:
- lock waits and blocked sessions,
- on-CPU backend counts,
- WAL receiver panels, which only populate on a standby,
- autovacuum-in-progress panels, when autovacuum is not currently running.
A panel that is empty because its metric does not exist is a bug. A panel that is empty because nothing is wrong is a feature. This dashboard has none of the first kind.
Prometheus
# Relevant excerpt of /etc/prometheus/prometheus.yml
# Three jobs: the exporters, Patroni's own endpoint, and the per-database /probe job.
global:
scrape_interval: 15s
scrape_timeout: 10s
scrape_configs:
1. postgres_exporter /metrics — one target per PostgreSQL node.
5s is safe here: /metrics for a single DSN completes in ~50-150 ms.
- job_name: 'PostgreSQL Servers'
scrape_interval: 5s
scrape_timeout: 4s
static_configs:
- targets:
- pg-node-1:9187
- pg-node-2:9187
- pg-node-3:9187
2. Patroni's built-in Prometheus endpoint (Patroni >= 2.1.0), port 8008.
This is where every patroni_* metric in the dashboard comes from —
postgres_exporter does not expose cluster role, leader or pending-restart state.
- job_name: 'patroni'
scrape_interval: 5s
scrape_timeout: 4s
metrics_path: /metrics
static_configs:
- targets:
- pg-node-1:8008
- pg-node-2:8008
- pg-node-3:8008
3. Per-database table/index statistics through the multi-target /probe endpoint.
Only three metric families are per-database; everything else /probe returns is a
duplicate of what job 1 already scraped, which is what metric_relabel_configs drops.
- job_name: postgres_databases
scrape_interval: 30s
scrape_timeout: 20s
metrics_path: /probe
params:
auth_module: [postgres]
static_configs:
- targets:
- 127.0.0.1:5432/appdb_1
- 127.0.0.1:5432/appdb_2
- 127.0.0.1:5432/appdb_3
relabel_configs:
- source_labels: [address]
target_label: __param_target
- source_labels: [__param_target]
target_label: database
- target_label: address
replacement: pg-node-1:9187
metric_relabel_configs:
- source_labels: [name]
regex: 'pg_stat_user_tables_.|pg_statio_user_tables_.|pg_statio_user_indexes_.*'
action: keep
node_exporter, for the Host CPU / Memory row.
- job_name: node_exporter
static_configs:
- targets:
- pg-node-1:9100
- pg-node-2:9100
- pg-node-3:9100
Credits
This dashboard began as a rebuild of PostgreSQL Monitoring Dashboard, grafana.com ID 24298 by nbari, which is built for a different exporter, nbari/pg_exporter (Rust, BSD-3-Clause).
Against prometheus-community/postgres_exporter 0.20.1, 136 of that dashboard's 180 metric names do not exist and 111 of its 158 panels draw nothing, not a defect in the original, just two exporters with different metric namespaces. The layout, the row structure and several panel ideas are nbari's; the queries are not. If you run nbari's exporter, use nbari's dashboard, it is the right one for that exporter, and it is better than this one at monitoring what that exporter measures.
License
Apache-2.0.
More
More at https://github.com/Axiumine/grafana-postgres-patroni
Data source config
Collector config:
Upload an updated version of an exported dashboard.json file from Grafana
| Revision | Description | Created | |
|---|---|---|---|
| Download |

PostgreSQL

Easily monitor your deployment of PostgreSQL, the open source relational database, with Grafana Cloud's out-of-the-box monitoring solution.
Learn more