
Kubernetes Namespaces & Pods
Namespace and pod level resource consumption, top talkers, and pending/failed pods.
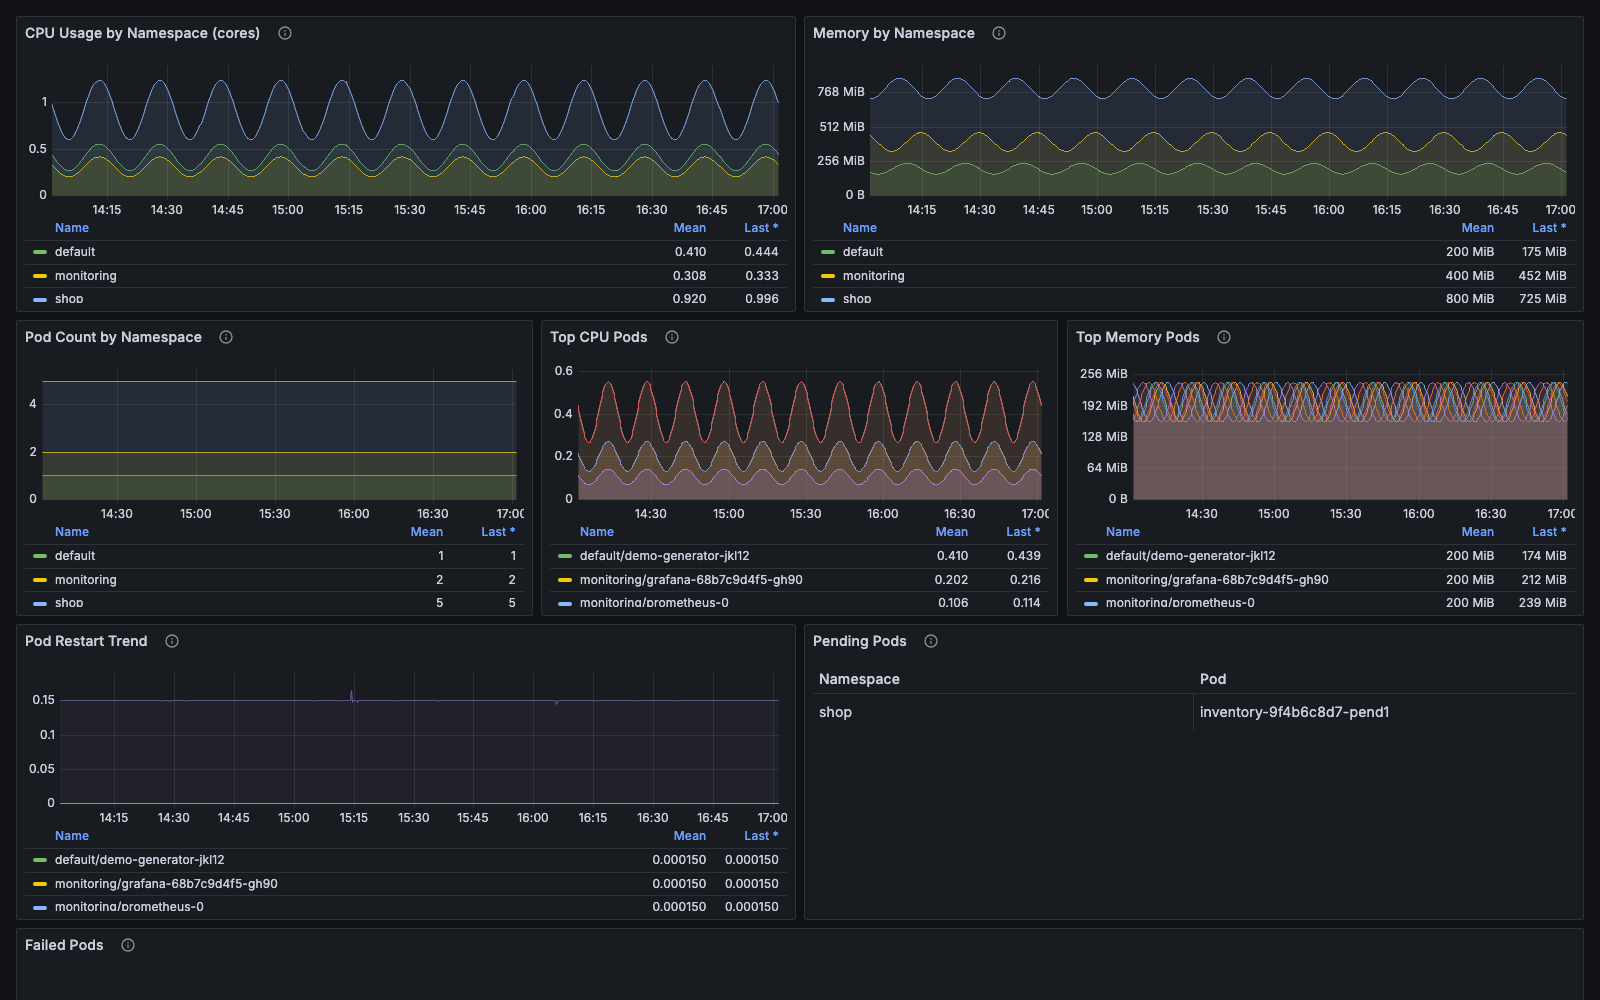
Namespace and pod level resource consumption for a Kubernetes cluster: who is using the CPU and memory, which pods keep restarting, and what is stuck.
Requirements
- Prometheus scraping cAdvisor (kubelet) and kube-state-metrics
- Grafana 10.0 or later
What it shows
CPU usage and memory by namespace, pod count by namespace, top CPU and top memory pods, a pod restart trend, and tables of Pending and Failed pods. Namespace and pod template variables let you narrow to one workload.
Setup
Import the dashboard and select your Prometheus data source. The namespace and pod dropdowns populate from kube_pod_info, so they fill in from your own cluster with no editing.
Metrics used: container_cpu_usage_seconds_total, container_memory_working_set_bytes, kube_pod_info, kube_pod_status_phase and kube_pod_container_status_restarts_total.
MIT-licensed source, plus a Docker Compose demo stack that generates sample data: https://github.com/Fractal-Techware/grafana-dashboards
Data source config
Collector config:
Upload an updated version of an exported dashboard.json file from Grafana
| Revision | Description | Created | |
|---|---|---|---|
| Download |

Kubernetes

Monitor your Kubernetes deployment with prebuilt visualizations that allow you to drill down from a high-level cluster overview to pod-specific details in minutes.
Learn more