
Infrastructure Overview
Essential host health: CPU, memory, filesystem, network, load, and uptime for one or more Linux hosts (node_exporter).
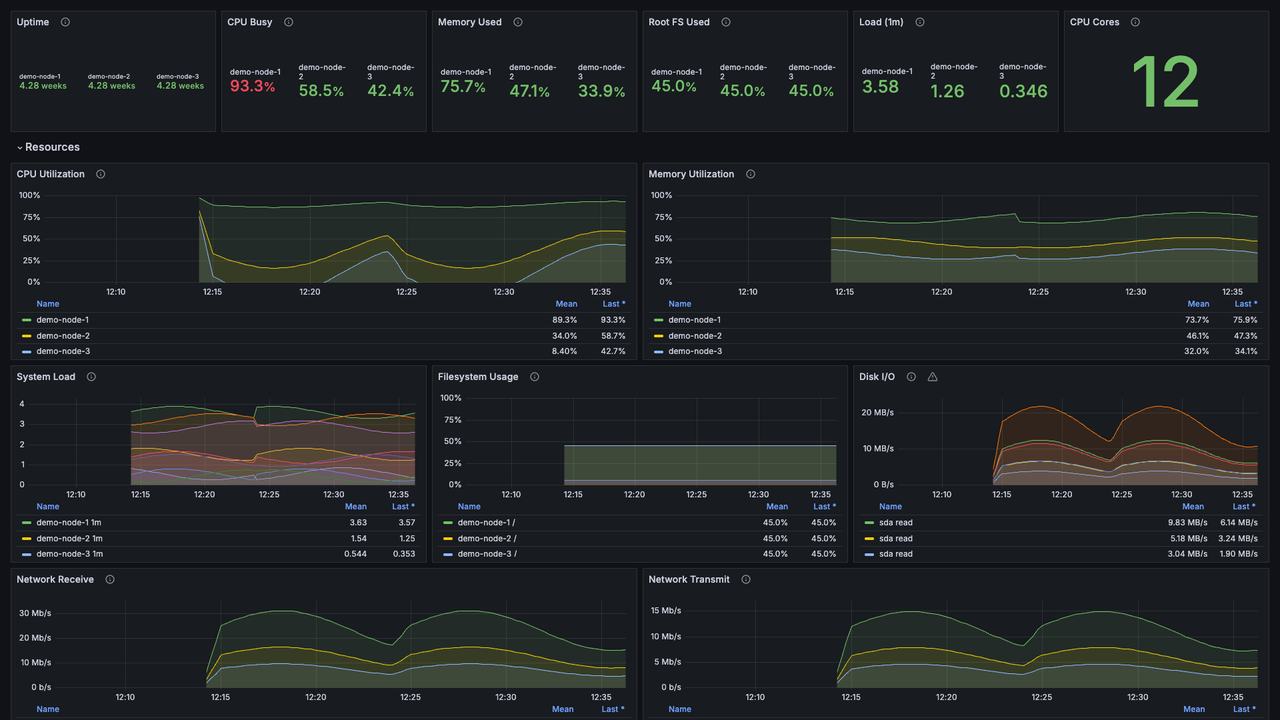
Essential host health in one view: CPU, memory, filesystem, network, load and uptime for one or more Linux hosts.
Requirements
- Prometheus scraping node_exporter 1.8 or later
- Grafana 10.0 or later
What it shows
Uptime and boot time, CPU utilisation, memory available vs total, filesystem usage, load average (1/5/15), network throughput, and disk read/write throughput. The Instance variable is driven by node_uname_info, so it populates itself from whatever hosts you scrape.
Setup
Import the dashboard, select your Prometheus data source, then pick a host from the Instance dropdown. No other configuration needed.
Every node_* metric name in this dashboard was checked against a running node_exporter 1.8.1, so panels should not come up empty.
MIT-licensed source, plus a Docker Compose demo stack that generates sample data: https://github.com/Fractal-Techware/grafana-dashboards
Data source config
Collector config:
Upload an updated version of an exported dashboard.json file from Grafana
| Revision | Description | Created | |
|---|---|---|---|
| Download |

Splunk Infrastructure Monitoring

With the Grafana plugin for Splunk Infrastructure Monitoring, you can quickly visualize your metrics and analytics in Grafana.
Learn more