
Alert History for kube-prometheus-stack
This dashboard is built for the kube-prometheus-stack Helm chart. Metrics are scraped by Prometheus (via the Prometheus Operator) from kube-state-metrics and node-exporter, both installed by default with the chart. No custom scrape configuration is needed — just install kube-prometheus-stack with default values and point this dashboard at the resulting Prometheus data source.
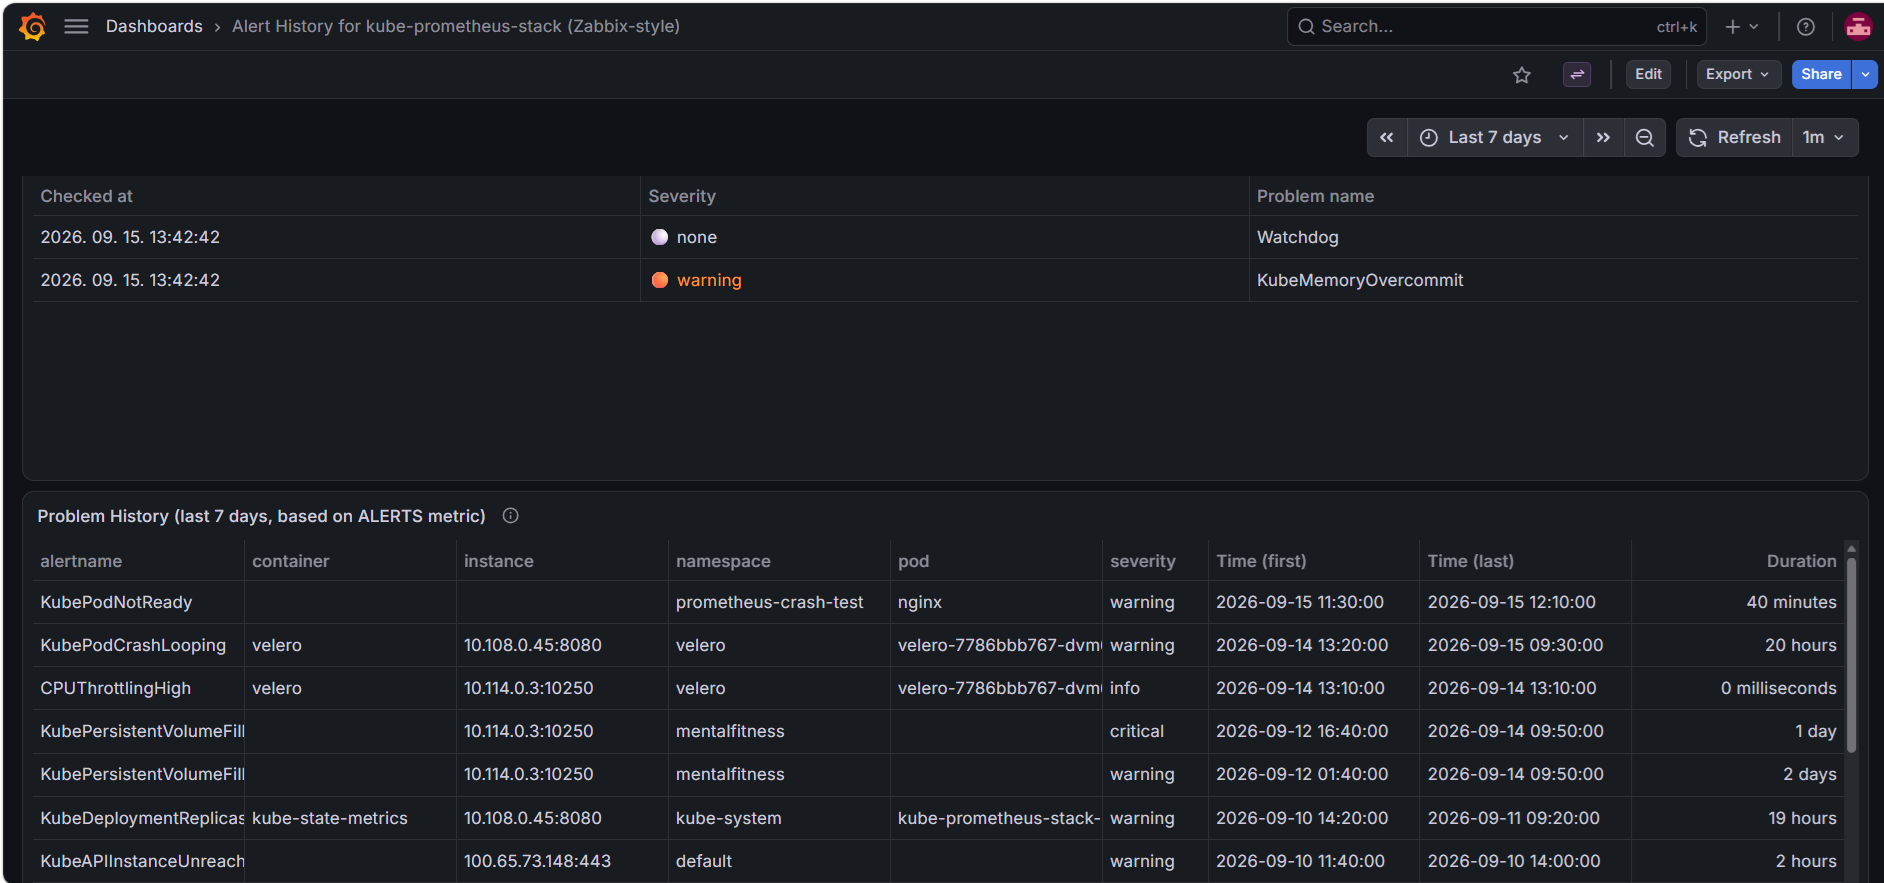
Alert History for kube-prometheus-stack (Zabbix-style)
An "alert history" table for Grafana, built entirely on core
Grafana features and the native Prometheus ALERTS metric — no custom
plugin required.
Designed for kube-prometheus-stack (Prometheus Operator + Alertmanager)
Grafana's built-in "Alerting - History" page is empty and not useful there, this very dashboard arrives to the rescue!
What it shows
Currently Active Problems (live snapshot)
An instant query on ALERTS{alertstate="firing"}, refreshed on the
dashboard's own refresh interval (default: every minute). Columns: checked-at
timestamp, severity (color-coded), problem name, namespace, pod, container,
instance.
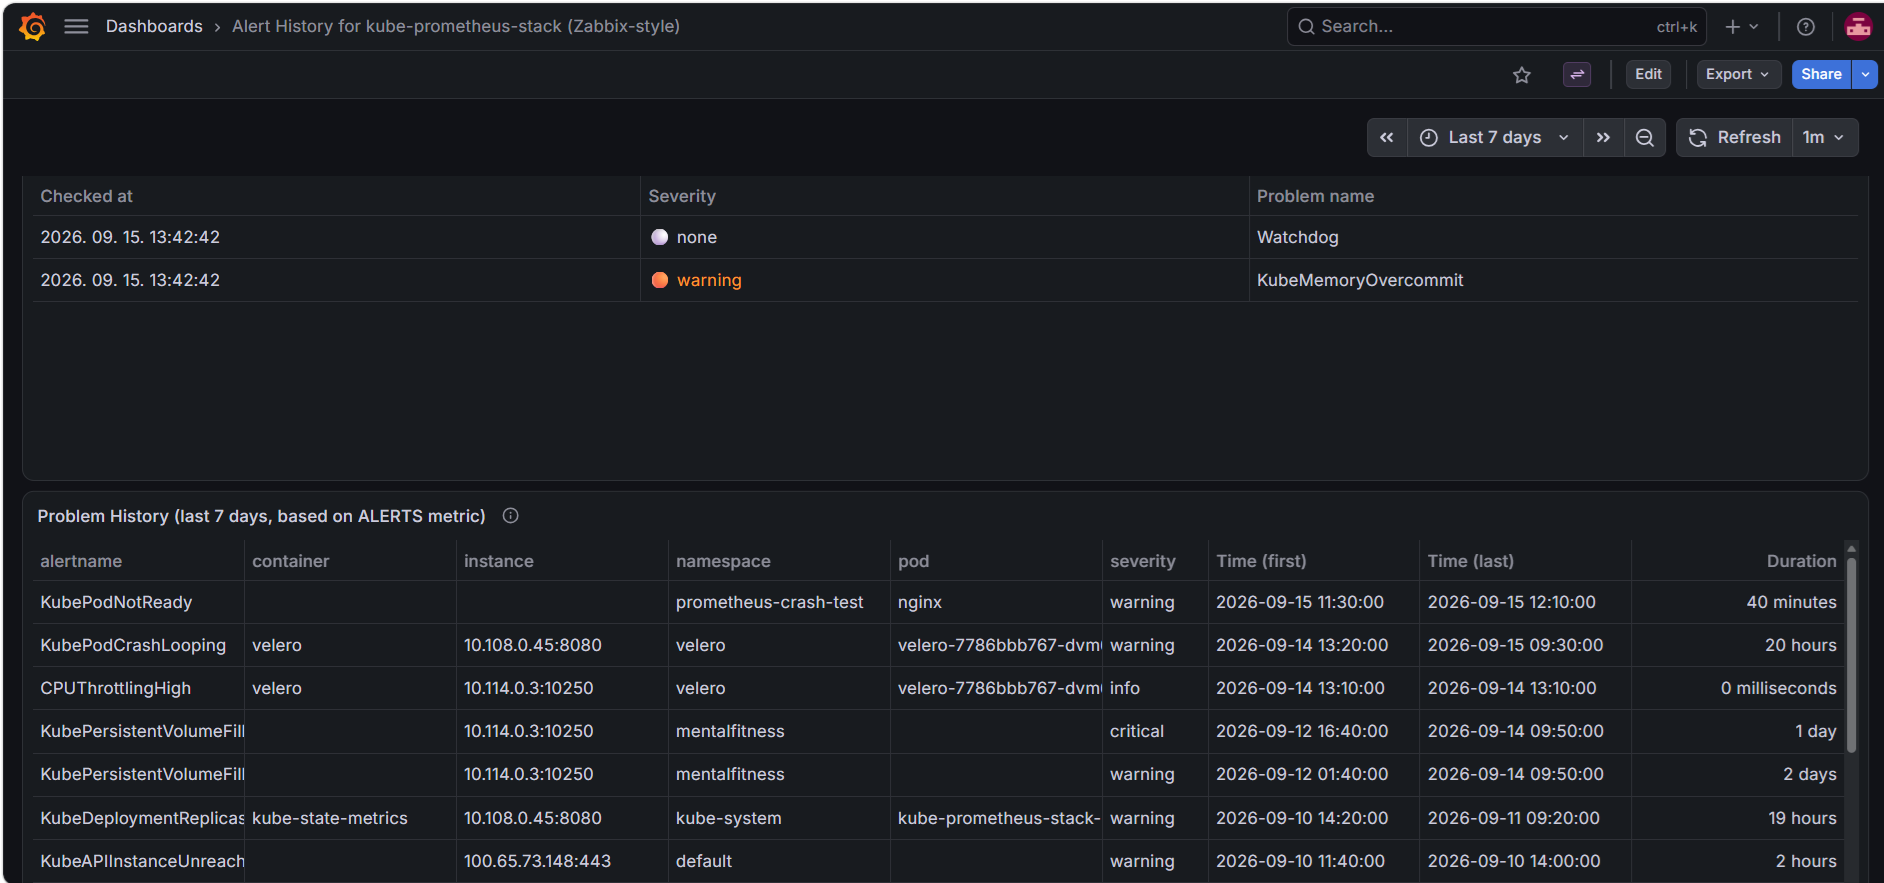
Problem History (last 7 days, based on ALERTS metric) A range query on the same metric, grouped into one row per firing episode (started / last seen / duration), using only core Grafana transformations: Labels to fields → Group by → Add field from calculation → Sort by. Columns: started, problem name, container, instance, namespace, pod, severity (color-coded), last seen (relative time), duration.
"Pending" alerts (rules that matched but haven't crossed their for:
duration yet) are intentionally excluded — only alerts that actually reached
firing state are shown.
Requirements
- A Prometheus data source — the same Prometheus instance kube-prometheus-stack
deploys (or any Prometheus/Thanos/Mimir endpoint that exposes the
ALERTSmetric). - No exporter, no extra
scrape_config, no additional recording rules. - History depth is limited by your Prometheus TSDB retention (commonly 1–2 weeks on default kube-prometheus-stack installs) — this is a Prometheus-side query, not a separate long-term alert log.
Known limitations
- Only reflects alerts Prometheus itself has evaluated and fired — alerts
silenced or inhibited in Alertmanager still show here as "firing" from
Prometheus's point of view, since Alertmanager-side suppression happens
downstream of the
ALERTSmetric. - "Currently active" and "history" are two independent queries (instant vs. range) against the same metric; they are not linked/drill-down panels.
Contributing
Issues and pull requests are welcome — e.g. additional columns, alternate groupings, or adapting the transforms for other alerting label schemes.
License
Data source config
Collector config:
Upload an updated version of an exported dashboard.json file from Grafana
| Revision | Description | Created | |
|---|---|---|---|
| Download |

Metrics Endpoint (Prometheus)

Easily monitor any Prometheus-compatible and publicly accessible metrics URL with Grafana Cloud's out-of-the-box monitoring solution.
Learn more