
OpenSearch Cluster (elasticsearch_exporter)
Cluster, index and node health for OpenSearch 2.x/3.x and Elasticsearch, scraped by prometheus-community/elasticsearch_exporter. Needs only the default collectors plus --es.indices.
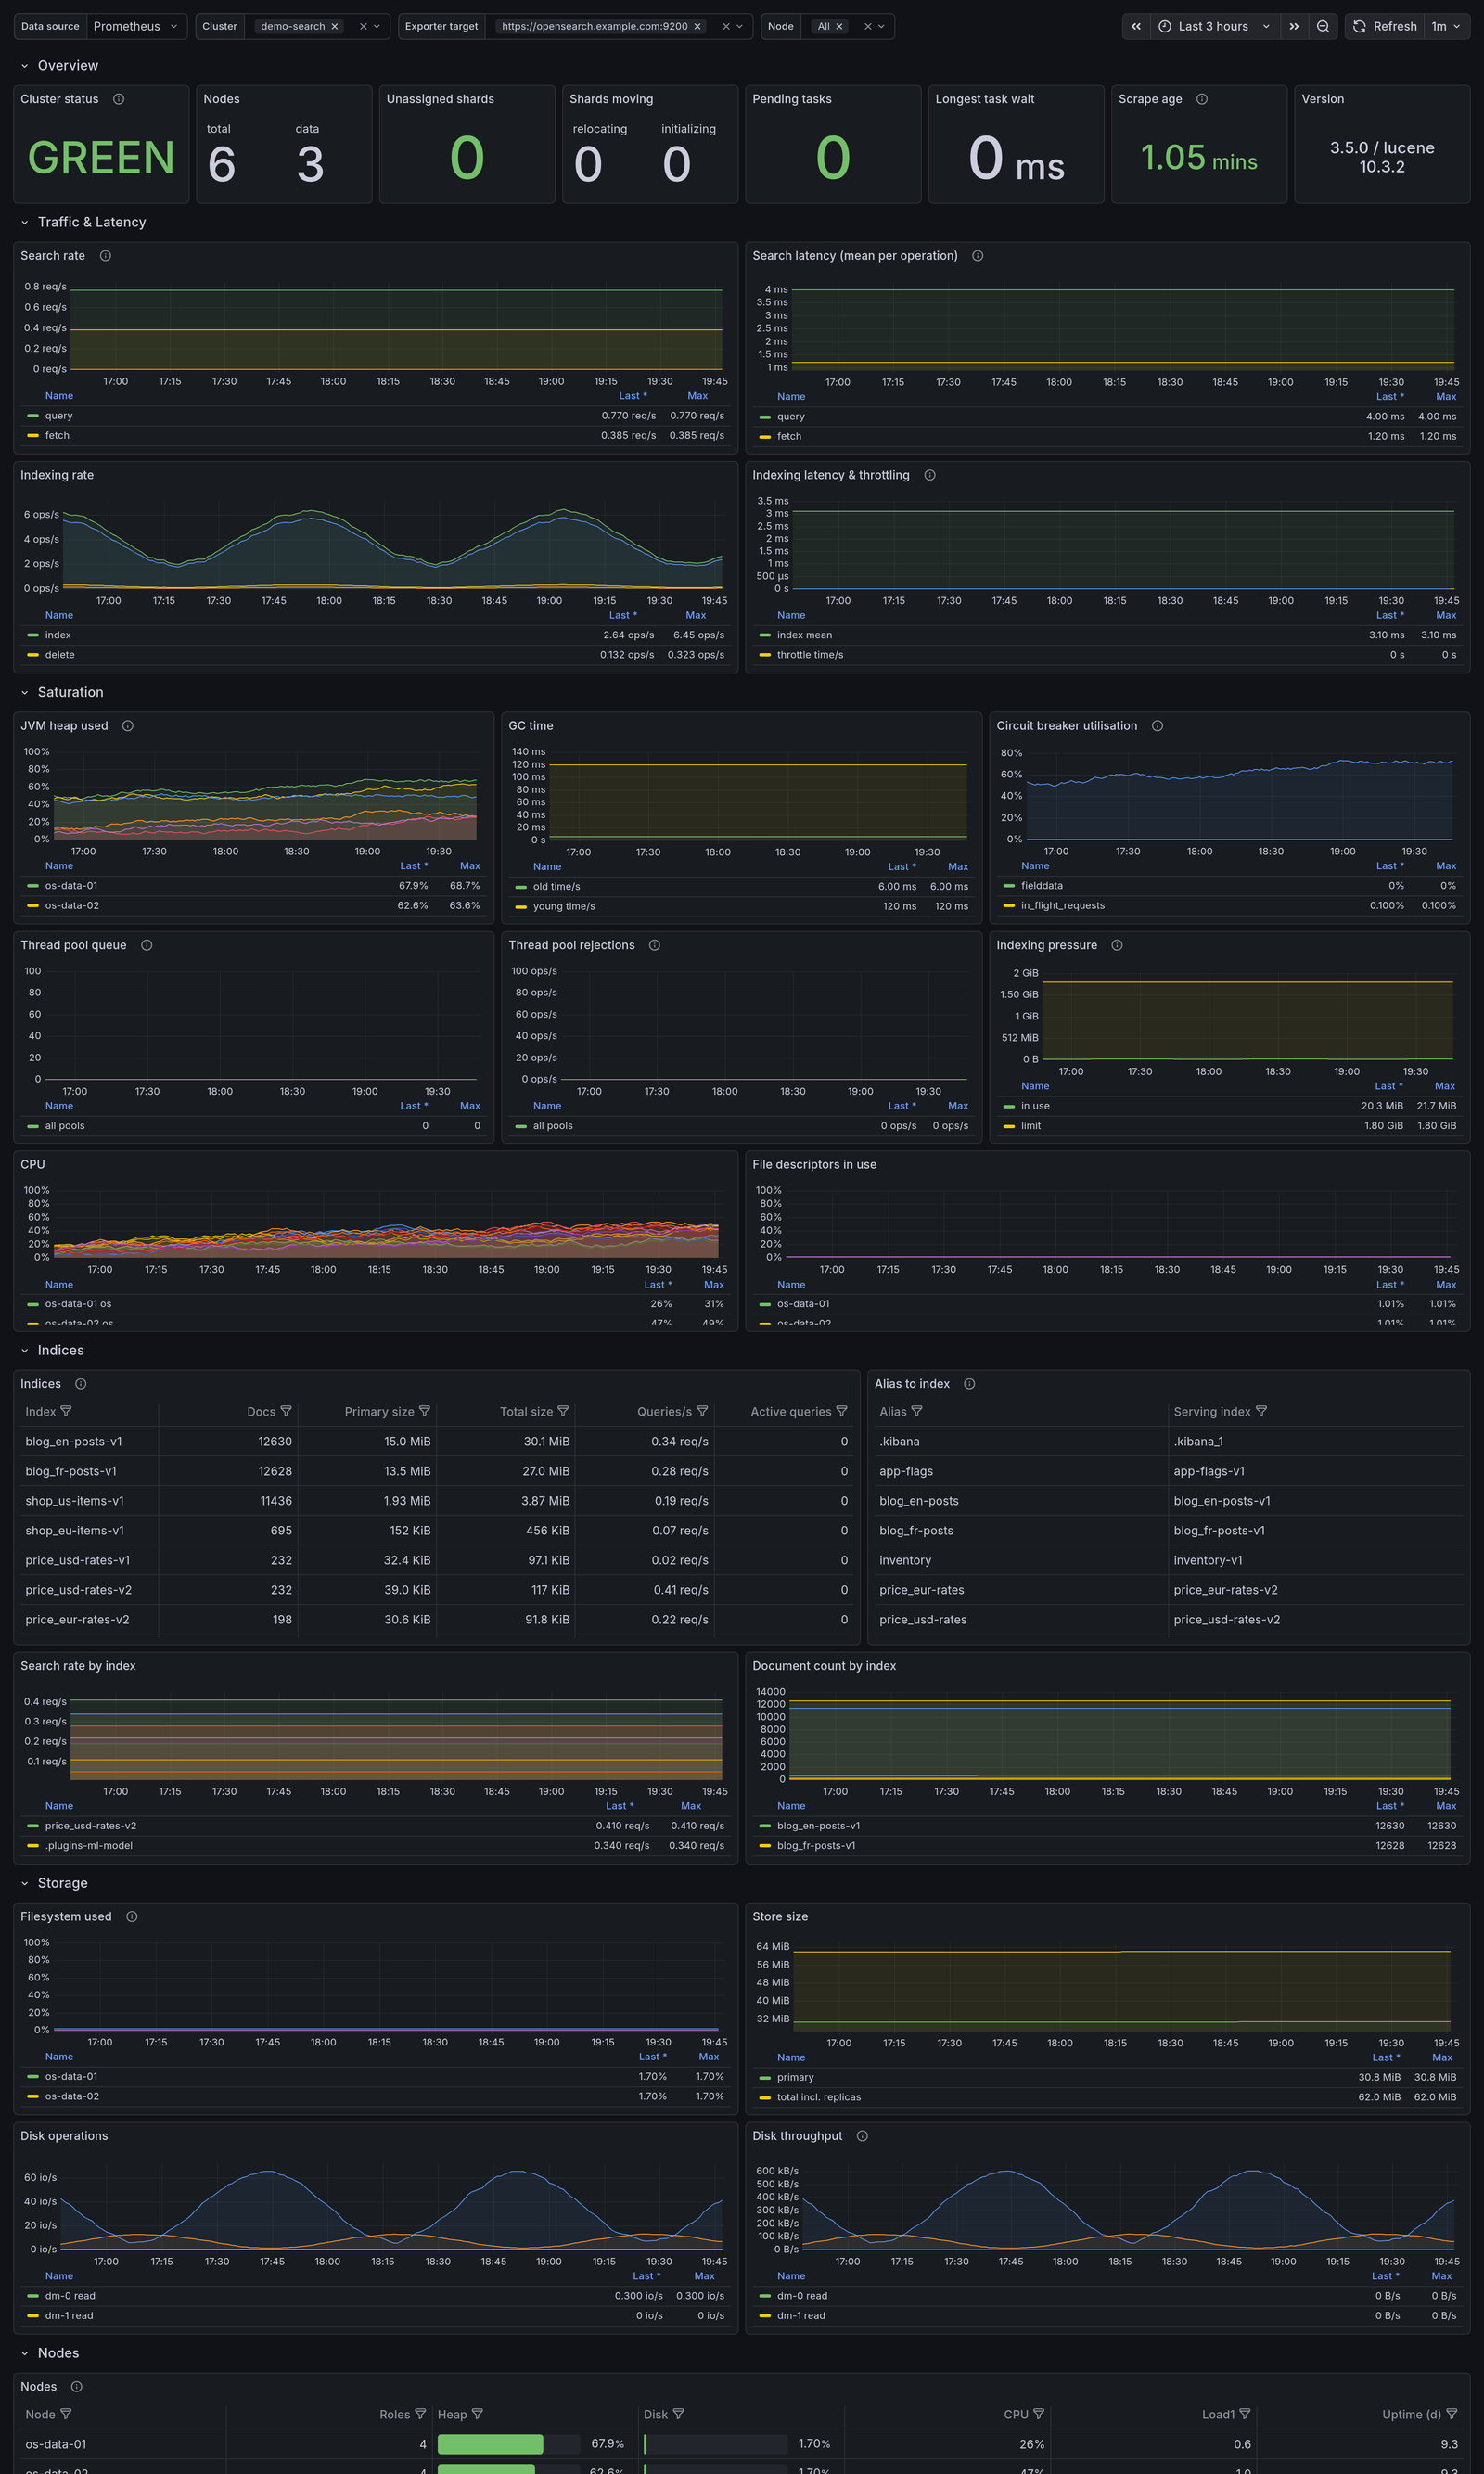
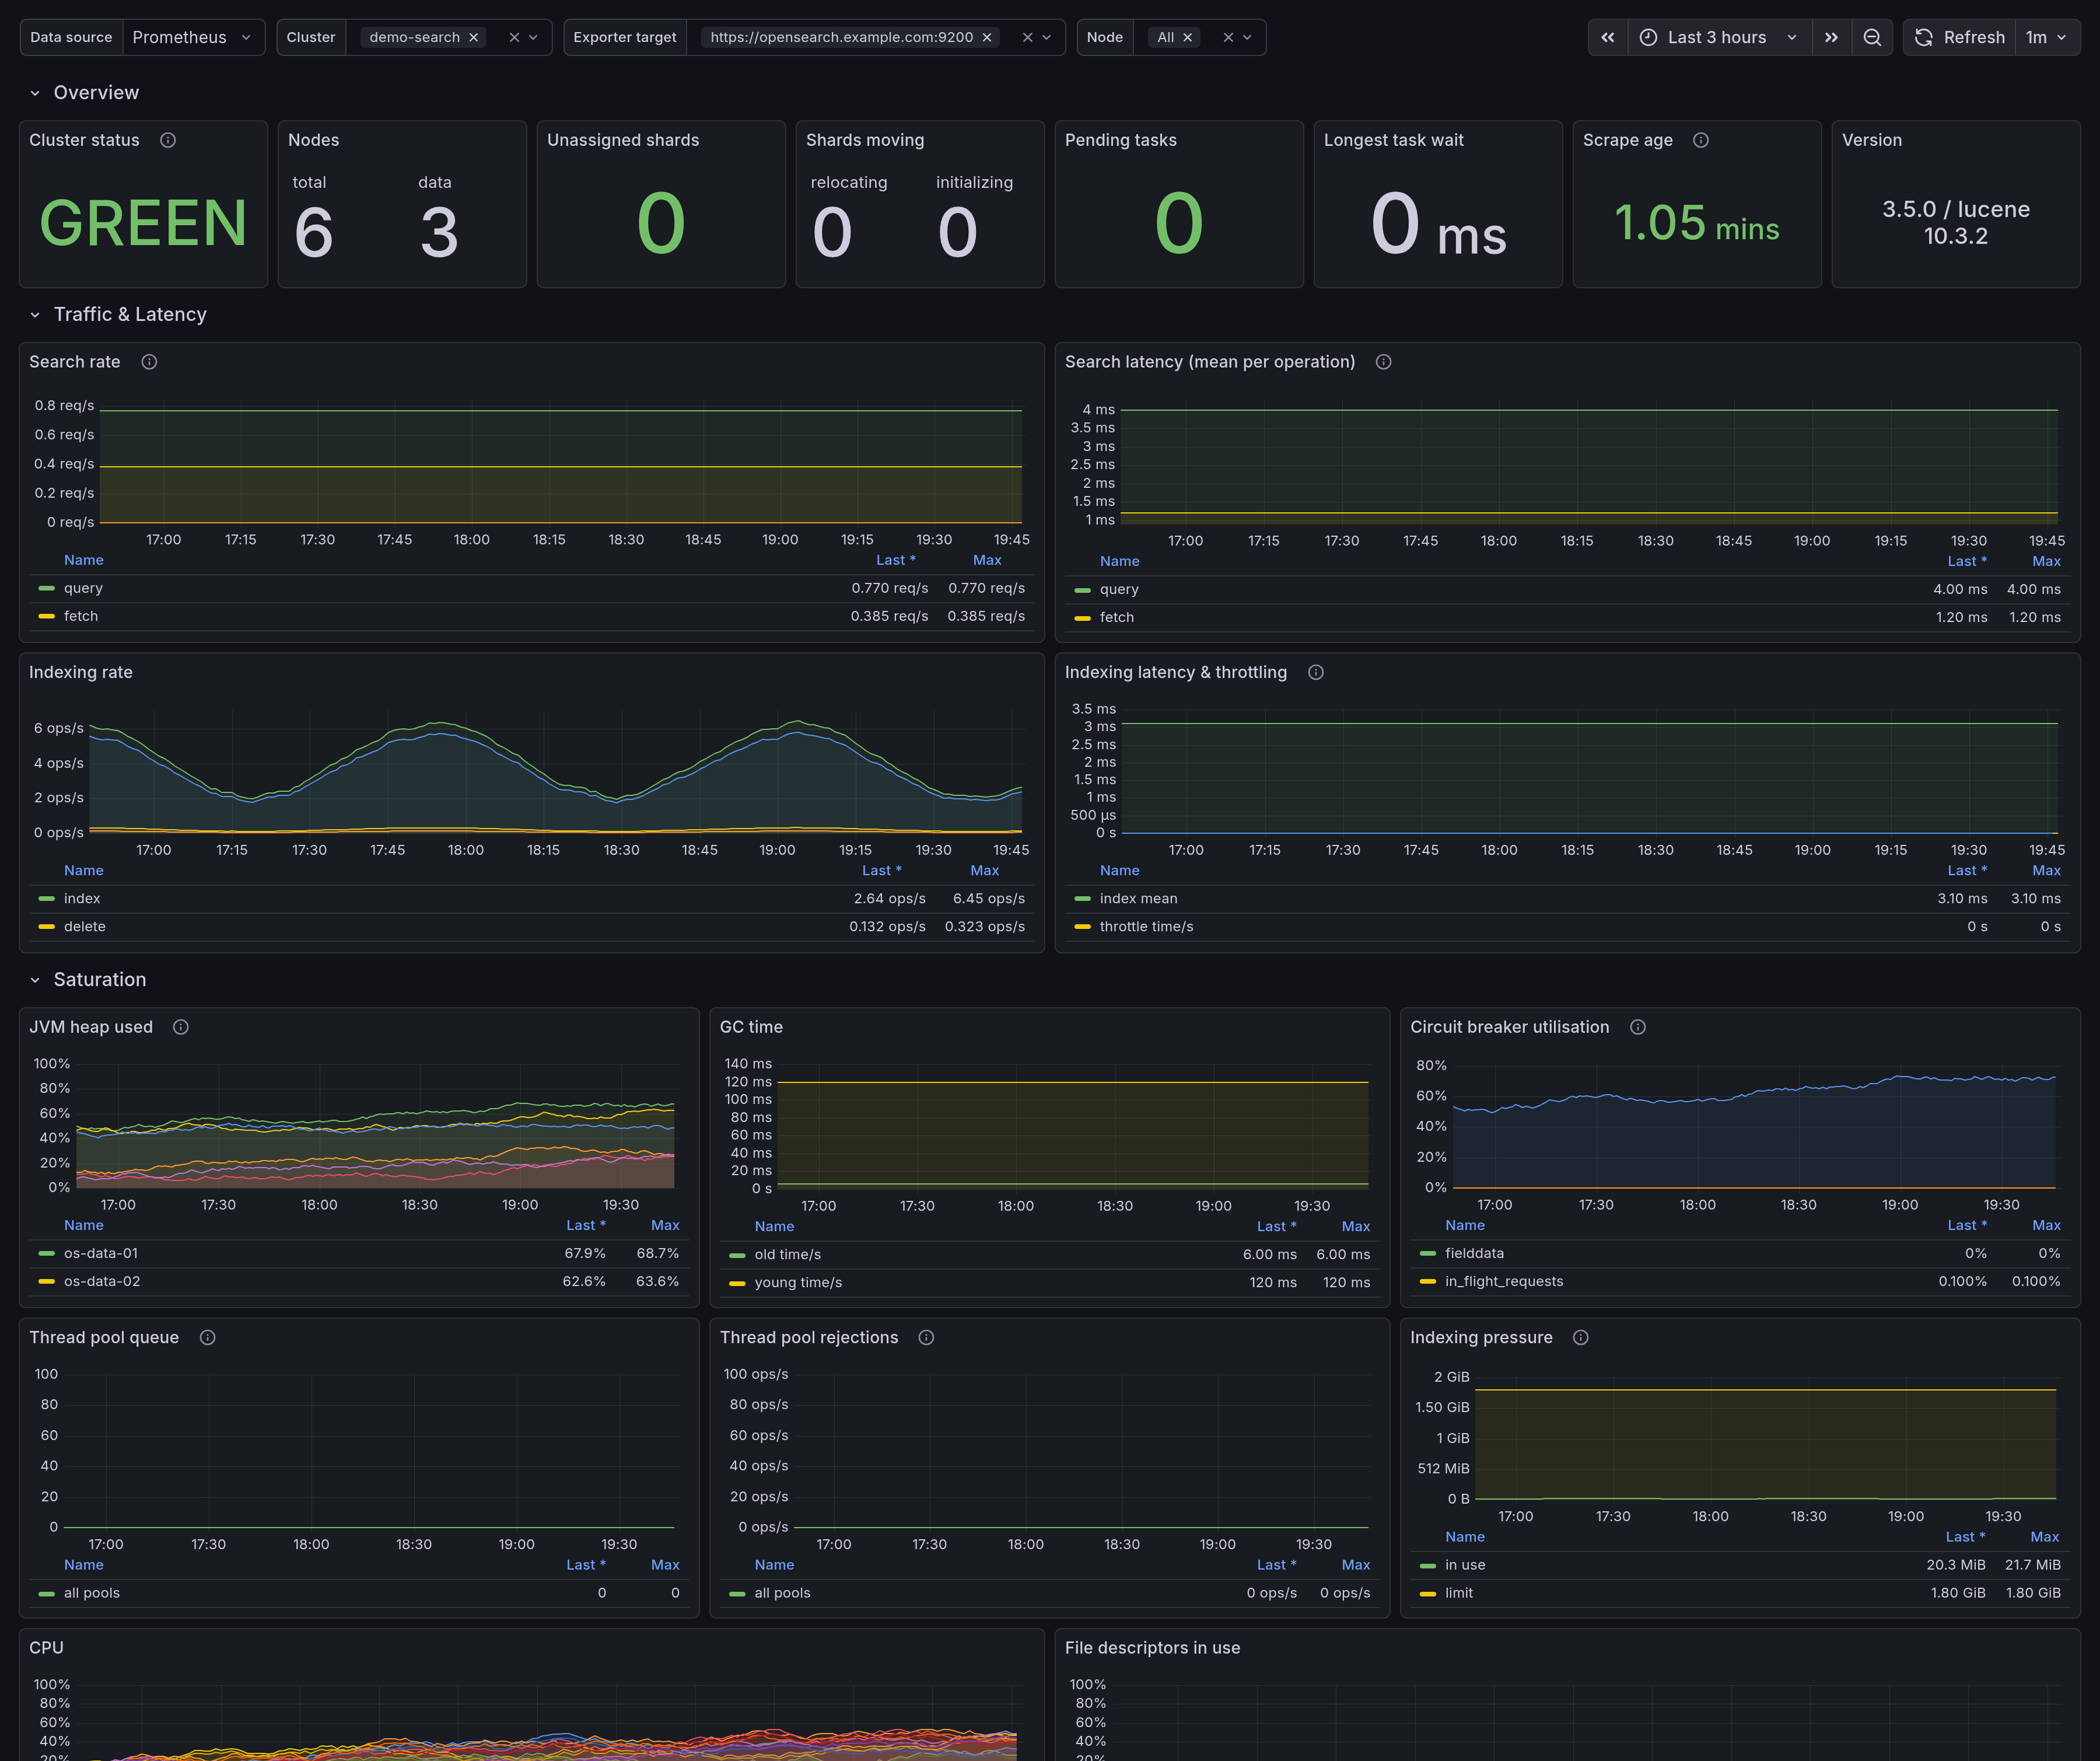
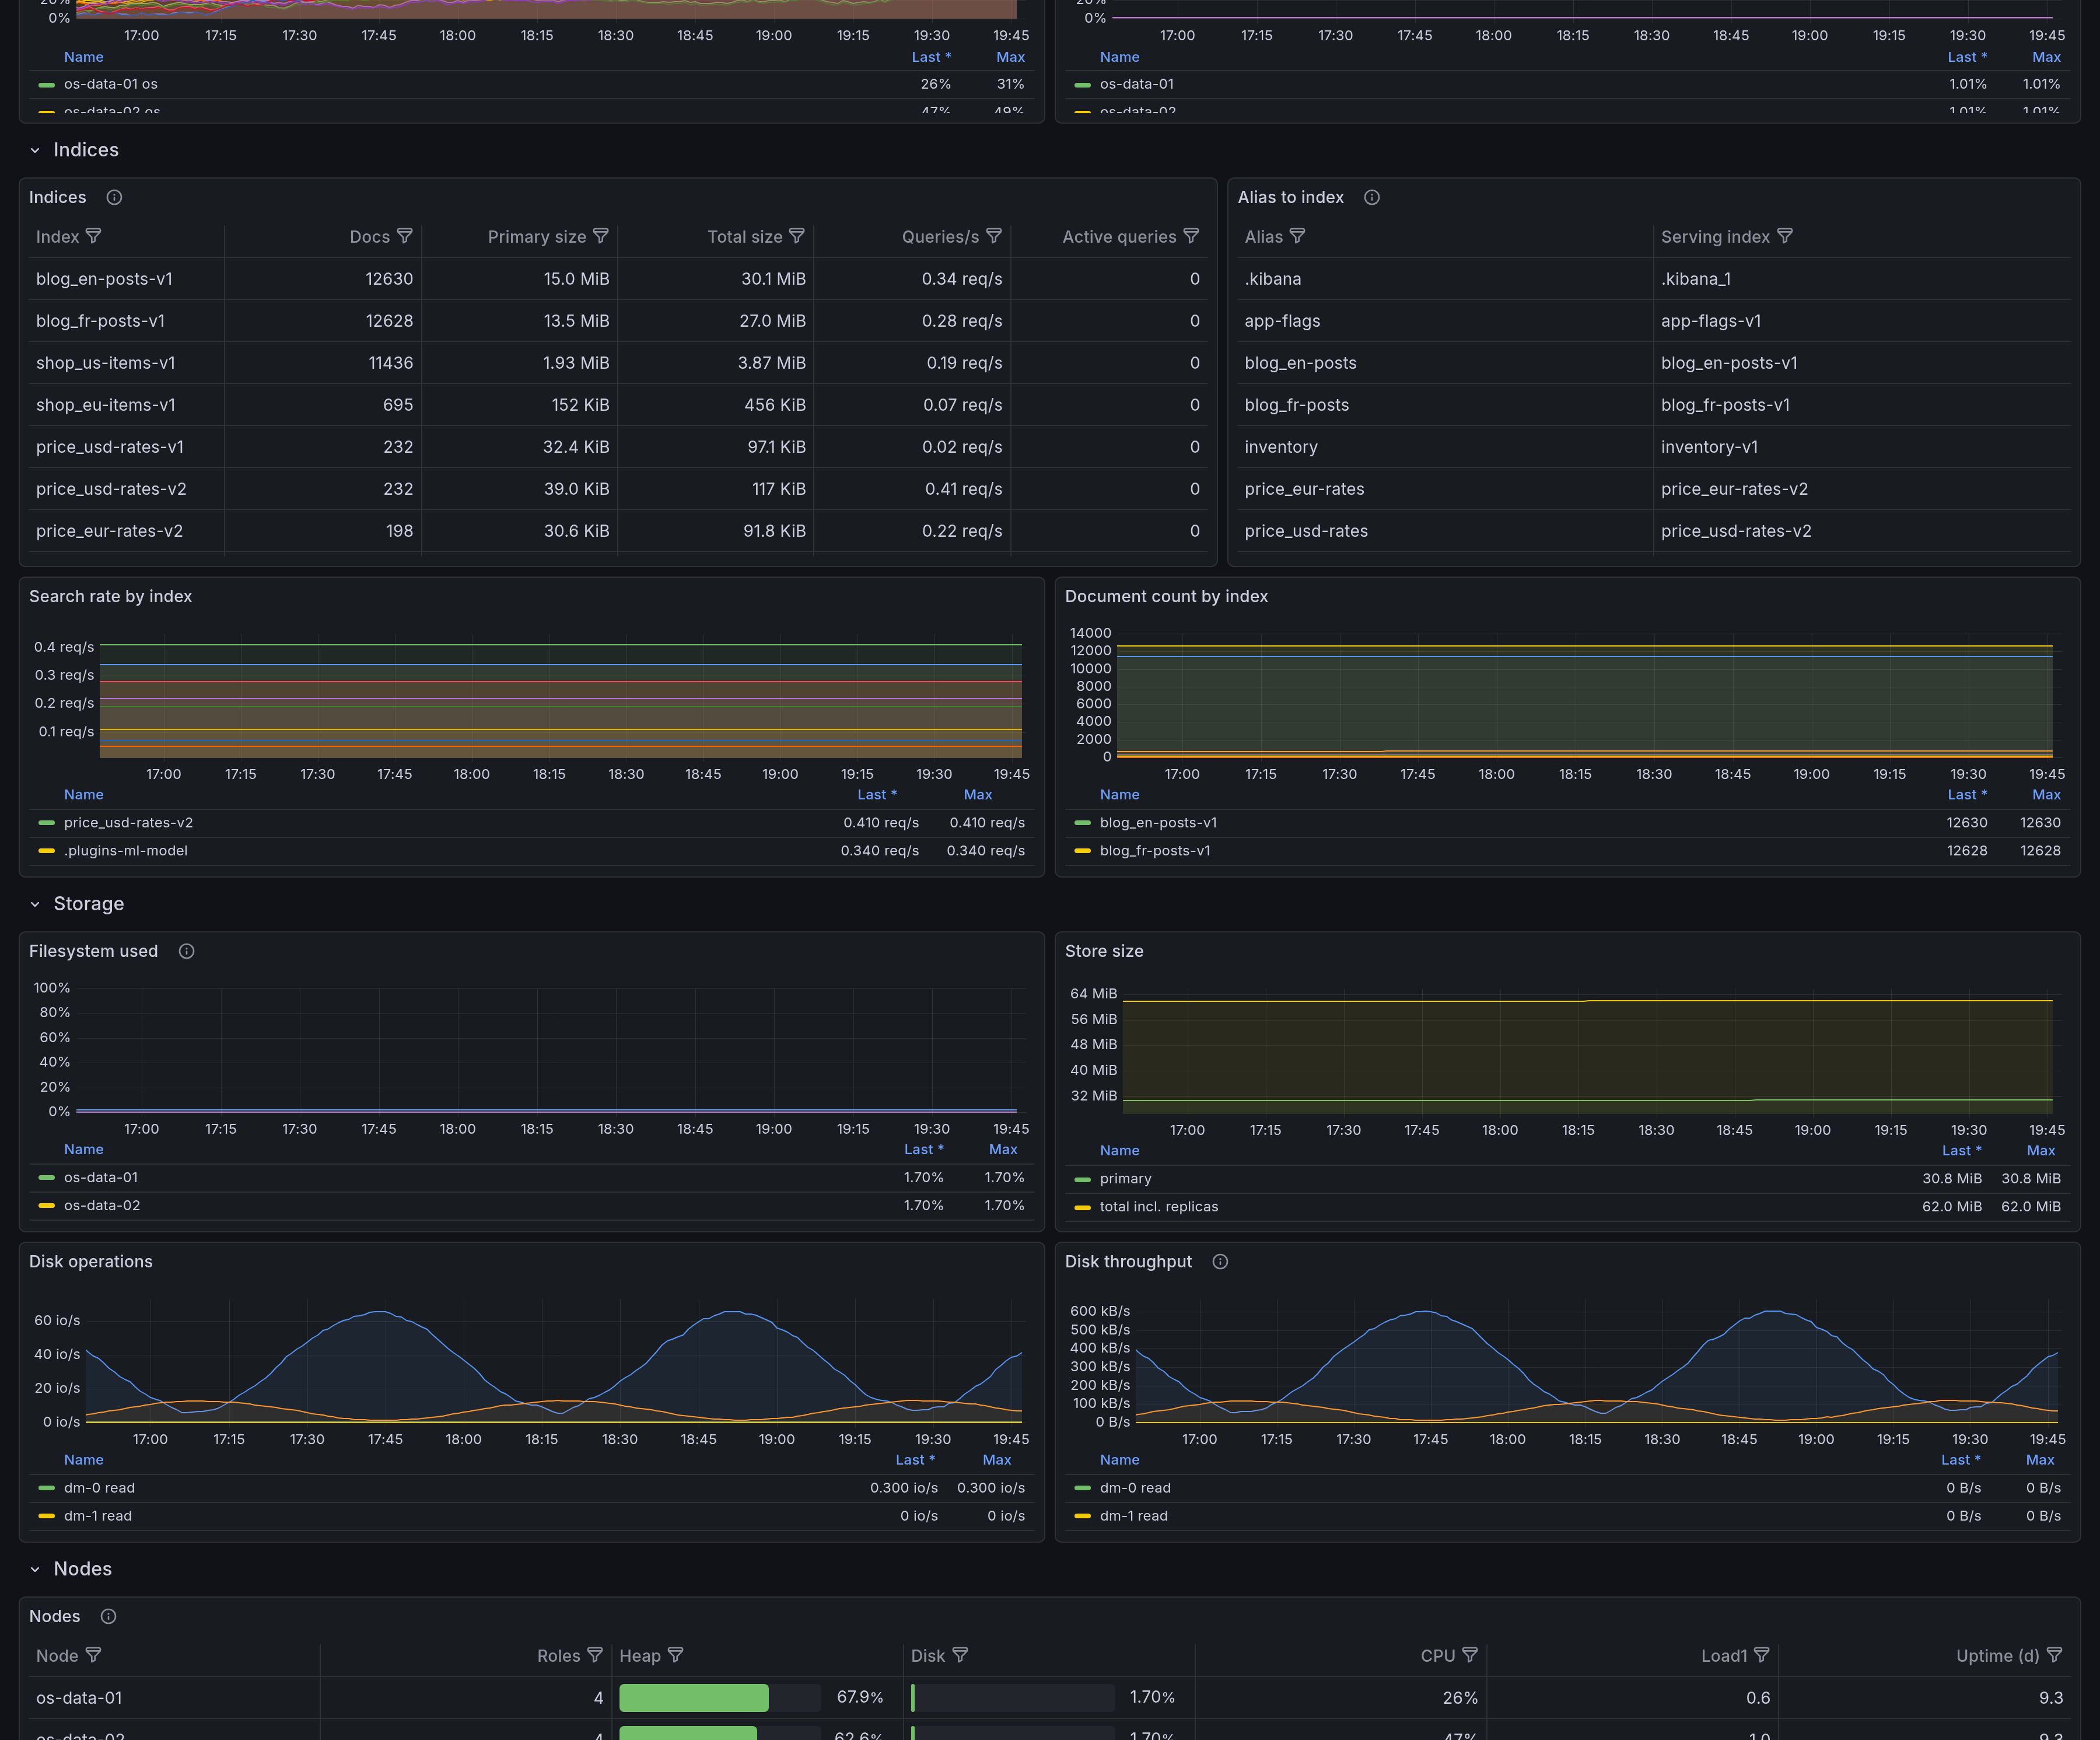
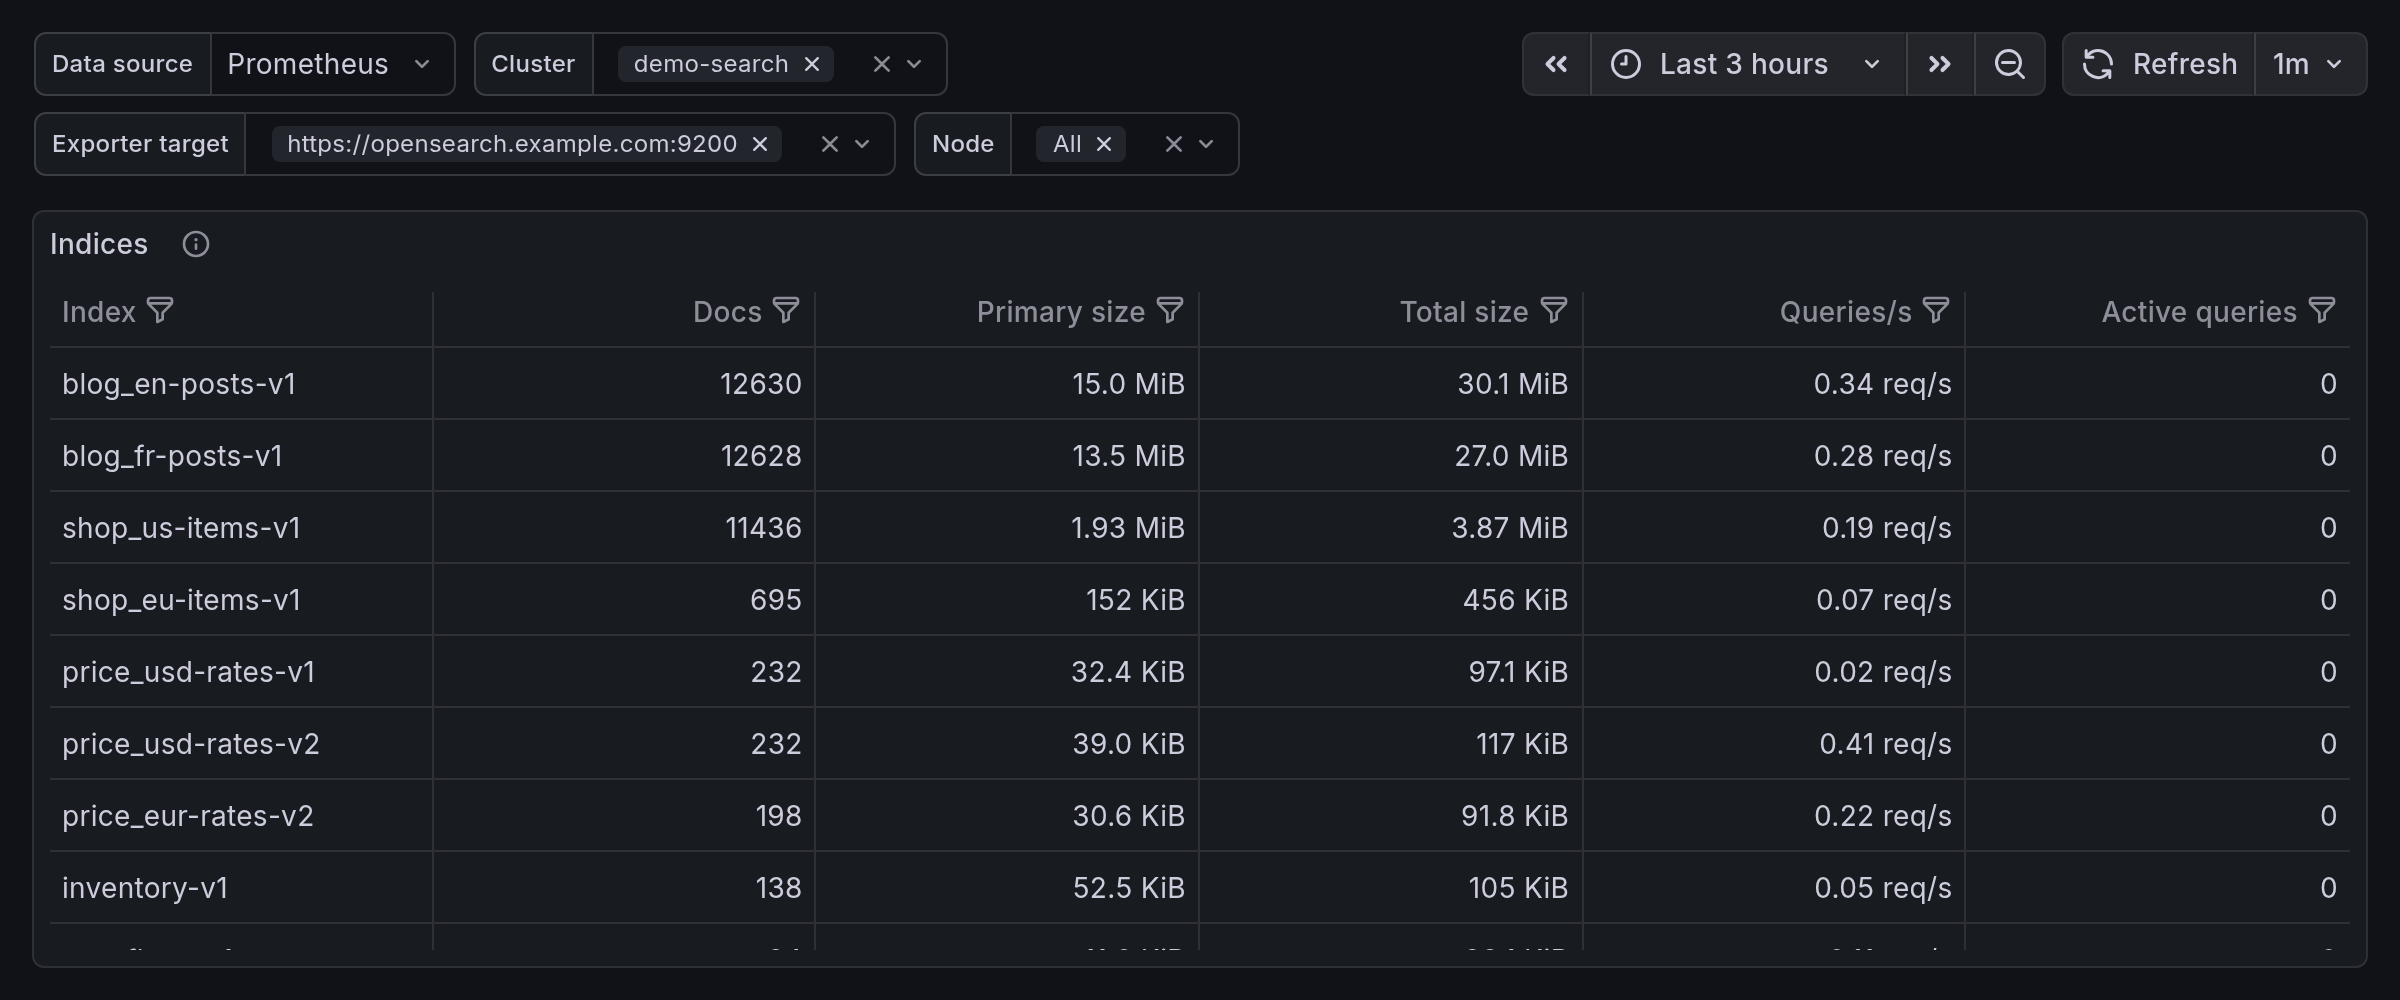
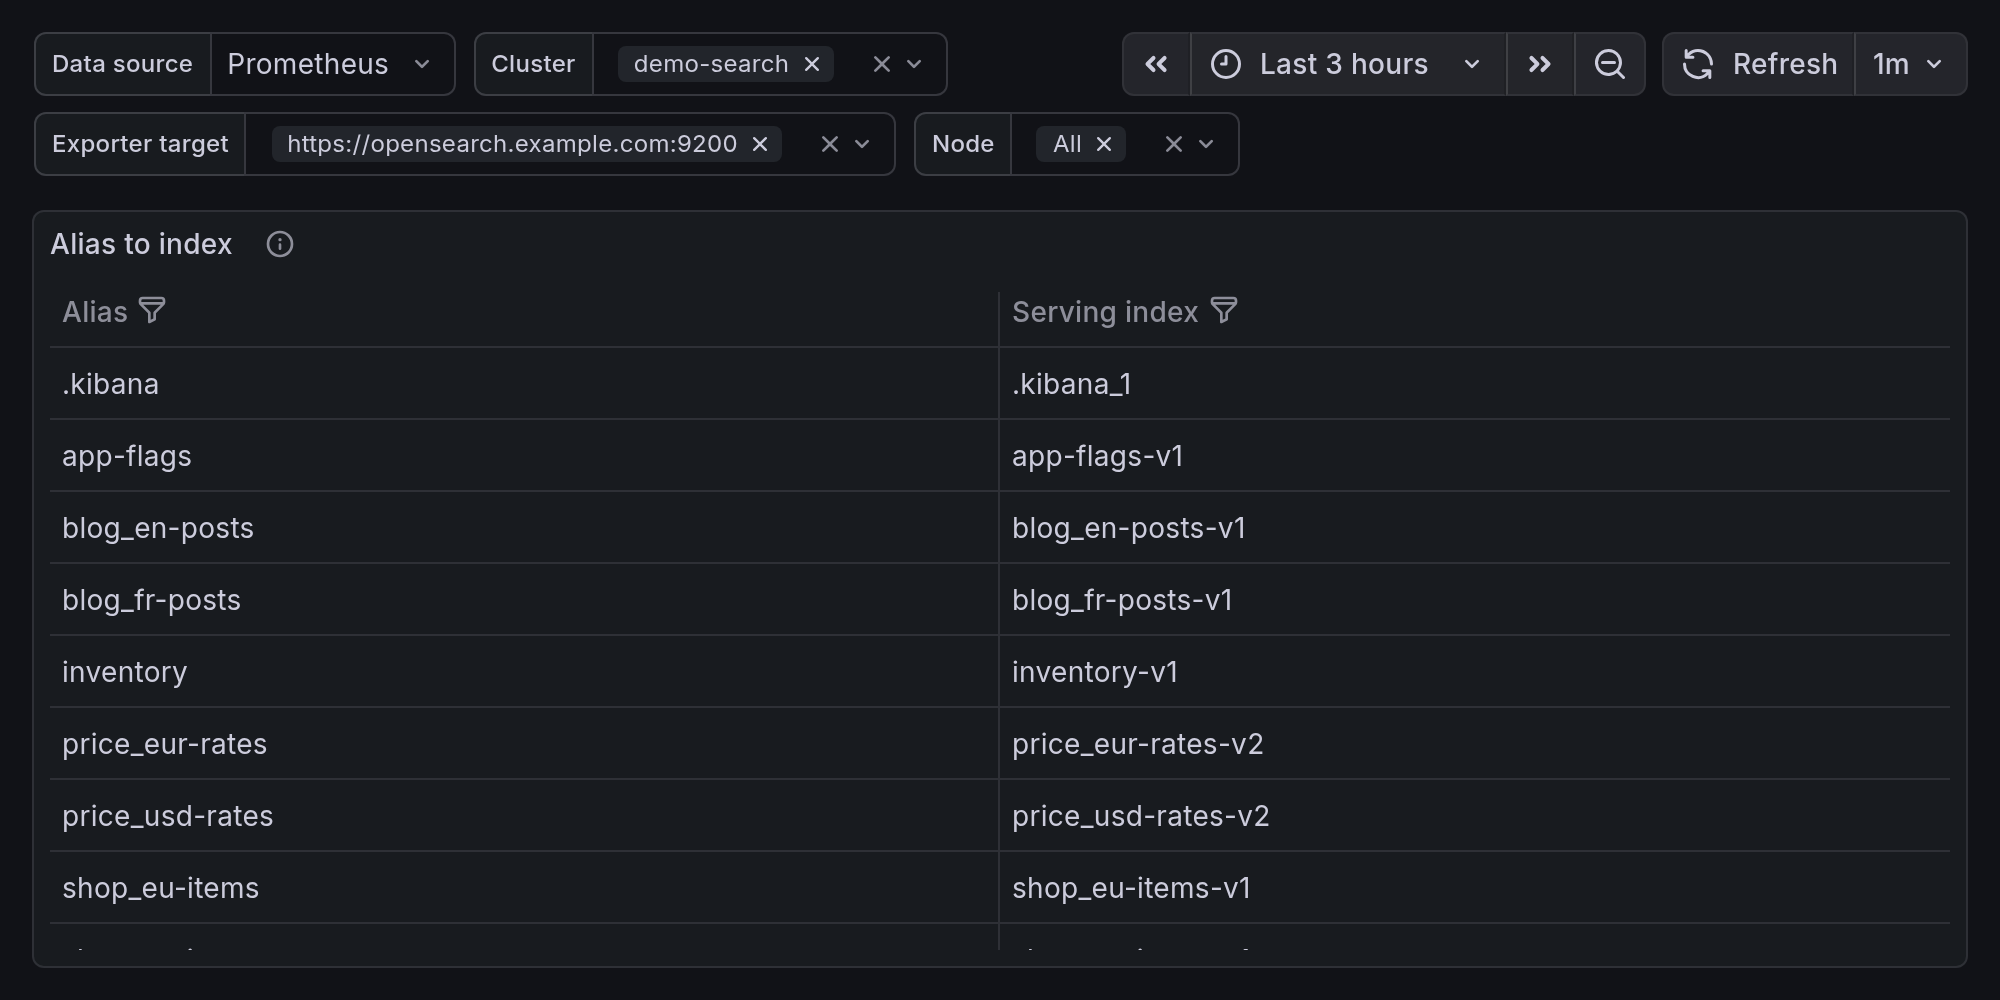
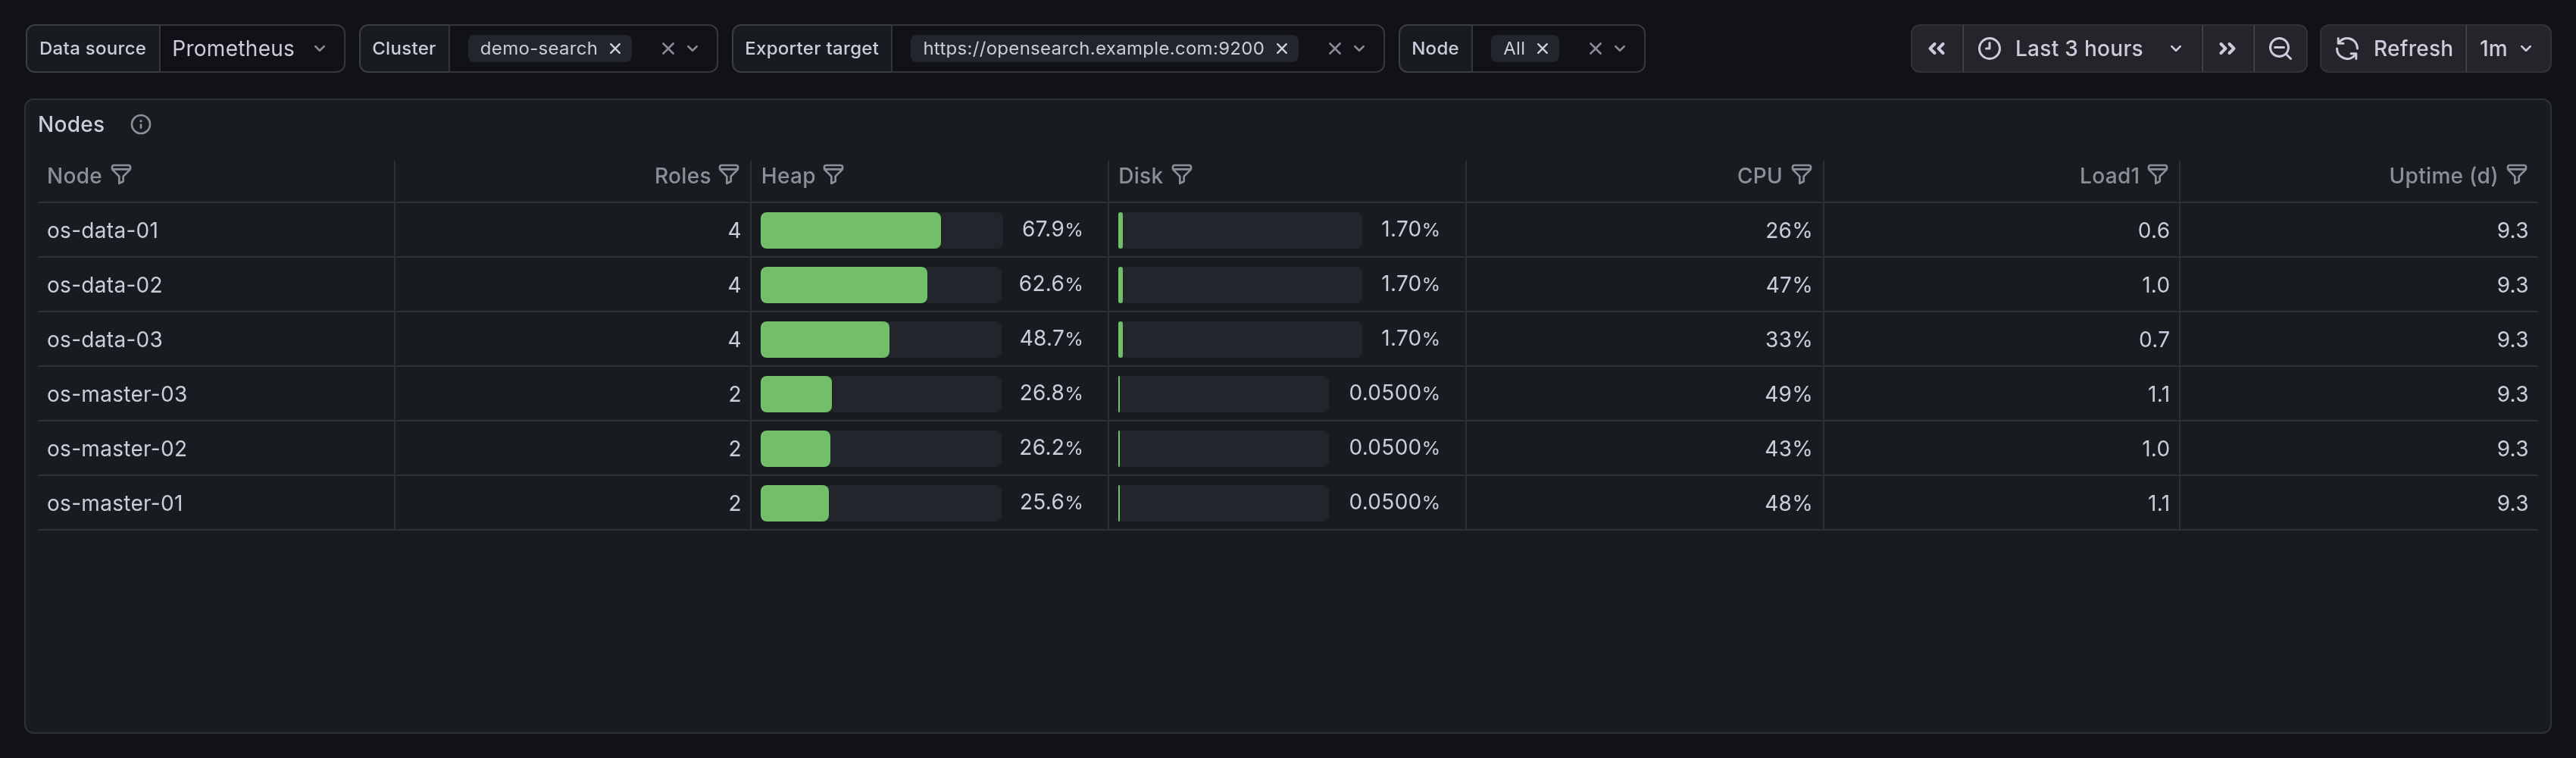
Server-side view of an OpenSearch or Elasticsearch cluster: cluster health, search and indexing throughput, JVM and breaker saturation, per-index size and query rate, storage, and a node table. Verified against OpenSearch 3.5 with exporter v1.11.0.
Requires prometheus-community/elasticsearch_exporter with --es.indices and
--es.indices_settings. No panel reads a metric from the shards, snapshots or mappings
collectors, so nothing goes blank if you leave those off to control cardinality.
Four things it gets right that are easy to get wrong:
- The
elasticsearch_indices_*families label the node inname, whileelasticsearch_index_stats_*label the index inindex. Cluster-wide rates come from the first, per-index rates from the second. Dashboards that treatnameas an index show node counts under index labels. elasticsearch_indices_aliasesis surfaced as an alias-to-index table. If you reindex intoname-v2and swap the alias, this is the only place that change is visible, and it is what ties a shift in document count or latency to the swap that caused it.- Circuit breakers are shown against their own limit rather than as raw bytes, so the number is comparable across breakers and cluster sizes.
- Filesystem headroom uses
available, notfree; free counts space reserved for root, which the engine cannot use.
Thread-pool panels carry an unfiltered total alongside the per-pool breakdown, so a quiet cluster reads as quiet rather than as a missing metric. The per-pool series are filtered to non-zero pools to keep the legend short — a six-node cluster exposes roughly 84.
Select your Prometheus from the Data source picker; Cluster, Exporter target and
Node narrow the view.
Data source config
Collector config:
Upload an updated version of an exported dashboard.json file from Grafana
| Revision | Description | Created | |
|---|---|---|---|
| Download |

OpenSearch

Easily monitor OpenSearch, an open source software suite for search, analytics, and observability applications, with Grafana Cloud's out-of-the-box monitoring solution.
Learn more